Custom native ETW heap events
Visual Studio contains a variety of profiling and diagnostic tools, including a native memory profiler. This profiler hooks ETW events from the heap provider and provides analysis of how memory is being allocated and used. By default, this tool can only analyze allocations made from the standard Windows heap, and any allocations outside this native heap would not be displayed.
There are many cases in which you may want to use your own custom heap and avoid the allocation overhead from the standard heap. For instance, you could use VirtualAlloc to allocate a large amount of memory at the start of the app or game, and then manage your own blocks within that list. In this scenario, the memory profiler tool would only see that initial allocation, and not your custom management done inside the memory chunk. However, using the Custom Native Heap ETW Provider, you can let the tool know about any allocations you are making outside the standard heap.
For example, in a project like the following where MemoryPool is a custom heap, you would only see a single allocation on the Windows heap:
class Foo
{
public:
    int x, y;
};

...

// MemoryPool is a custom managed heap, which allocates 8192 bytes
// on the standard Windows Heap named "Windows NT"
MemoryPool<Foo, 8192> mPool;

// the "allocate" method requests memory from the pool created above
// and is cast to an object of type Foo, shown above
Foo* pFoo1 = (Foo*)mPool.allocate();
Foo* pFoo2 = (Foo*)mPool.allocate();
Foo* pFoo3 = (Foo*)mPool.allocate();
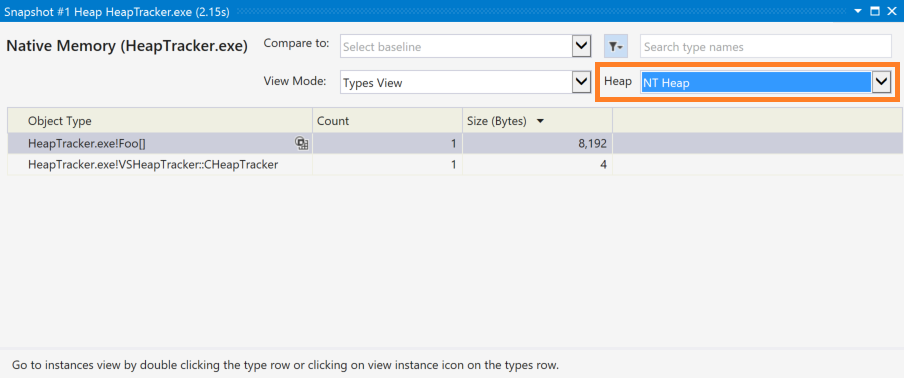
A snapshot from the Memory Usage tool without custom heap tracking would show just the single 8192 byte allocation, and none of the custom allocations being made by the pool:

By performing the following steps, we can use this same tool to track memory usage in our custom heap.
How to use
This library can be easily used in C and C++.
Include the header for the custom heap ETW provider:
#include <VSCustomNativeHeapEtwProvider.h>Add the
__declspec(allocator)decorator to any function in your custom heap manager that returns a pointer to newly allocated heap memory. This decorator allows the tool to correctly identify the type of the memory being returned. For example:__declspec(allocator) void *MyMalloc(size_t size);Note
This decorator will tell the compiler that this function is a call to an allocator. Each call to the function will output the address of the callsite, the size of the call instruction, and the typeId of the new object to a new
S_HEAPALLOCSITEsymbol. When a callstack is allocated, Windows will emit an ETW event with this information. The memory profiler tool walks the callstack looking for a return address matching anS_HEAPALLOCSITEsymbol, and the typeId information in the symbol is used to display the runtime type of the allocation.In short, this means a call that looks like
(B*)(A*)MyMalloc(sizeof(B))will show up in the tool as being of typeB, notvoidorA.For C++, create the
VSHeapTracker::CHeapTrackerobject, providing a name for the heap, which will show up in the profiling tool:auto pHeapTracker = std::make_unique<VSHeapTracker::CHeapTracker>("MyCustomHeap");If you are using C, use the
OpenHeapTrackerfunction instead. This function will return a handle that you will use when calling other tracking functions:VSHeapTrackerHandle hHeapTracker = OpenHeapTracker("MyHeap");When allocating memory using your custom function, call the
AllocateEvent(C++) orVSHeapTrackerAllocateEvent(C) method, passing in the pointer to the memory and its size, to track the allocation:pHeapTracker->AllocateEvent(memPtr, size);or
VSHeapTrackerAllocateEvent(hHeapTracker, memPtr, size);Important
Don't forget to tag your custom allocator function with the
__declspec(allocator)decorator described earlier.When deallocating memory using your custom function, call the
DeallocateEvent(C++) orVSHeapTracerDeallocateEvent(C) function, passing in the pointer to the memory, to track the deallocation:pHeapTracker->DeallocateEvent(memPtr);or:
VSHeapTrackerDeallocateEvent(hHeapTracker, memPtr);When reallocating memory using your custom function, call the
ReallocateEvent(C++) orVSHeapReallocateEvent(C) method, passing in a pointer to the new memory, the size of the allocation, and a pointer to the old memory:pHeapTracker->ReallocateEvent(memPtrNew, size, memPtrOld);or:
VSHeapTrackerReallocateEvent(hHeapTracker, memPtrNew, size, memPtrOld);Finally, to close and clean up the custom heap tracker in C++, use the
CHeapTrackerdestructor, either manually or via standard scoping rules, or theCloseHeapTrackerfunction in C:delete pHeapTracker;or:
CloseHeapTracker(hHeapTracker);
Track memory usage
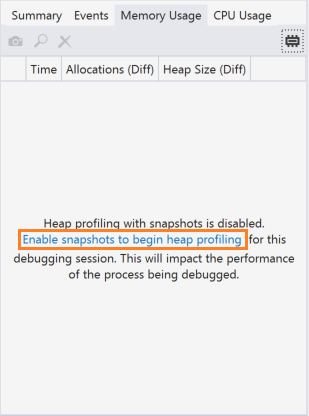
With these calls in place, your custom heap usage can now be tracked using the standard Memory Usage tool in Visual Studio. For more information on how to use this tool, please see the Memory Usage documentation. Ensure you have enabled heap profiling with snapshots, otherwise you will not see your custom heap usage displayed.

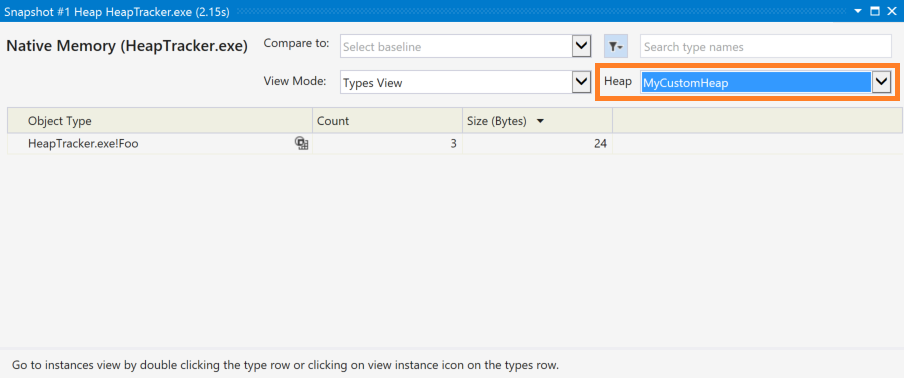
To view your custom heap tracking, use the Heap dropdown located at the upper-right corner of the Snapshot window to change the view from NT Heap to your own heap as named previously.

Using the code example above, with MemoryPool creating a VSHeapTracker::CHeapTracker object, and our own allocate method now calling the AllocateEvent method, you can now see the result of that custom allocation, showing three instances totaling 24 bytes, all of type Foo.
The default NT Heap heap looks the same as earlier, with the addition of our CHeapTracker object.

As with the standard Windows heap, you can also use this tool to compare snapshots and look for leaks and corruption in your custom heap, which is described in the main Memory Usage documentation.
Tip
Visual Studio also contains a Memory Usage tool in the Performance Profiling toolset, which is enabled from the Debug > Performance Profiler menu option, or the Alt+F2 keyboard combination. This feature does not include heap tracking and will not display your custom heap as described here. Only the Diagnostic Tools window, which can be enabled with the Debug > Windows > Show Diagnostic Tools menu, or the Ctrl+Alt+F2 keyboard combination, contains this functionality.