First look at profiling tools (C#, Visual Basic, C++, F#)
Application performance measuring tools are essential for developers who want to optimize their code and improve application performance. Visual Studio offers a range of profiling and diagnostics tools that can help you diagnose memory and CPU usage and other application-level issues. With these tools, you can accumulate performance data while you run your application. A profiler can help you make informed decisions quickly by providing a visual depiction of execution times and CPU usage for your application. In this article, we give a quick look at the most common profiling tools.
For help with choosing the correct tool, or to see profiling tool support for different app types, see Which tool should I use? For a tutorial that shows a general approach to optimizing code using the profiling tools, see Case study: Beginner's guide to optimizing code.
Measure performance in release builds
Tools in the Performance Profiler are intended to provide analysis for Release builds. In the Performance Profiler, you can collect diagnostic info while the app is running, and then examine the collected information after the app is stopped (a post-mortem analysis).
Open the Performance Profiler by choosing Debug > Performance Profiler (or Alt + F2).
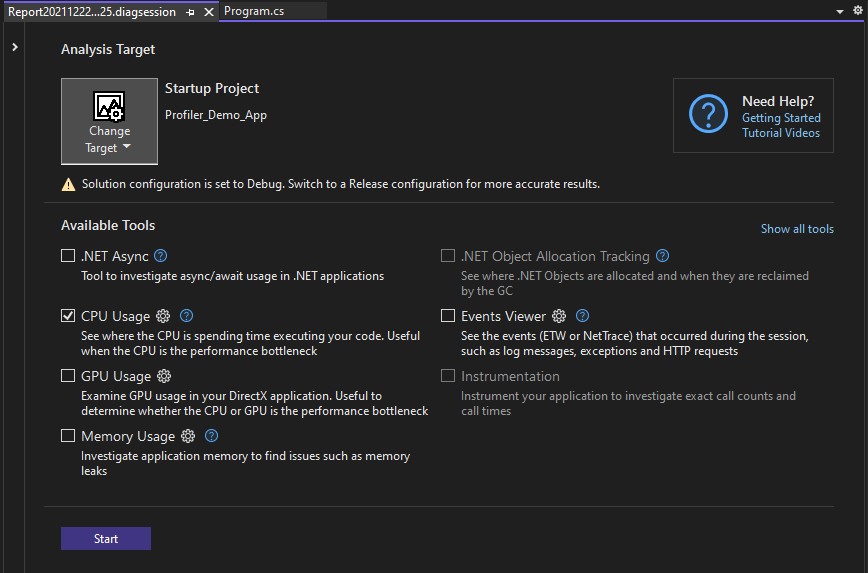
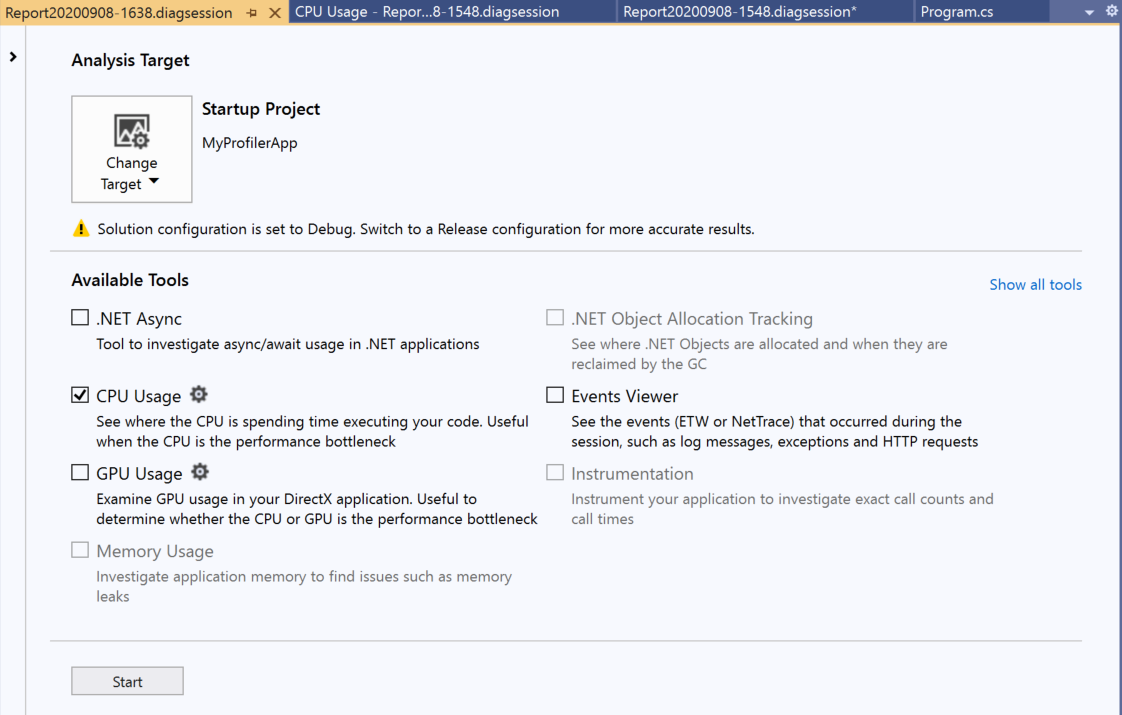
For more information on using the CPU Usage or Memory usage tool in the Performance Profiler vs. the debugger-integrated tools, see Run profiling tools with or without the debugger.
Tools available in the Performance Profiler include:
- CPU usage
- .NET object allocation
- Memory usage
- Instrumentation
- .NET async tool
- File I/O
- .NET Counters
- Database tool
- GPU usage
To see profiling tool support for different app types, see Which tool should I use?.
In some scenarios, the window allows you to select multiple profiling tools. Tools such as CPU Usage may provide complementary data that you can use to help in your analysis. You can also use the command-line profiler to enable scenarios involving multiple profiling tools.
Measure performance while debugging
The profiling tools that you can access during a debugging session are available in the Diagnostic Tools window. The Diagnostic Tools window appears automatically unless you have turned it off. To bring up the window, click Debug / Windows / Show Diagnostic Tools (or press Ctrl + Alt + F2). With the window open, you can select tools for which you want to collect data.
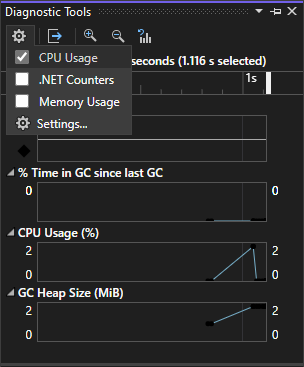
While you are debugging, you can use the Diagnostic Tools window to analyze CPU, memory usage, .NET counters, and you can view events that show performance-related information.
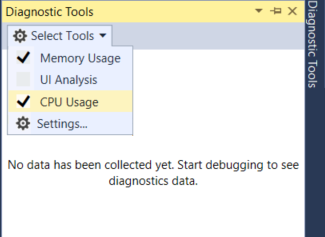
While you are debugging, you can use the Diagnostic Tools window to analyze CPU and memory usage, and you can view events that show performance-related information.
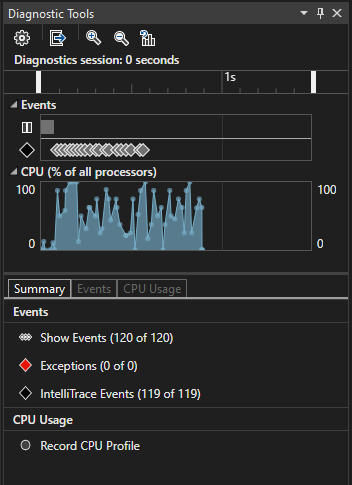
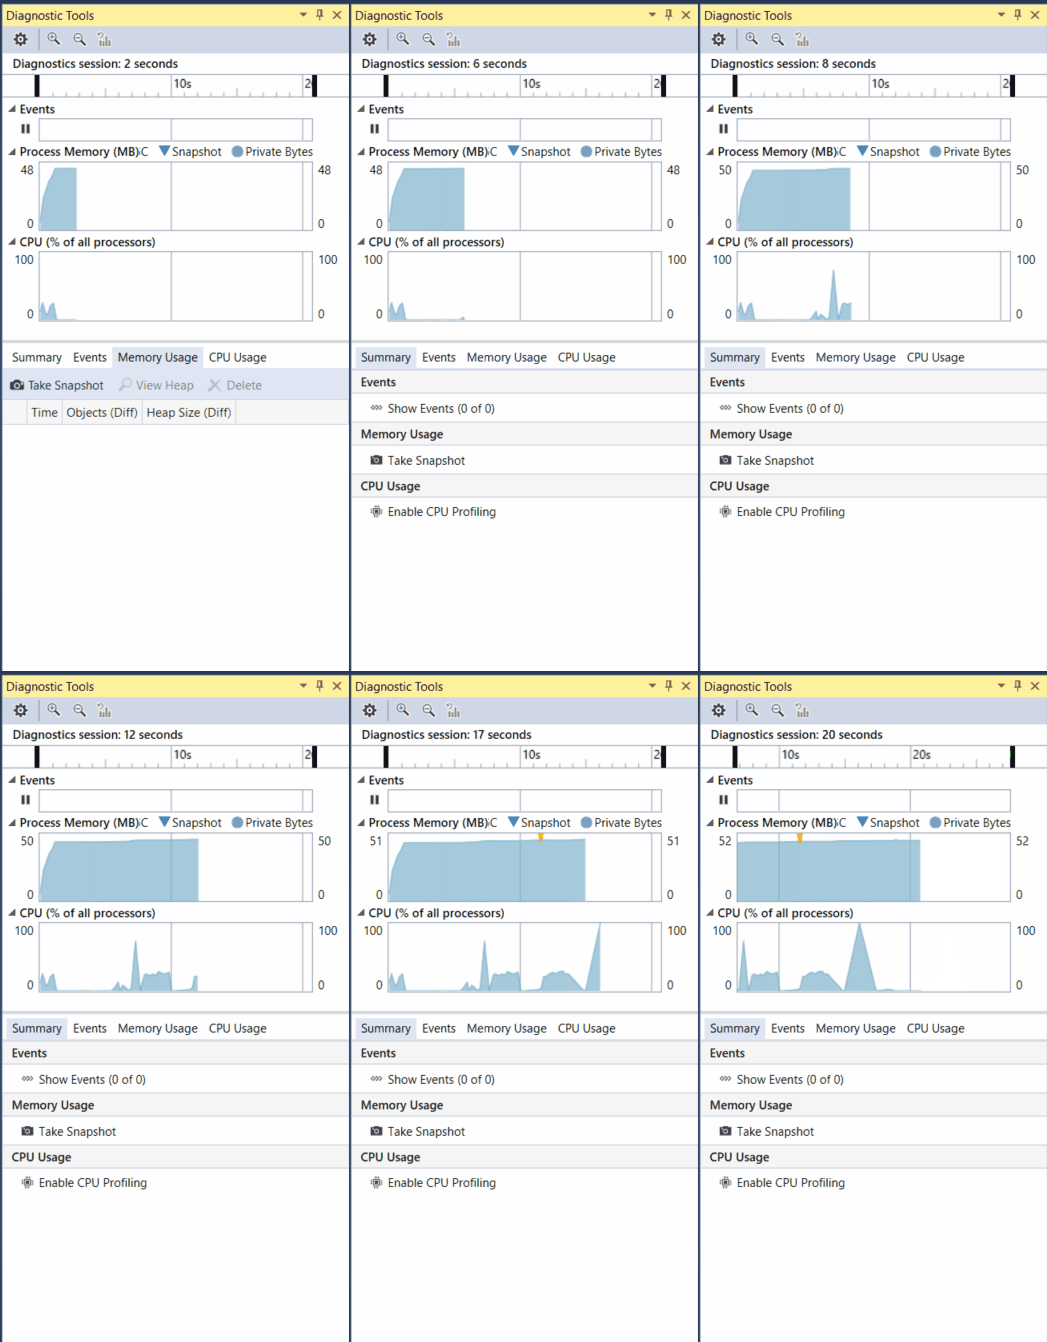
The Diagnostic Tools window is a common way to profile apps, but for Release builds you can also do a post-mortem analysis of your app instead. For more information on different approaches, see Run profiling tools with or without the debugger. To see profiling tool support for different app types, see Which tool should I use?.
Tools available in the Diagnostic Tools window or during a debugging session include:
Tip
Use relaunch to skip the launch page and automatically run with your previous settings by pressing Alt+F2 or by clicking Debug > Performance Profiler.
Note
Windows 8 and later is required to run profiling tools with the debugger (Diagnostic Tools window).
Analyze CPU usage
The CPU Usage tool is a good place to start analyzing your app's performance. It will tell you more about CPU resources that your app is consuming. You can use the debugger-integrated CPU Usage tool or the post-mortem CPU Usage tool.
When using the debugger-integrated CPU Usage tool, open the Diagnostics Tool window (if it's closed, choose Debug / Windows / Show Diagnostic Tools). While debugging, open the Summary view, and select Record CPU Profile.

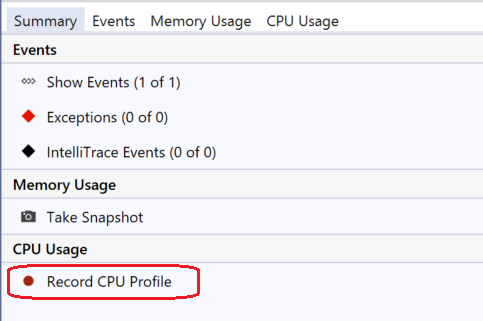
One way to use the tool is to set two breakpoints in your code, one at the beginning and one at the end of the function or the region of code you want to analyze. Examine the profiling data when you are paused at the second breakpoint.
The CPU Usage view shows you a list of functions ordered by longest running, with the longest running function at the top under Top Functions. The Hot Path section shows you the call stack for the functions that are using the most CPU. These lists can help guide you to functions where performance bottlenecks are happening.
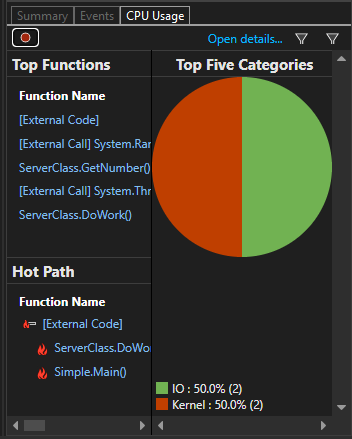
The CPU Usage view shows you a list of functions ordered by longest running, with the longest running function at the top. This can help guide you to functions where performance bottlenecks are happening.
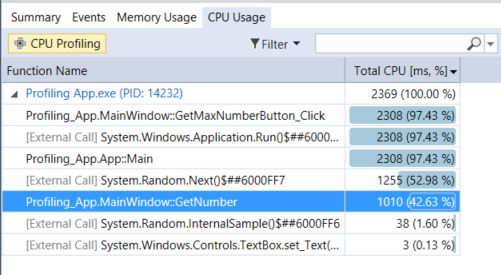
Click on a function that you are interested in, and you will see a more detailed Call tree view, with the selected function highlighted. The table shows columns with data such as the time spent in the function, including called functions (Total CPU), and a second column that shows the time spent in a function, excluding called functions (Self CPU). This data can help you evaluate whether the function itself is a performance bottleneck.
Tip
The Visual Studio profiler supports both collecting and viewing traces. The profiler can also view traces that have been collected previously by other tools, such as dotnet-trace. Dotnet-trace produces sampling results, not an instrumented trace. For more information, see dotnet-trace.

Click on a function that you are interested in, and you will see a more detailed three-pane "butterfly" view, with the selected function in the middle of the window, the calling function on the left, and called functions on the right. The Function Body section shows the total amount of time (and the percentage of time) spent in the function body excluding time spent in calling and called functions. This data can help you evaluate whether the function itself is a performance bottleneck.
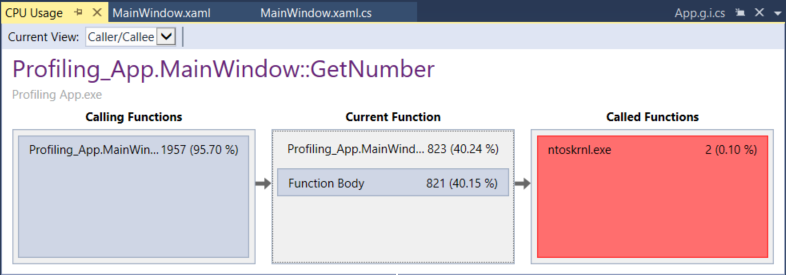
Analyze memory usage
The Diagnostic Tools window also allows you to evaluate memory usage in your app using the Memory Usage tool. For example, you can look at the number and size of objects on the heap. You can use the debugger-integrated Memory Usage tool or the post-mortem Memory Usage tool in the Performance Profiler.
.NET developers may choose between either the .NET Object Allocation tool or the Memory usage tool.
- The .NET Object Allocation tool helps you identify allocation patterns and anomalies in your .NET code, and helps identify common issues with garbage collection. This tool runs only as a post-mortem tool. You can run this tool on local or remote machines.
- The Memory usage tool is helpful in identifying memory leaks, which are not typically common in .NET apps. If you need to use debugger features while checking memory, such as stepping through code, the debugger-integrated Memory usage tool is recommended.
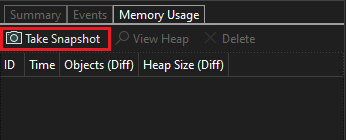
To analyze memory usage with the Memory Usage tool, you need to take at least one memory snapshot. Often, the best way to analyze memory is to take two snapshots; the first right before a suspected memory issue, and the second snapshot right after a suspected memory issue occurs. Then you can view a diff of the two snapshots and see exactly what changed. The following illustration shows taking a snapshot with the debugger-integrated tool.
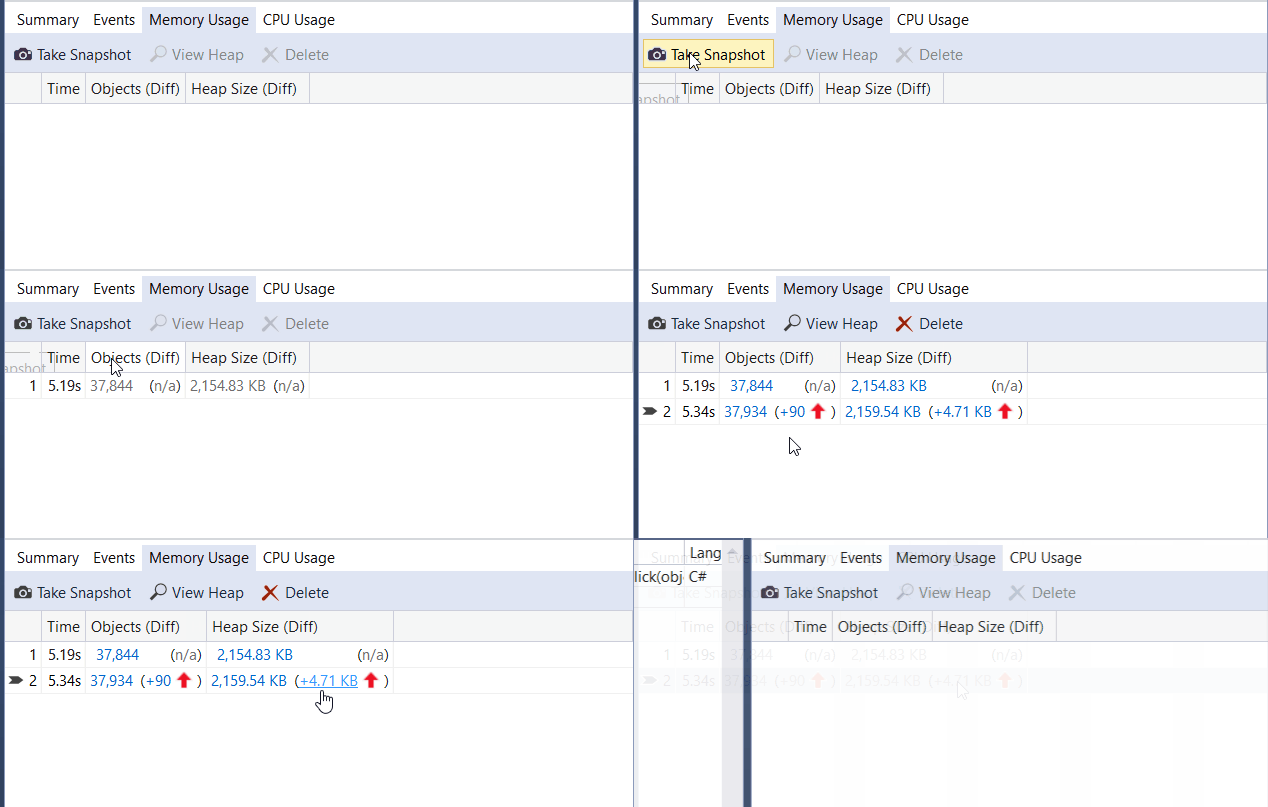
When you select one of the arrow links, you are given a differential view of the heap (a red up arrow  shows an increasing object count (left) or an increasing heap size (right)). If you click the right link, you get a differential heap view ordered by objects that increased the most in heap size. This can help you pinpoint memory problems. For example, in the illustration below, the bytes used by
 ClassHandlersStore objects increased by 3,492 bytes in the second snapshot.

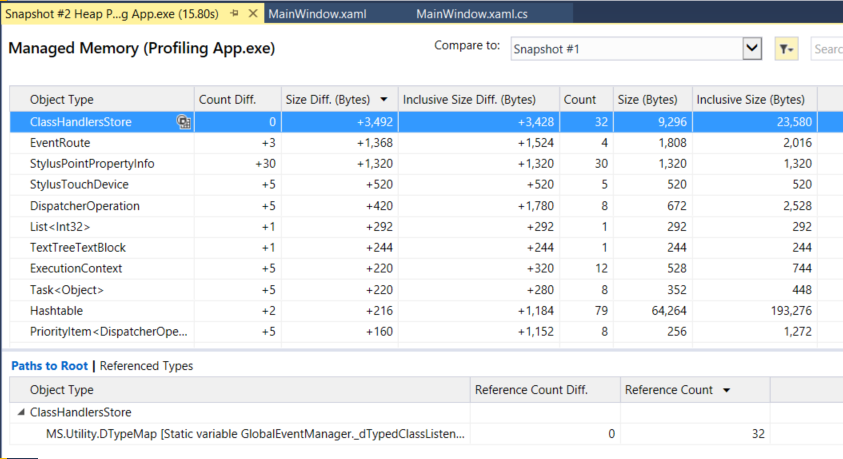
If you click the link on the left instead in the Memory Usage view, the heap view is organized by object count; the objects of a particular type that increased the most in number are shown at the top (sorted by Count Diff column).
Instrumentation
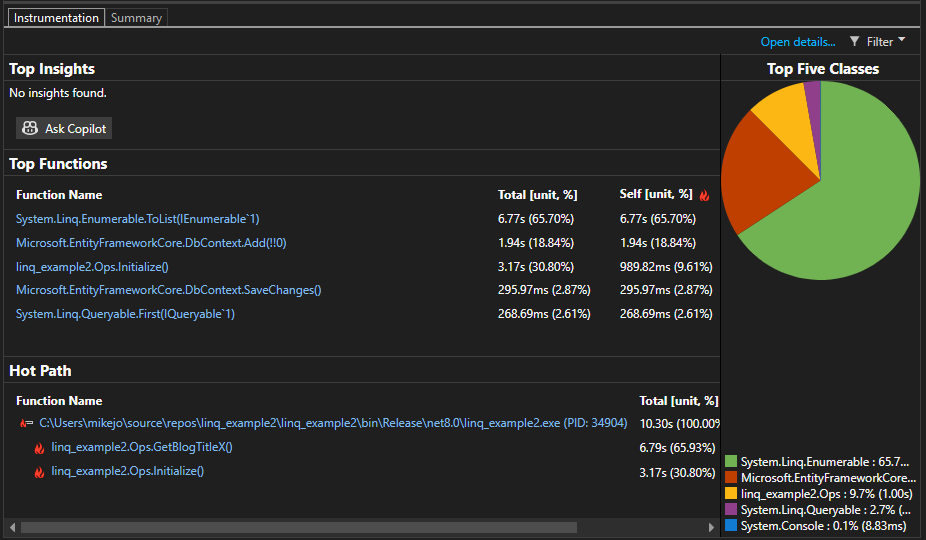
The Instrumentation tool is similar to the CPU Usage tool, except that it provides exact call counts and wall clock time instead of CPU utilization. The instrumentation method requires more overhead than the CPU Usage tool. This tool is available in the Performance Profiler. Open the Performance Profiler by choosing Debug > Performance Profiler (or Alt + F2). For more information, see Instrumentation.
Examine File I/O
The File I/O tool helps you understand how you can optimize your File I/O operations to improve performance in your apps. If you’re trying to investigate and diagnose slow loading times, the new File IO tool can help you understand how the I/O operations impact your spent time. This tool is available in the Performance Profiler. Open the Performance Profiler by choosing Debug > Performance Profiler (or Alt + F2).
The tool shows file read and file write operations in a tabbed list view.

Examine performance using PerfTips
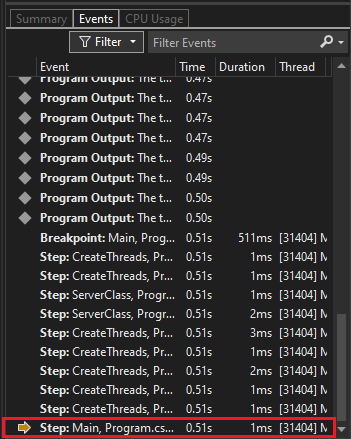
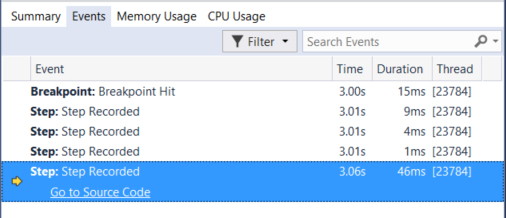
Often, the easiest way to view performance information is to use PerfTips. Using PerfTips, you can view performance information while interacting with your code. You can check information such as the duration of the event (measured from when the debugger was last paused, or when the app started). For example, if you step through code (F10, F11), PerfTips show you the app runtime duration from the previous step operation to the current step.


You can use PerfTips to examine how long it takes for a code block to execute, or how long it takes for a single function to complete.
PerfTips show the same events that also show up in the Events view of the Diagnostic Tools. In the Events view, you can view different events that occur while you are debugging, such as the setting of a breakpoint or a code stepping operation.
Note
If you have Visual Studio Enterprise, you can also see IntelliTrace events in this tab.
Analyze asynchronous code (.NET)
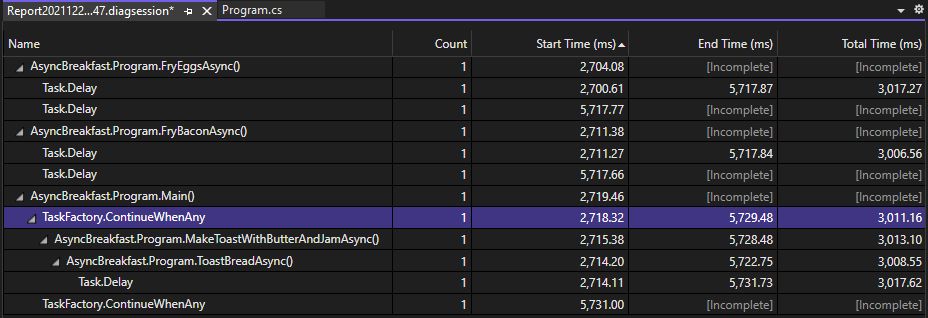
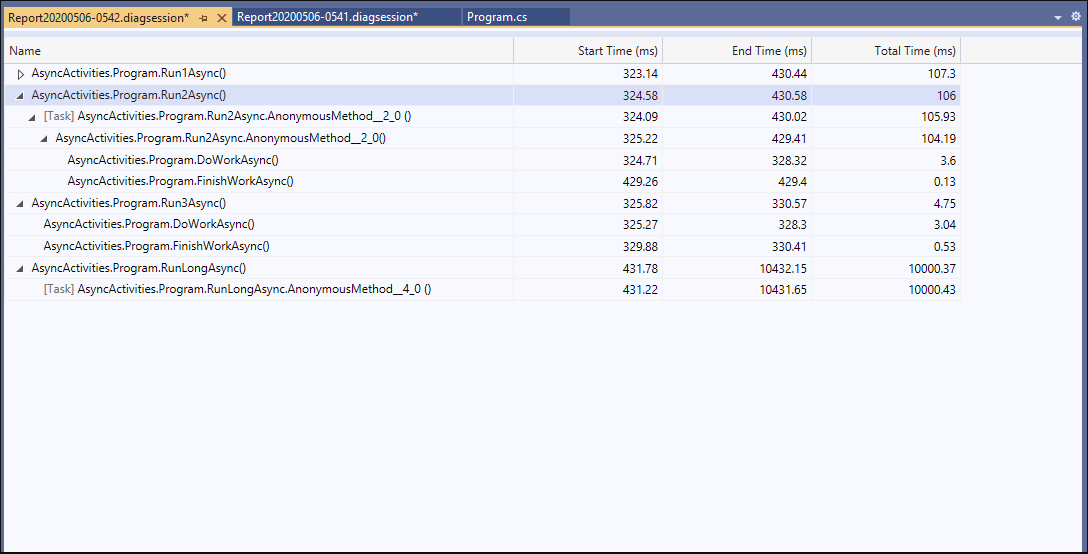
The .NET Async tool allows you to analyze the performance of asynchronous code in your application. This tool is available in the Performance Profiler. Open the Performance Profiler by choosing Debug > Performance Profiler (or Alt + F2).
The tool shows each async operation in a list view. You can see information such as the start time, end time, and total time for an async operation.
Analyze database performance (.NET Core)
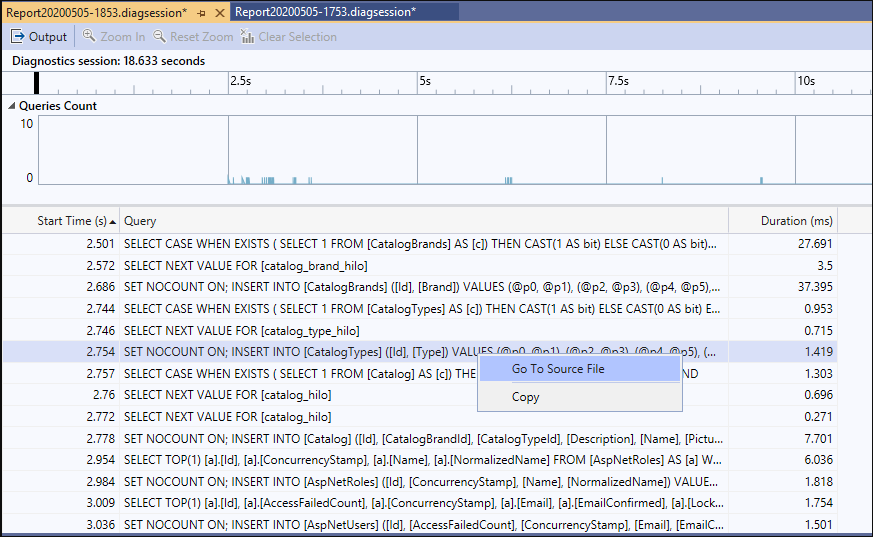
For .NET Core apps that use ADO.NET or Entity Framework Core, the Database tool allows you to record the database queries that your application makes during a diagnostic session. You can then analyze information about individual queries in order to find places where your app's performance can be improved. This tool is available in the Performance Profiler. Open the Performance Profiler by choosing Debug > Performance Profiler (or Alt + F2).
The tool shows each query in a list view. You can see information such as the query start time and duration.
Visualize .NET counters (.NET Core)
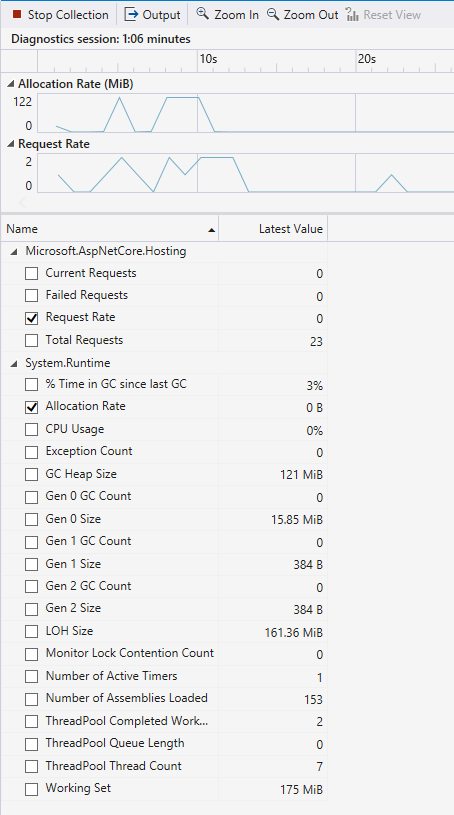
Starting in Visual Studio 2019 version 16.7, you can use the .NET Counters tool in Visual Studio to visualize performance counters. You can visualize counters created using dotnet counters. dotnet counters supports many counters such as CPU usage and garbage collector heap size.
The tool shows live values for each counter in a list view.
Examine application events
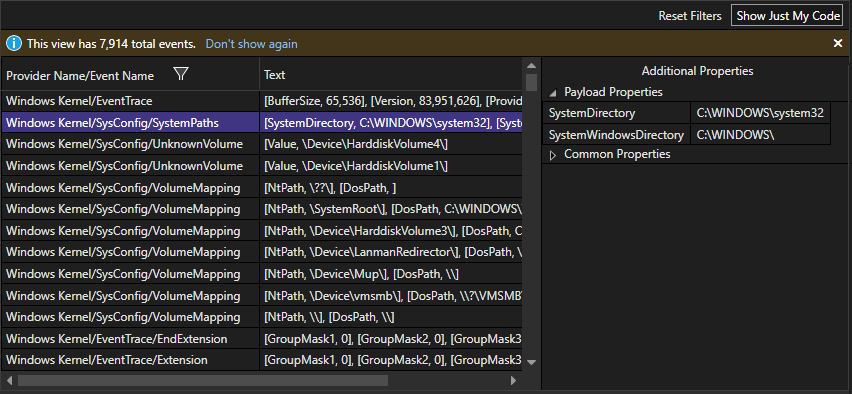
The generic events viewer allows you to view the activity of your application through a list of events, such as module load, thread start, and system configurations, to help better diagnose how your application is performing right within the Visual Studio profiler. This tool is available in the Performance Profiler. Open the Performance Profiler by choosing Debug > Performance Profiler (or Alt + F2).
The tool shows each event in a list view. Columns provide information about each event, such as the event name, timestamp, and process ID.
View custom events in the timeline graphs
You can programatically create custom events that appear as icons in the timeline graphs such as the CPU utilization and memory usage timeline graphs. For more information, see Add user marks to timeline.
Analyze resource consumption (XAML)
In XAML apps, such as Windows desktop WPF apps and UWP apps, you can analyze resource consumption using the Application Timeline tool. For example, you can analyze the time spent by your application preparing UI frames (layout and render), servicing network and disk requests, and in scenarios like application startup, page load, and Window resize. To use the tool, choose Application Timeline in the Performance Profiler, and then choose Start. In your app, go through the scenario with a suspected resource consumption issue, and then choose Stop collection to generate the report.
Low framerates in the Visual throughput graph may correspond to visual problems that you see when running your app. Similarly, high numbers in the UI thread utilization graph may also correspond to UI responsiveness issues. In the report, you can select a time period with a suspected performance issue, and then examine the detailed UI thread activities in the Timeline details view (lower pane).
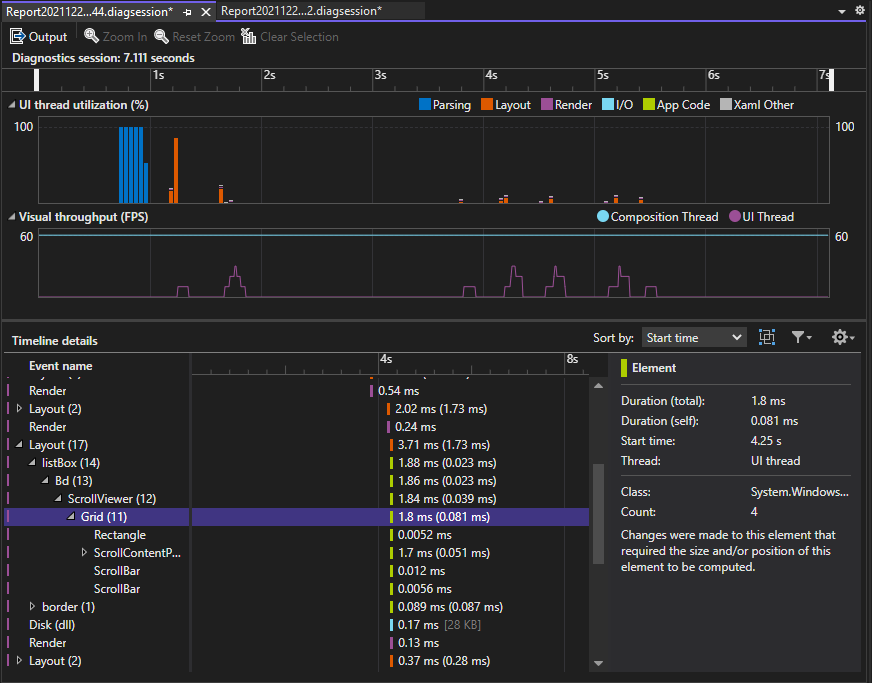
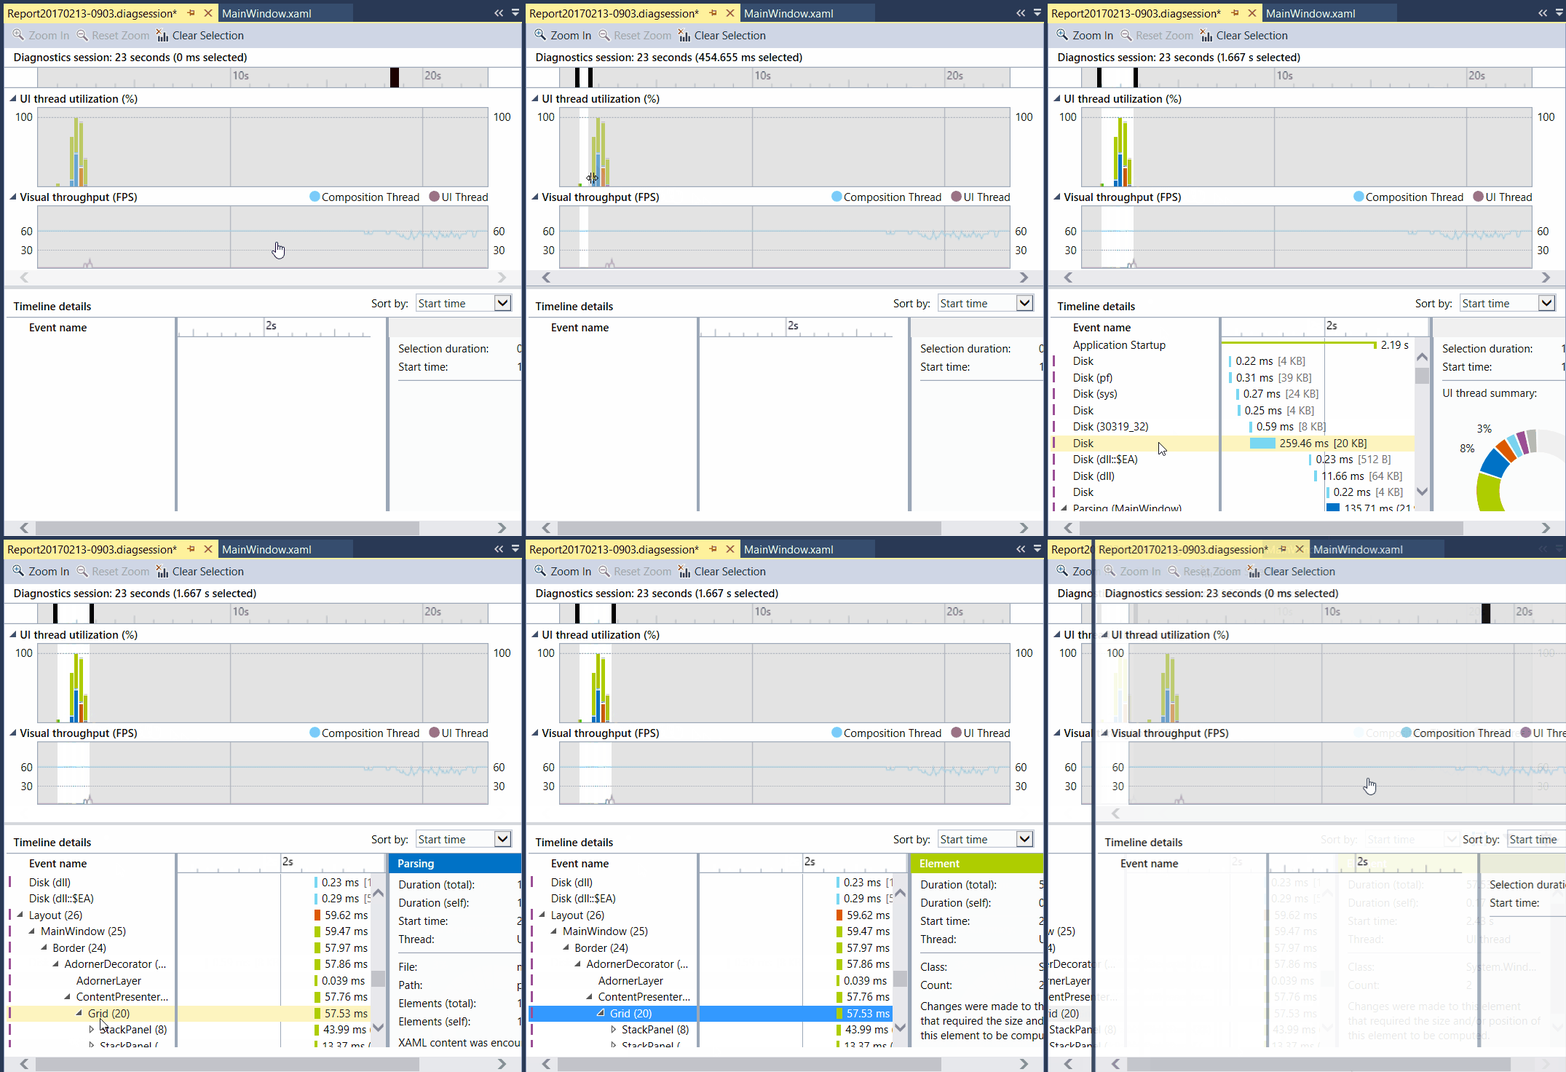
In the Timeline details view, you can find information such as the type of activity (or the UI element involved) along with the duration of the activity. For example, in the illustration, a Layout event for a Grid control takes 57.53 ms.
For more information, see Application Timeline.
Examine UI performance and accessibility events (UWP)
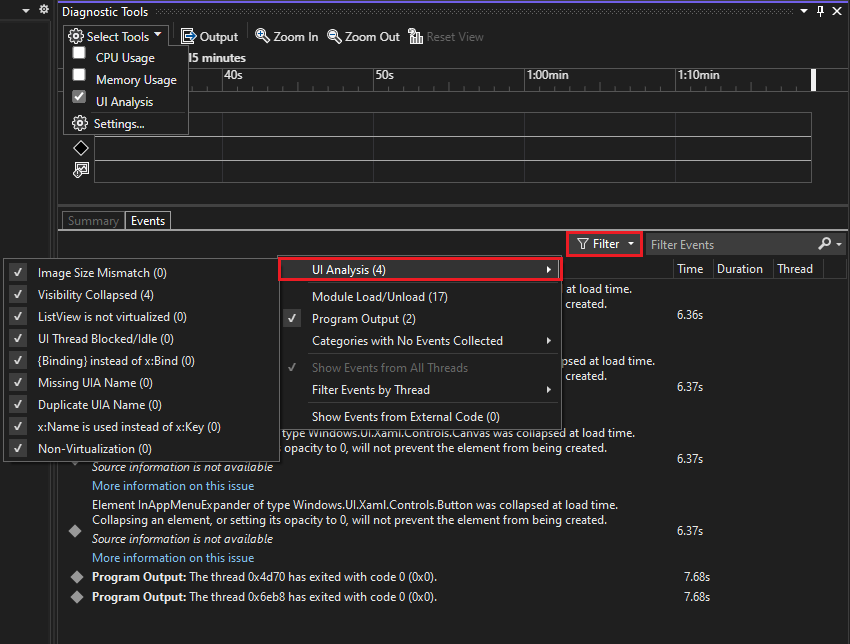
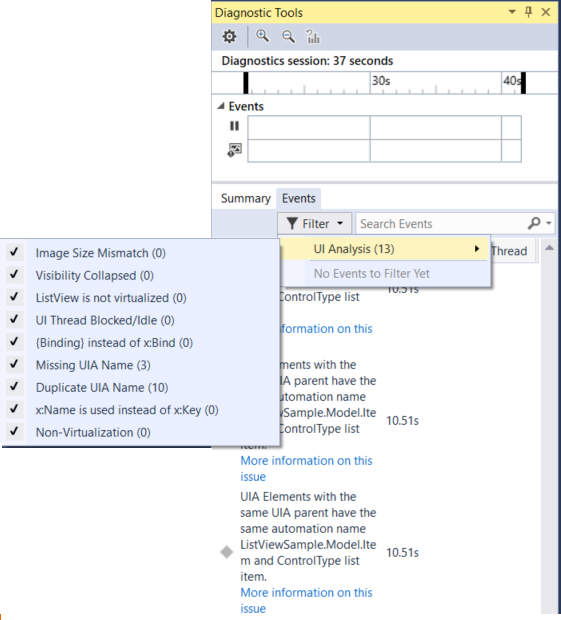
In your UWP apps, you can enable UI Analysis in the Diagnostic Tools window. The tool searches for common performance or accessibility issues and displays them in the Events view while you are debugging. The event descriptions provide information that can help resolve issues.
Analyze GPU Usage (Direct3D)
In Direct3D apps (Direct3D components must be in C++), you can examine activity on the GPU and analyze performance issues. For more information, see GPU Usage. To use the tool, choose GPU Usage in the Performance Profiler, and then choose Start. In your app, go through the scenario that you're interested in profiling, and then choose Stop collection to generate a report.
When you select a time period in the graphs and choose view details, a detailed view appears in the lower pane. In the detailed view, you can examine how much activity is happening on each CPU and GPU. Select events in the lowest pane to get popups in the timeline. For example, select the Present event to view Present call popups. (The light gray vertical VSync lines can be used as a reference to understand whether certain Present calls missed VSync. There must be one Present call between every two VSyncs in order for the app to steadily hit 60 FPS.)
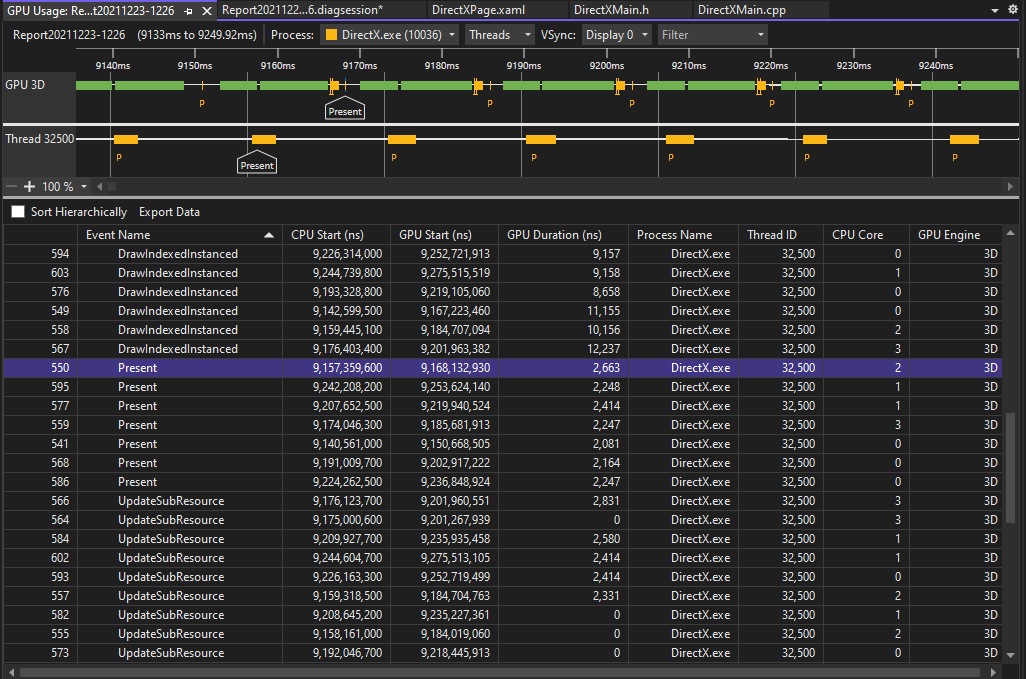
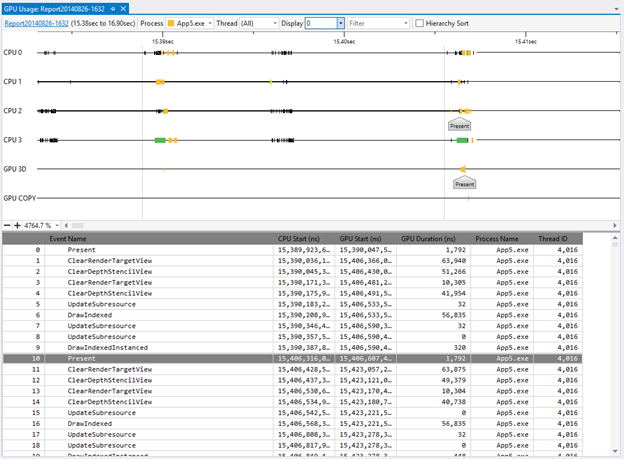
You can also use the graphs to determine whether there are CPU bound or GPU bound performance bottlenecks.
Analyze performance (legacy tools)
In Visual Studio 2019, the legacy Performance Explorer and related profiling tools such as the Performance Wizard were folded into the Performance Profiler, which you can open using Debug > Performance Profiler. In the Performance Profiler, the available diagnostics tools depend on the target chosen and the current, open startup project. The CPU Usage tool provides the sampling capability previously supported in the Performance Wizard. The Instrumentation tool provides the instrumented profiling capability (for precise call counts and durations) that was in the Performance Wizard. Additional memory tools also appear in the Performance Profiler.
