Note
Access to this page requires authorization. You can try signing in or changing directories.
Access to this page requires authorization. You can try changing directories.
The Memory Usage tool monitors your app's memory use. You can use the tool to study the real-time memory effects of scenarios you're actively developing in Visual Studio. You can take detailed snapshots of the app's memory states, and compare snapshots to find the root causes of memory issues. The Memory Usage tool is supported on .NET, ASP.NET, C++, or mixed mode (.NET and native) apps.
The Memory Usage tool can run on release or debug builds. In this article, we show how to use the Memory Usage tool in the Visual Studio Performance Profiler, which is recommended for release builds. For information on choosing the best memory analysis tool for your needs, see Choose a memory analysis tool.
For the best experience with this documentation, choose your preferred development language or runtime from the list at the top of the article.
Memory Usage diagnostic sessions
To start a Memory Usage diagnostic session:
Open a project in Visual Studio.
The Memory Usage tool supports .NET, ASP.NET, C++, or mixed mode (.NET and native) apps.
In the Debug menu, set the solution configuration to Release and select the deployment target.
The deployment target typically matches the project name, indicating a local deployment.
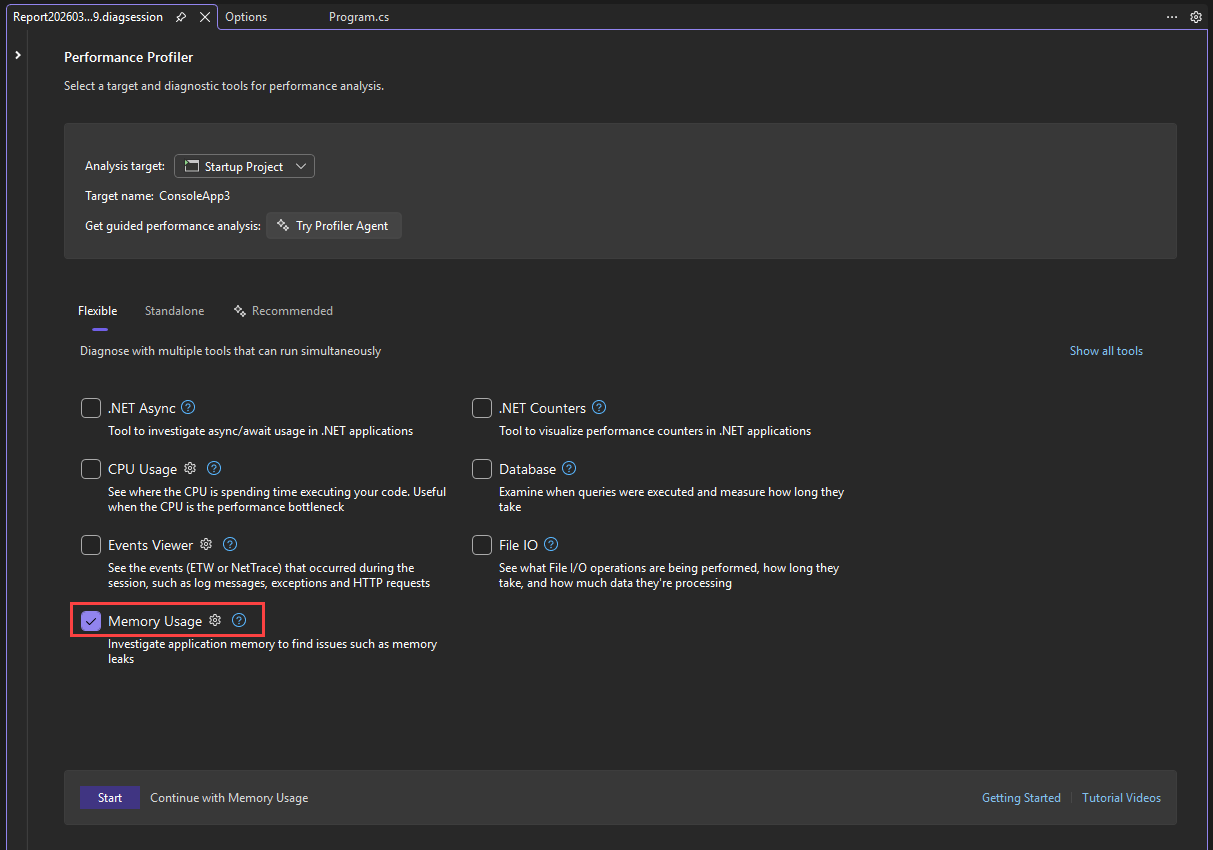
On the menu bar, select Debug > Performance Profiler.
On the Flexible tab, select Memory Usage, and then select Start.

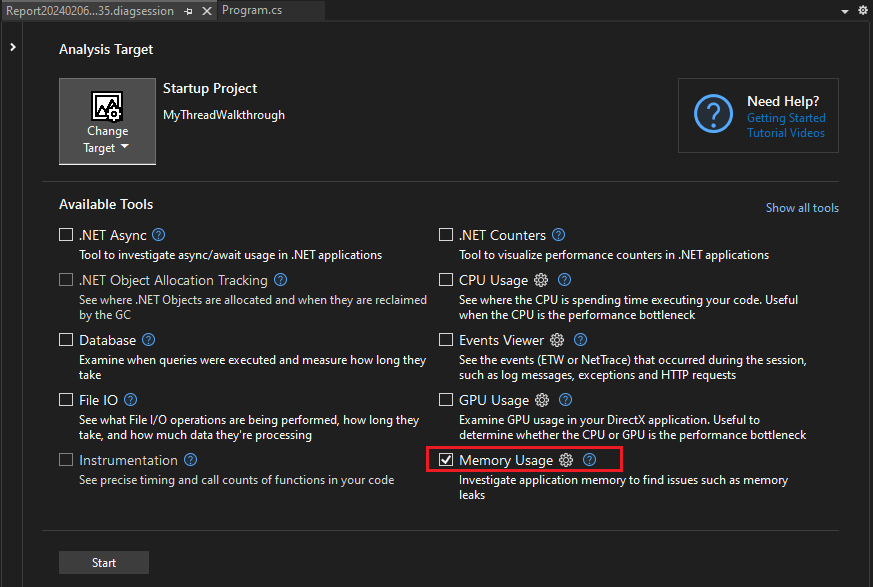
- Under Available Tools, select Memory Usage, and then select Start.

Note
For some project types, such as CMake, you must set the startup target to Executable. For more information, see Which tools are supported for my project?.
Monitor memory use
When you start a diagnostic session, your app starts, and the Diagnostic Tools window displays a timeline graph of your app's memory use.


The timeline graph shows memory fluctuations as the app runs. Spikes in the graph usually indicate that some code is collecting or creating data, and then discarding it when the processing is done. Large spikes indicate areas that you can optimize. Main concern is a rise in memory consumption that's not returned. This may indicate inefficient memory use or even a memory leak.
Take snapshots of app memory states
An app uses a large number of objects, and you might want to concentrate your analysis on one scenario. Or, you may find memory issues to investigate. You can take snapshots during a diagnostic session to capture memory usage at particular moments. It's good to get a baseline snapshot of an app before a memory issue appears. You can take another snapshot after the first occurrence of the problem, and additional snapshots if you can repeat the scenario.
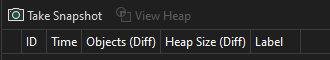
To collect snapshots, select Take snapshot when you want to capture the memory data.
Close the diagnostic session
To stop a monitoring session without creating a report, just close the diagnostic window. To generate a report when you're done collecting or have taken snapshots, select Stop Collection.


If you have trouble collecting or displaying data, see Troubleshoot profiling errors and fix issues.
Memory Usage reports
After you stop data collection, the Memory Usage tool stops the app and displays the Memory Usage overview page.


Memory Usage snapshots
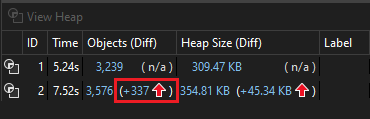
The numbers in the Snapshot panes show the objects and bytes in memory when each snapshot was taken, and the difference between the snapshot and the previous one.
The numbers are links that open detailed Memory Usage report views in new Visual Studio windows. A snapshot details report shows the types and instances in one snapshot. A snapshot difference (diff) report compares the types and instances in two snapshots.

For C++, the Objects (Diff) column is named Allocations (Diff).
| Image | Description |
|---|---|
 |
The total number of objects in memory when the snapshot was taken. Select this link to display a snapshot details report sorted by the count of instances of the types. |
 |
The difference between the total number of memory objects in this snapshot and the previous snapshot. Select this link to display a snapshot diff report sorted by the difference in the total count of instances of the types. |
 |
The total number of bytes in memory when the snapshot was taken. Select this link to display a snapshot details report sorted by the total size of the type instances. |
 |
The difference between the total size of memory objects in this snapshot and the previous snapshot. A positive number means the memory size of this snapshot is larger than the previous one, and a negative number means the size is smaller. Baseline means a snapshot is the first in a diagnostic session. No Difference means the difference is zero. Select this link to display a snapshot diff report sorted by the difference in the total size of instances of the types. |
Managed types reports
Choose the current link of an Objects (Diff) cell in the Memory Usage summary table.

Note
For .NET code, the View Details icon (![]() ) is only available while using the debugger-integrated Memory Usage tool or when you open a heap snapshot and choose Debug Managed Memory.
) is only available while using the debugger-integrated Memory Usage tool or when you open a heap snapshot and choose Debug Managed Memory.
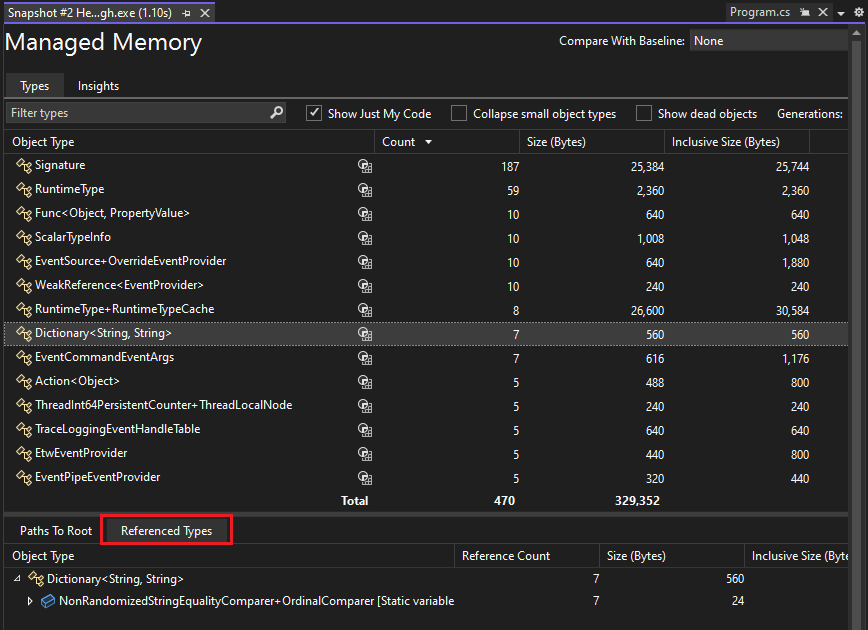
The top pane shows the count and size of the types in the snapshot, including the size of all objects that are referenced by the type (Inclusive Size).
The Paths to Root tree in the bottom pane displays the objects that reference the type selected in the upper pane. The .NET garbage collector cleans up the memory for an object only when the last type that references it has been released. For more information on using the Paths to Root tree, see Analyze hot path to root.

Note
For .NET code, the View Instances icon (![]() ) is only available while using the debugger-integrated Memory Usage tool or when you open a heap snapshot and choose Debug Managed Memory.
) is only available while using the debugger-integrated Memory Usage tool or when you open a heap snapshot and choose Debug Managed Memory.
The top pane shows the count and size of the types in the snapshot, including the size of all objects that are referenced by the type (Inclusive Size).
The Paths to Root tree in the bottom pane displays the objects that reference the type selected in the upper pane. The .NET garbage collector cleans up the memory for an object only when the last type that references it has been released. For more information on using the Paths to Root tree, see Analyze hot path to root.
The Referenced Types tree displays the references that are held by the type selected in the upper pane.

The Referenced Types tree displays the references that are held by the type selected in the upper pane.
Report tree filters
Many types in apps aren't required for app developers to investigate memory issues. The snapshot report filters can hide most of these types in the Managed Memory and Paths to Root trees.

To filter a tree by type name, enter the name in the Filter box. The filter isn't case-sensitive, and it recognizes the specified string in any part of the type name.
Select Show Just My Code in the Filter dropdown to hide most instances that are generated by external code. External types belong to the operating system or framework components, or are generated by the compiler.
Select Collapse Small Objects in the Filter dropdown to hide types whose Size (Bytes) is less than 0.5 percent of the total memory.
Native types reports
Choose the current link of an Allocations (Diff) or Heap Size (Diff) cell in the Memory Usage summary table of the Diagnostic Tools window.


The Types View displays the number and size of the types in the snapshot.
Choose the View Details icon next to a selected type to display information about the objects of the selected type in the snapshot.
The Instances view displays each instance of the selected type. Selecting an instance displays the call stack that resulted in the creation of the instance in the Allocation Call Stack pane. (This information is only available while debugging.)
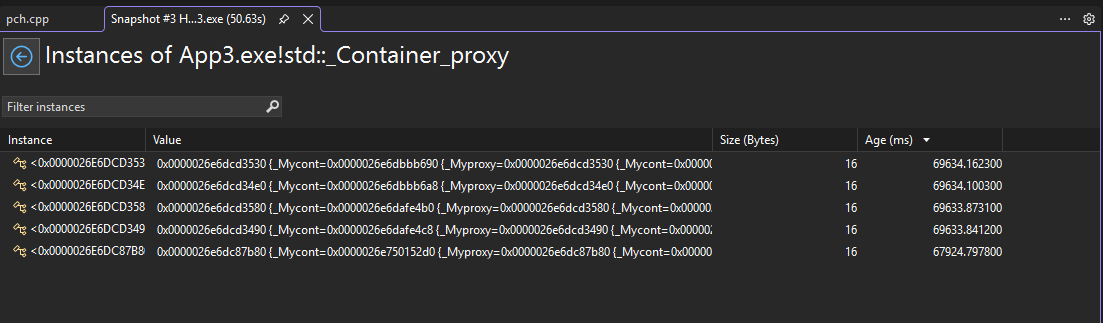

Choose the View Instances icon next to a selected type to display information about the objects of the selected type in the snapshot.
The Instances view displays each instance of the selected type. Selecting an instance displays the call stack that resulted in the creation of the instance in the Allocation Call Stack pane. (This information is only available while debugging.)


Choose Stacks to see the allocation stack for the selected type.


Choose Stacks to see the allocation stack for the selected type.


Memory Usage Insights
For managed memory, the Memory Analysis tool also gives multiple powerful built-in auto insights. Select the Insights tab in the Managed types reports and it shows the applicable auto insights like Duplicate strings, Sparse arrays, and Event handler leaks.


The Duplicate Strings section shows the list of strings that get allocated multiple times on the heap. In addition, this section shows the total wasted memory, that is, the (number of instances - 1) times the size of the string.
The Sparse Arrays section shows arrays that are mostly filled with zero elements, which can be inefficient in terms of performance and memory usage. The memory analysis tool will automatically detect these arrays and show you how much memory is being wasted due to these zero values.
The Event Handler Leaks section, available in Visual Studio 2022 version 17.9 Preview 1, shows potential memory leaks that can occur when one object subscribes to another object's event. If the publisher of the event outlives the subscriber, the subscriber remains alive, even if there are no other references to it. This can lead to memory leaks, where unused memory isn't properly freed, causing the application to use more and more memory over time.
Certain types are known to have fields that can be read to determine the size of the native memory they're holding onto. The Insights tab shows fake native memory nodes in the object graph, which are retained by their parent objects such that the UI will recognize them and display their size and reference graph.

Change (Diff) reports
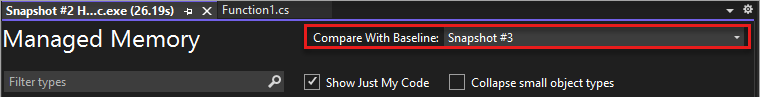
Choose the change link in a cell of the Snapshot pane in the Memory Usage overview page.
Choose a snapshot in the Compare With list of a managed or native report.
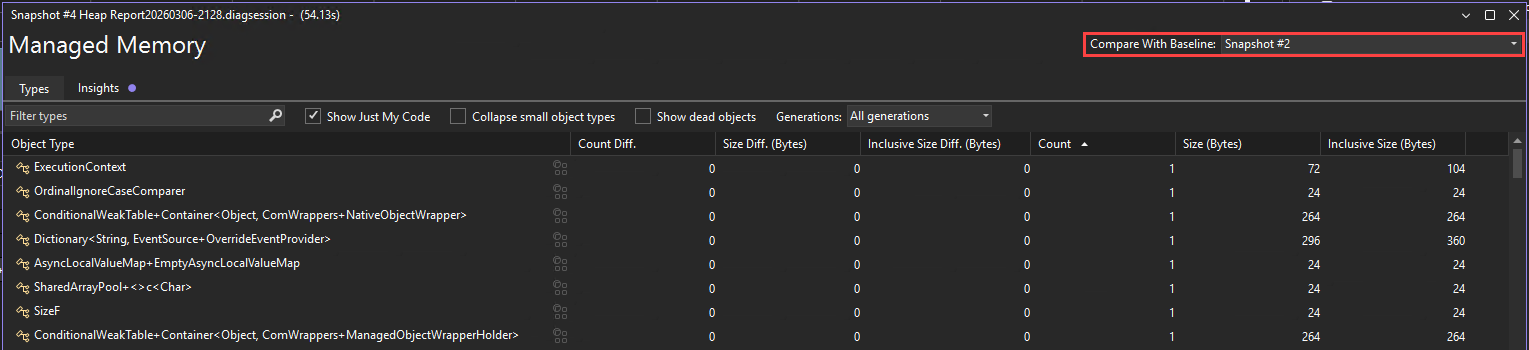

The change report adds columns (marked with (Diff)) to the base report that show the difference between the base snapshot value and the comparison snapshot. Here's how a Native Type View diff report might look:


The top pane shows the count and size of the types in the snapshot, including the size of all objects that are referenced by the type (Inclusive Size).
Related content
- Profiling in Visual Studio
- First look at profiling tools
- Profile your app with GitHub Copilot Profiler Agent
- Analyze hot path to root
- Choose a memory analysis tool
- .NET Object Allocation tool
- Troubleshoot profiling errors and fix issues
- Diagnosing memory issues with the new Memory Usage tool in Visual Studio