Note
Access to this page requires authorization. You can try signing in or changing directories.
Access to this page requires authorization. You can try changing directories.
The Microsoft Viva Glint Executive summary report is a group of reports useful to admins for presenting high level results to your team, leaders, or the company.
Note
Users in roles who don't have access to all questions only see questions and comment counts for questions that they have access to.
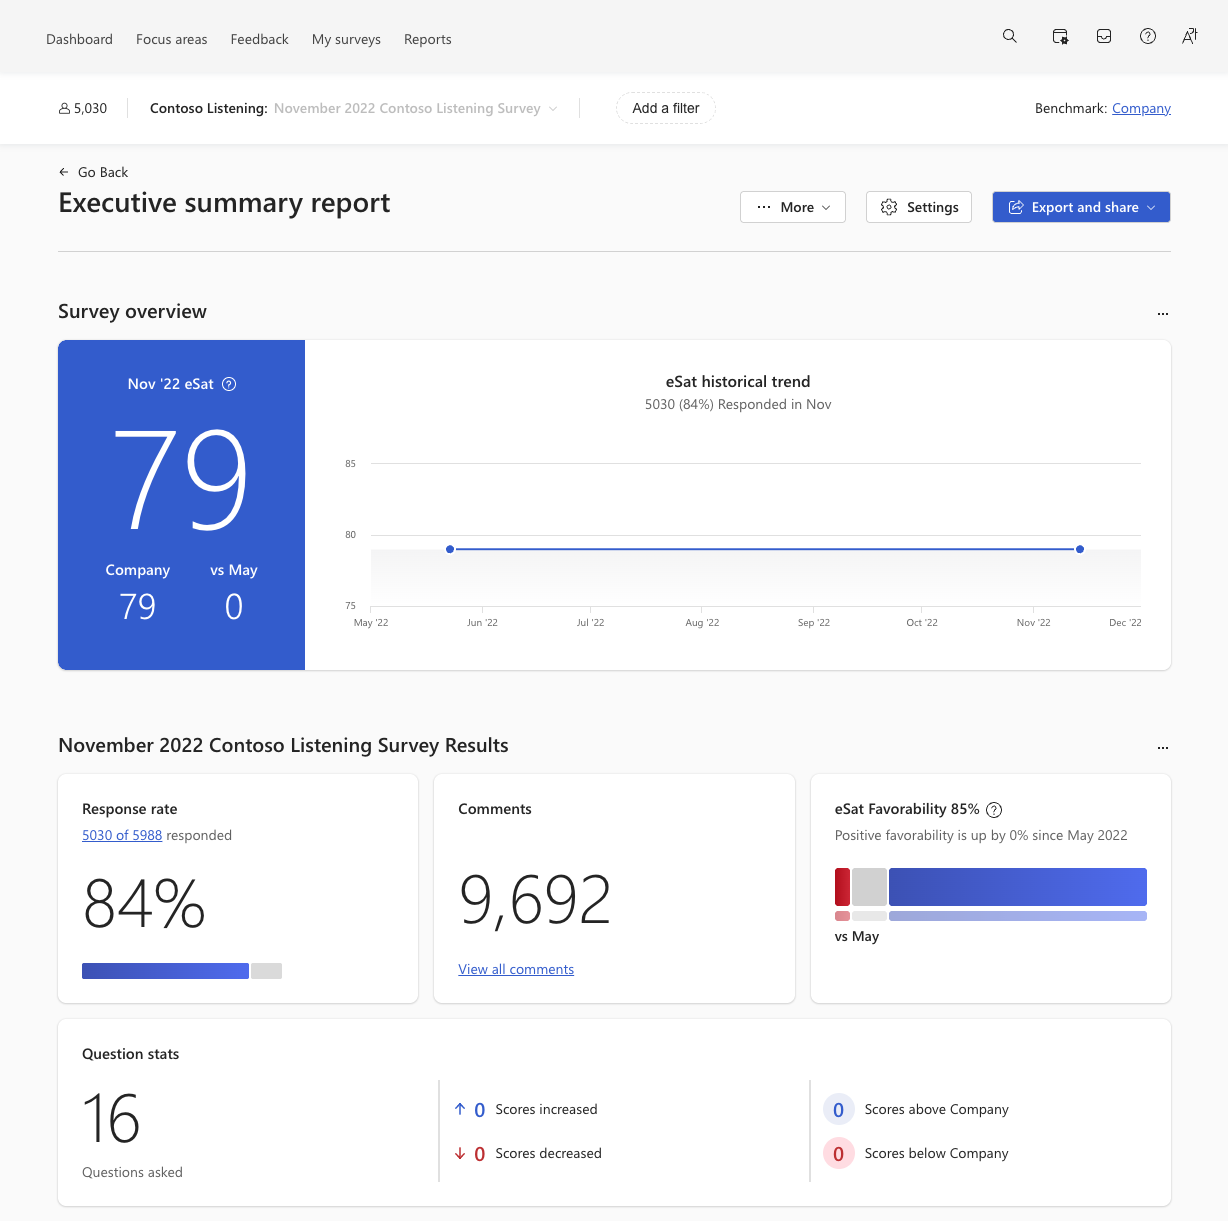
Executive summary report content
By default, the Executive summary report includes the sections described in this table:
| Report or section | Description |
|---|---|
| Survey overview | Overview of the most recent score for the survey's key outcome compared to the default benchmarks and the last survey cycle (if available) |
| Historical trend | A trend graph of the survey's key outcome score over time, when there are multiple survey cycle scores available |
| Survey Results | Overview of the most recent results from a survey, including: response rate, comment count, key outcome favorability breakdown, question count, scores increased or decreased since the last survey cycle, and number of questions above or below the selected benchmark |
| Strengths and Opportunities | Top strengths and opportunities relative to the benchmark and impact on the key outcome |
| Scores | A list of all survey questions and their scores, including columns for: score, question text, a benchmark comparison, change since last survey cycle (if available), impact, percent favorable breakdown, and comment count |
| Primary and Secondary hierarchy sections | Key outcome scores broken down by the highest level of your organization's first and secondary hierarchies selected in General settings, including columns for: attribute (like manager team), key outcome score, benchmark comparison, change since last survey cycle (if available), percent favorable breakdown, response rate and count |
To learn about other feedback reports available, see Report types.
Note
When questions in an aggregate index used as the key outcome include question targeting to exclude some users, the key outcome response rate in the Survey overview differs from the overall Response rate in the Survey Results section.
Choose your benchmark comparison
The Settings button opens a panel to choose comparison data for interpreting survey results within the context of how others are doing. One or more internal comparisons may appear here, based on how benchmarks have been configured in the Reporting section of your General Settings feature. The four Glint benchmark comparison options are:
- Benchmark: Provides a comparison point for feedback based on survey data compiled from all Glint customers, not just within your organization. Helpful for admins and first-time survey results analysis.
- Company: Displays team scores in comparison to company-wide scores for the same questions. Helpful for users with more than one area of responsibility.
- My Teams: Compares a team's score to an overall score derived from a user’s data access. Helpful for users with more than one area of responsibility.
- Average Question: Presents a single, overall score for all questions and respondents within your access. Helpful for users looking for some level of variance in their score.
Learn more about comparison data.
Note
Your company may have substituted custom terms for the Viva Glint terminology used in our guidance.
Strengths & Opportunities on the Executive Summary report
The view on the Executive Summary report provides a ranked list of both strengths (areas to celebrate) and opportunities (areas to focus on) for improvement.
Tip
For administrators, the first look at S&O should be versus Benchmark to understand which areas can help improve your organization's competitive advantage to attract and retain talent. Only items with a benchmark are part of this view.
If there are multiple items without a benchmark, change to view S&Os versus Average Question. This view shows the comparison to the average score of all selected survey items. This comparison indicates a team's strengths and opportunities compared to the company mean.
Example:
If there are 10 rating questions in a survey and the average of all the question scores is 75, then the difference between a question with score 70 versus the question average is calculated as 70 - 75 = -5.
Filter a report
Most reports are filterable by attribute and hierarchy. Use the filter symbol.
Add or delete a report
To add a report, select the More dropdown button at the bottom of the page and then + Add Section.
If you already have reports displayed but want to add others, the More button isn't available - select +Add Section at the bottom of the page.
If you choose not to share one of the reports that already appears, choose Delete on the vertical ellipses next to the report.
Export a report
Use the dropdown arrow in the Export button to choose your method of export.