Note
Access to this page requires authorization. You can try signing in or changing directories.
Access to this page requires authorization. You can try changing directories.
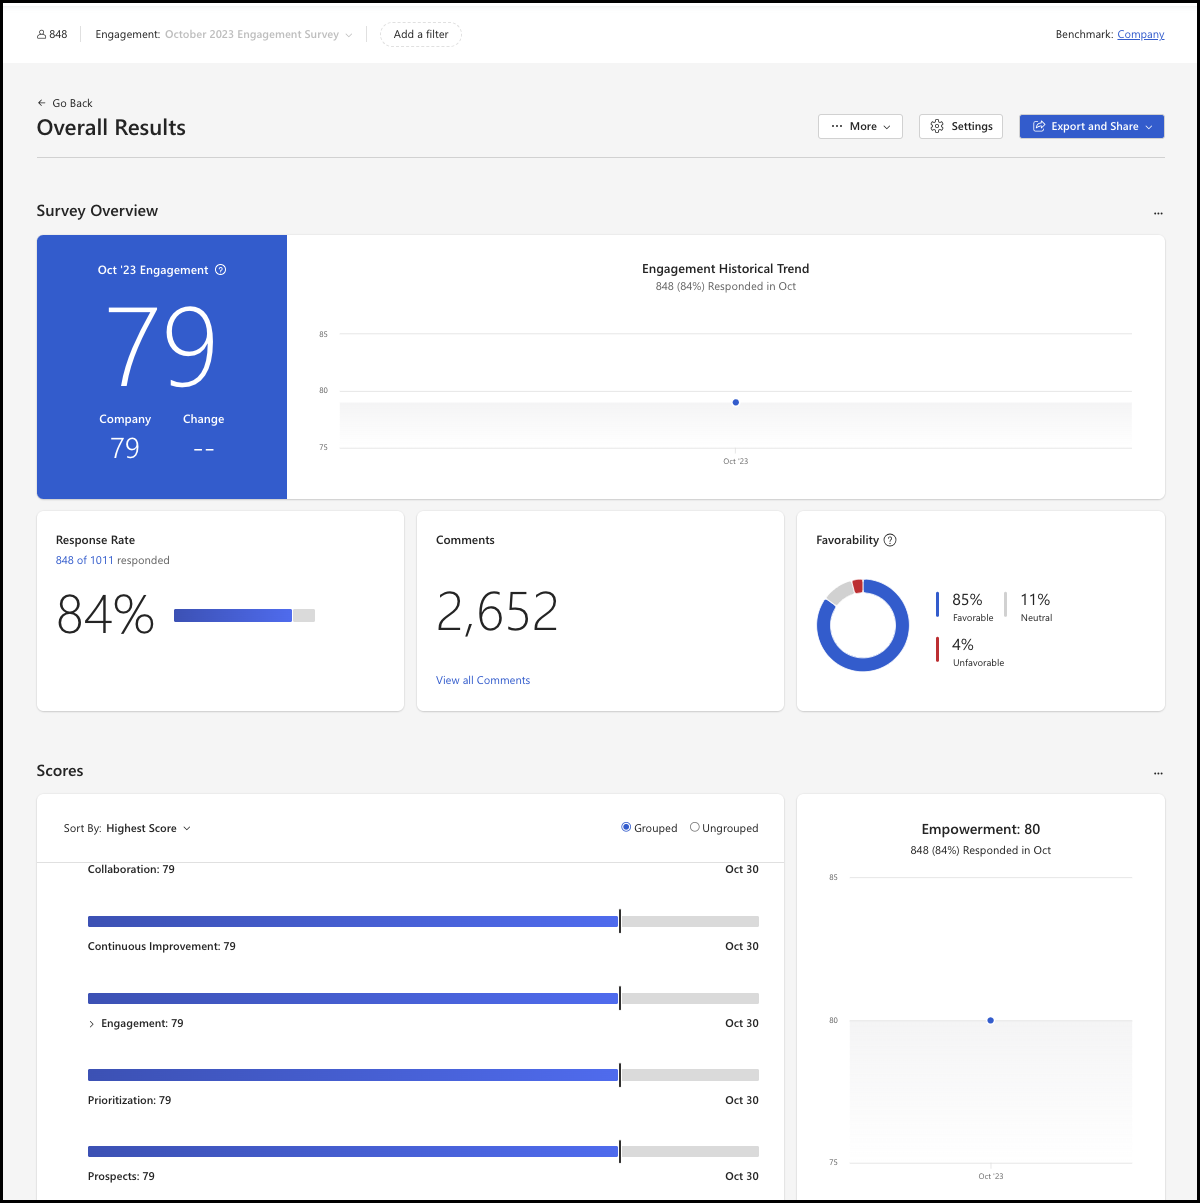
The Overall results report shows a high-level overview of results for your Microsoft Viva Glint survey. Drilling down, you can focus on a specific question. You can also go back to the previous survey data or filter by demographic data, hierarchy data, or other attributes to gain insights about a specific group.
Note
Users in roles who don't have access to all questions only see questions and comment counts for questions that they have access to.
Note
When questions in an aggregate index used as the key outcome include question targeting to exclude some users, the key outcome response rate in the Survey overview section differs from the overall survey Response rate.
Change report settings
Filters depend on the employee data your company sends to Viva Glint, and confidentiality requirements must be met to display data.
Use the More dropdown menu
Selecting the More dropdown menu gives you the option to add sections to your report and search comments. Each option opens a new window. Follow the on-screen guidance.
Use the Settings button to select your internal benchmark
Viva Glint provides four default options for comparison reporting. In addition to the following four settings, your company may have one or more internal comparisons configured (for example, Division or Business Unit).
| Comparator | Description | When to use |
|---|---|---|
| Benchmark | Provides a comparison point for feedback based on survey data compiled from all Viva Glint customers, not just within your organization. | Helpful for admins and first-time survey results analysis |
| Company | Displays team scores in comparison to company-wide scores for the same questions. | Helpful for users with more than one area of responsibility |
| My Teams | Compares a manager's team score to an overall score derived from a filter. | This setting is the superset of access and is best used with custom access or managers with large organizations |
| Average Question | Presents a single, overall score for all questions and respondents within your access. | Helpful for users looking for some level of variance in their score |
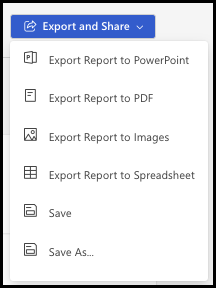
Export and Share
Share your results with leaders and stakeholders in the way that works best for you. Select the Export and Share button for access: