Note
Access to this page requires authorization. You can try signing in or changing directories.
Access to this page requires authorization. You can try changing directories.
The Workplace Patterns Report in Viva Glint powered by Viva Insights identifies how employee workplace habits from Viva Insights relate to their engagement and sentiment from Viva Glint surveys. This report helps you connect how people work with how they feel. It makes it easier for HR teams and leaders to find useful insights without digging through multiple data sources.
Setting up the Workplace Patterns Report
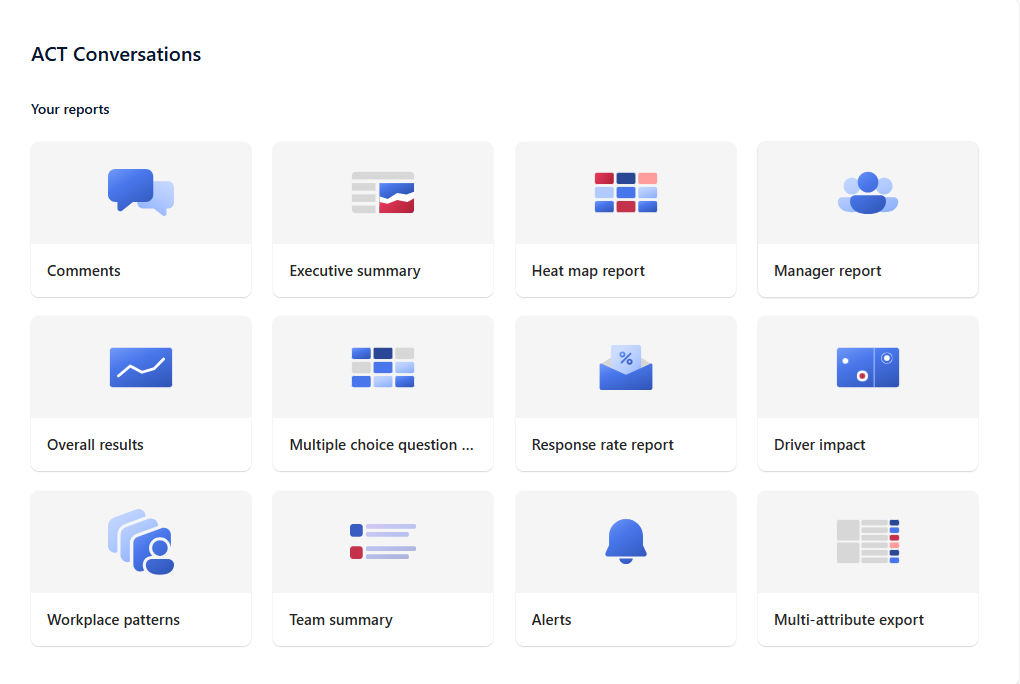
To access the Workplace Patterns Report, navigate to the Reports tab in your Viva Glint admin dashboard (just as you would for other Glint reports). If your organization has the Viva Insights integration enabled, you see a card for Workplace Patterns Report. Click that report card to open it.
Prerequisites: This report is available only after integrating Viva Glint with Viva Insights. If the integration isn't set up, the Workplace Patterns Report card may not appear at all.
Confidentiality and Data Requirements: Like all Viva Glint reports, the Workplace Patterns Report respects confidentiality thresholds. At least five respondents are required for any aggregated metric to be shown (to preserve anonymity), similar to other Glint reports. Moreover, because this report deals with comparative analytics, it needs a sufficient data volume to identify patterns. As a rule of thumb, you need at least 100 survey responses that also have Viva Insights data across all workplace metric buckets for the analysis to run reliably. If the dataset is too small or too skewed, the report indicates that there isn’t enough data to display results. If fewer than two workplace metric ranges have the minimum number of people (20 each) for a given metric, some insights like the "highest scoring range" might not be shown for that metric.
Role-Based Access: The Workplace Patterns Report is targeted at HR analysts and admins at the company level. Company-level Glint admins have access to this report by default. Managers and users from other roles don't automatically see this report unless permissions are extended. As an admin, you can choose to enable this report for other roles. For best results, keep it limited to roles that manage large populations.
Using the Workplace Patterns Report
The Workplace Patterns Report consists of two main sections that together provide insights for how work patterns and engagement are related:
Top Workplace Metrics for Survey Questions
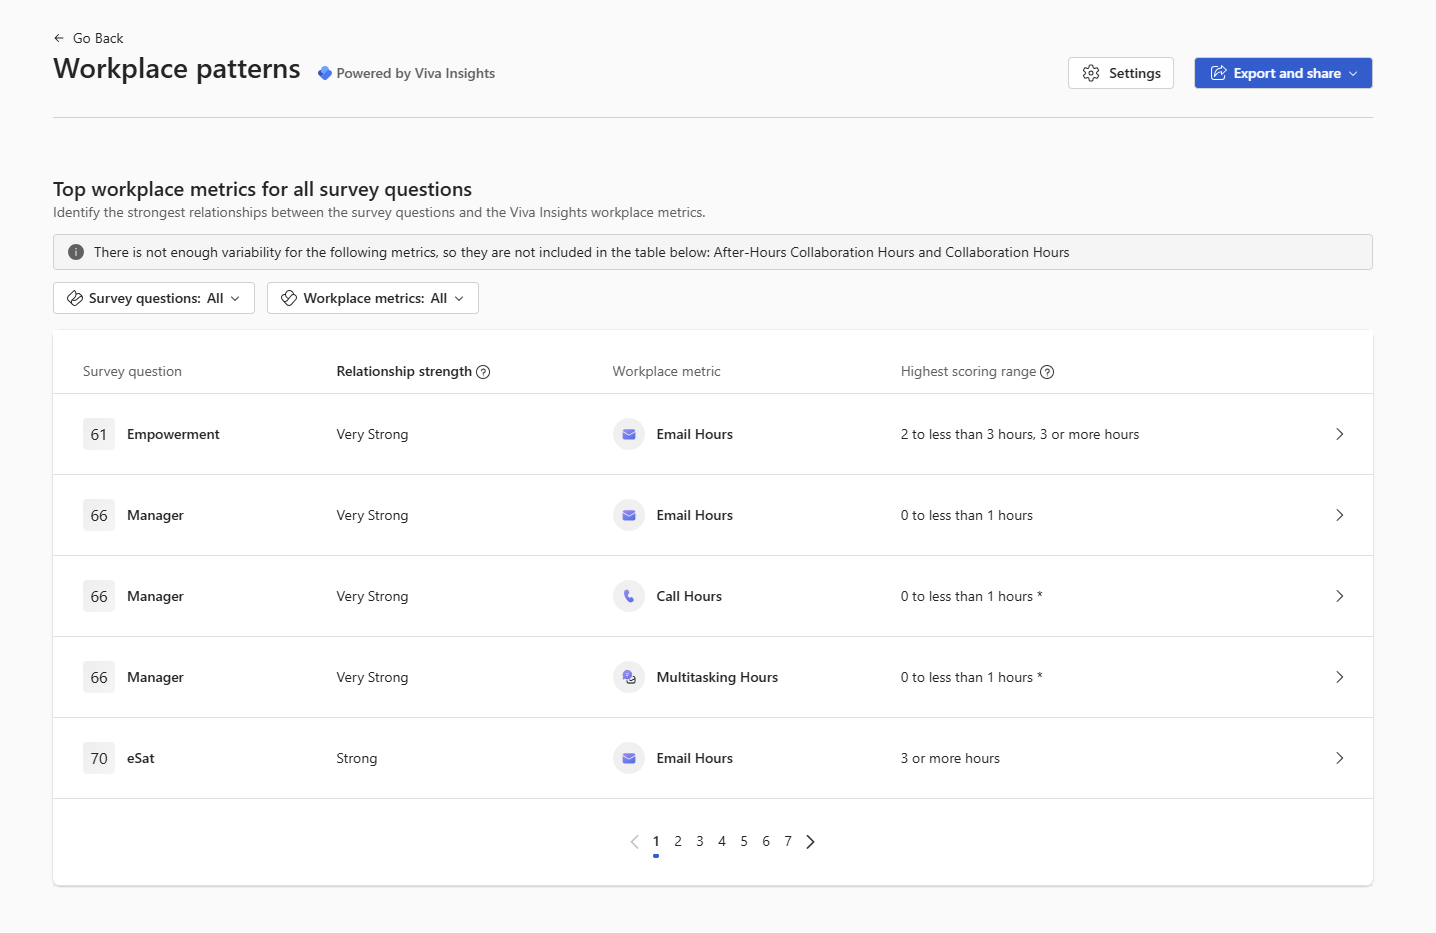
This section lists the strongest relationships between specific survey items (engagement questions) and Viva Insights metrics (workplace patterns data). For each combination, where enough data is available you see a Relationship Strength indicating how strongly the workplace pattern is associated with the survey score. You also see the highest scoring range, which shows the group of employees within the Viva Insights metric range that has the most favorable survey scores. For example, if work-life balance (survey item) has a strong relationship with after-hours Work (Insights metric), the report might show that the group with low after-hours work had the highest work-life balance scores pointing to a potentially optimal work pattern for better engagement. Each row typically represents a pairing, for example:
Survey Question: "I have a good work-life balance." (from the Glint survey)
Work Pattern Metric: After-hours collaboration hours (from Viva Insights)
Relationship Strength: Very strong - indicating the amount of after-hours work hours relates strongly to how people rate their work-life balance.
Highest Scoring Range: The after-hours collaboration hours range with the best survey scores for work-life balance is "0 to 5 hours per week".
The "relationship strength" is how strongly a workplace pattern is associated with a survey score. It calculates how the average sentiment score (% favorability) changes across each categorical range of workplace pattern data. There are four relationship values:
Very Strong: These relationships are the most important ones to examine closely suggesting that the workplace pattern is highly related with the differences in scores. In practical terms, people at one extreme of the workplace pattern are also those employees with the strongest sentiments compared to employees at the opposite extreme.
Strong: Clear relationship, though not as extreme, meaning there's a noticeable impact of the workplace pattern on the sentiment. These relationships also deserve close attention.
Medium: There's some association, but it might not be pronounced. Medium relationships can still be insightful, especially if they align with known issues or hypotheses, but they may require more context to act on. Often large groups with medium relationship strengths can suggest fruitful grounds for a deep dive to find the smaller subgroup with a Strong+ relationship
Weak: Little to no obvious relationship suggesting that the workplace pattern and the survey item don’t have a strong relationship in the data. It doesn’t necessarily mean no effect (there could be complexities), but nothing stands out statistically. These relationships could still be useful to validate "no relationship" hypotheses.
Tip
Click on any specific relationship (row) for more details. The report is interactive – selecting a row drills into a more detailed pop-up view about that particular survey question or metric to get a breakdown of scores across all four workplace metric ranges. This view helps you verify the pattern: For example, confirm that as the metric increases or decreases, the sentiment score changes accordingly.
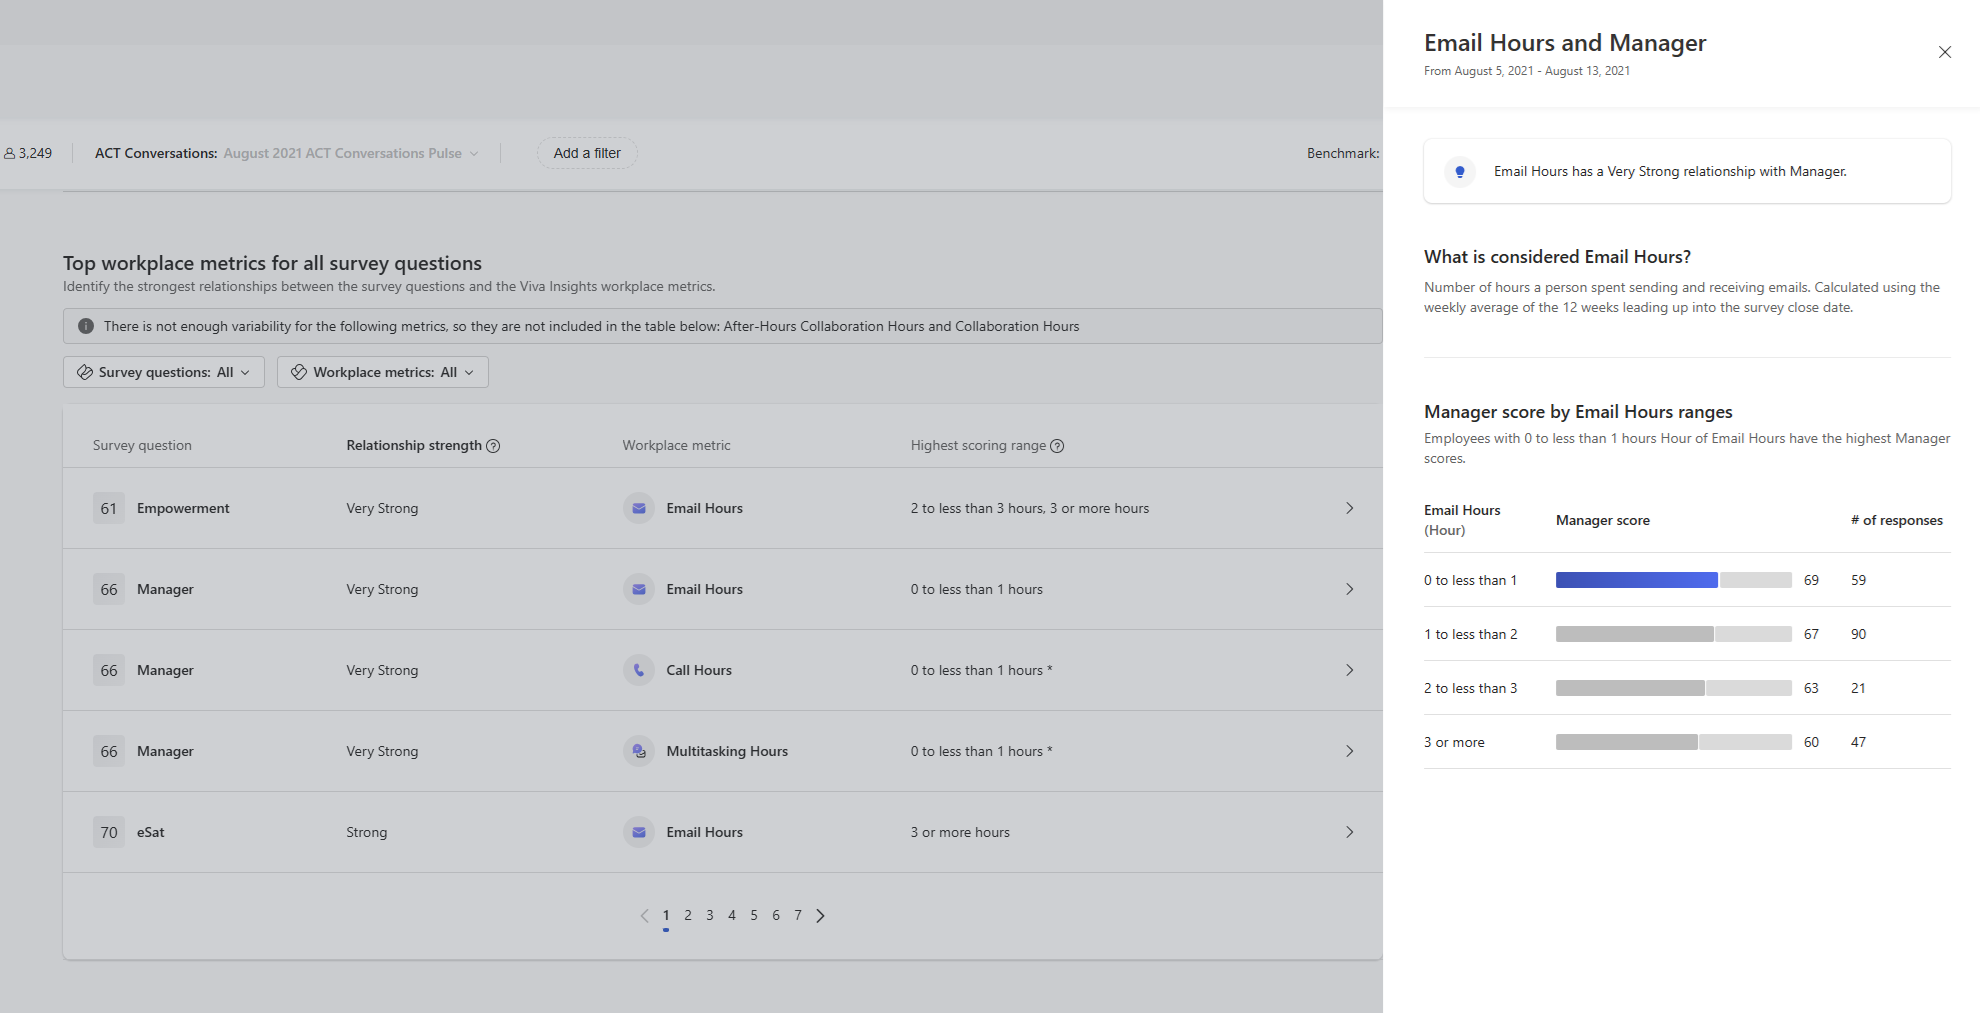
For each relationship, the Highest Scoring Range is a critical insight representing that the group of employees in this range achieved the best (most favorable) average score on the survey item in question. Essentially, it points to what level of the workplace pattern is associated with the best outcome in the survey.
Continuing the previous example: If employees with 0–5 after-hours collaboration per week are in the highest scoring range for work-life balance, that suggests keeping after-hours work within this range may be optimal for work-life balance. In contrast, employees in the highest after-hours range—such as 15 or more hours per week—likely score lower on that item.
The report determines the highest range only when it’s meaningful to do so. At least two of the four workplace metric ranges must have enough respondents. Each range should include 20 or more people to make the comparison valid. If only one range has enough data, the report doesn't show a highest scoring range. The same applies when the data is skewed—for example, when most people fall into one range. In these cases, the comparison isn't reliable. In those cases, you might see a note or simply no value in that column for that pair, indicating the data isn’t diverse enough to identify a highest scoring range. Always consider the practical significance: just because one range is highest doesn’t mean the other ranges are a problem, but a notable gap tells you something valuable.
Heatmap
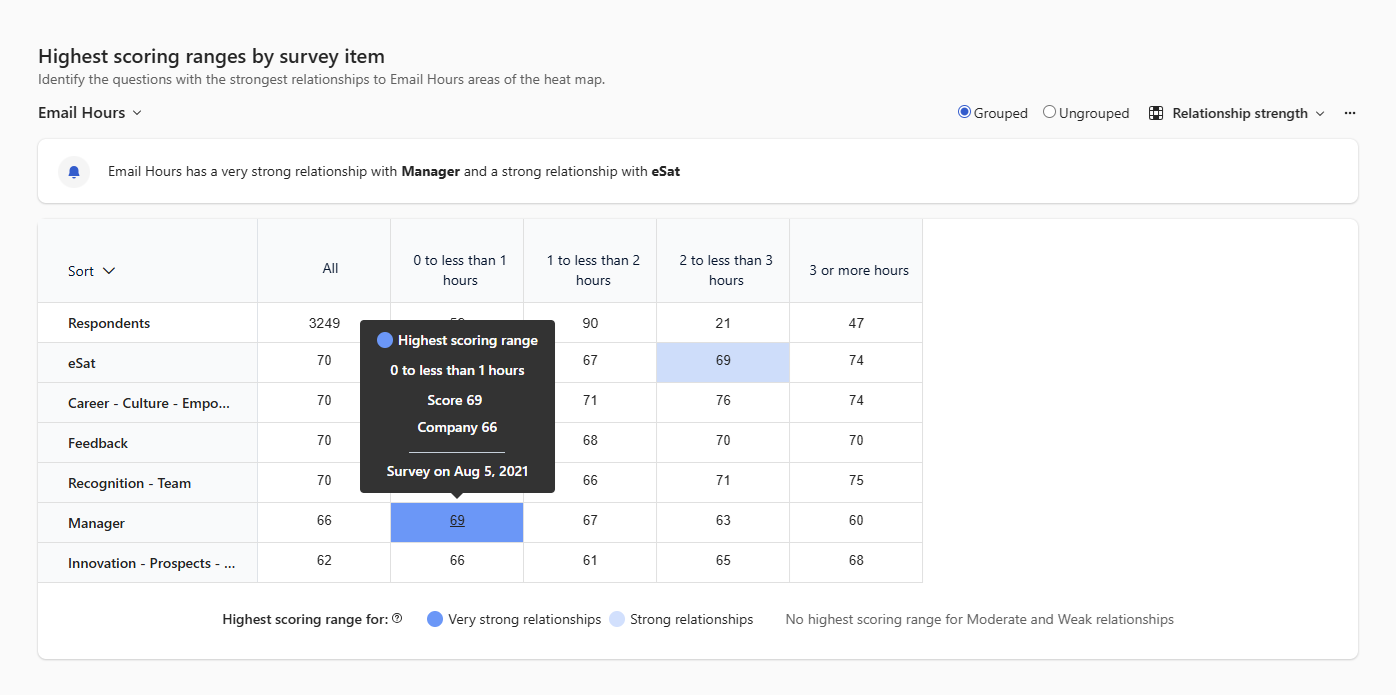
This section provides a deeper dive into the data for these relationships. Here, the heatmap table visualization displays scores and breakdowns for each highlighted relationship across all survey questions showing how survey scores vary across the workplace metric ranges of a given Viva Insights metric. The report uses color-coding or emphasis to highlight these highest scoring ranges for strong relationships. Very strong and strong relationships are highlighted and color-coded on the highest scoring range. Medium or weak relationships aren't highlighted, but the data remains available for further investigation and interpretation.
Filtering and Customizing the Report
The Workplace Patterns Report comes with filters and settings to help you focus on what matters most to you:
Filter by Survey Items or Categories: If you want to focus on specific themes or questions, you can filter the report. For example, you might choose all items related to "Collaboration" or a question such as "I have opportunities to learn and grow." The filter shows only relationships that include those survey items. This feature is useful if, for example, you're investigating a drop in a specific engagement driver. It lets you focus on how work patterns relate to that driver’s questions.
Filter by Viva Insights Workplace Pattern Metrics: Similarly, you can select one or more Viva Insights metrics to focus on. For instance, you might want to just examine anything related to meeting load and see which survey outcomes have relationships with meeting hours. Setting that filter shows only the relationships involving meeting-related metrics. You can also combine filters – for example, look at how meeting load metrics relate to only Work-Life Balance and Burnout survey items.
Benchmark Settings: In the Settings menu, you may find options to change the benchmark or comparison settings, similar to other reports. For example, you might toggle between viewing absolute scores versus showing scores relative to company average. If you change the comparison (say, viewing "vs Company" or an external benchmark), it could influence how favorability is interpreted in relation to that benchmark. Use these settings if needed to provide context but note that relationship strength calculations are internal to your data – they aren't comparing to external benchmarks, but within your population split into groups. So, changing the benchmark mainly would affect how the underlying scores are shown, not the relationship ranking itself.
License Utilization Banner: At the top of the report, admins see a banner indicating the Viva Insights data coverage in the survey. It might read something like: "X (Y%) out of Z survey responses have Viva Insights data". This banner helps you quickly gauge how comprehensive the integration is for that survey. For example, if the report shows 500 of 625 responses (80%) mapped to Insights, most people’s data is included. If the percentage is low, treat the results with caution. Many respondents may not have Insights metrics because they aren't licensed knowledge workers. The banner also includes a "Learn More" link where you can get information about Viva Insights integration (like what it means, data freshness, etc.). If the percentage is low, an admin can click Learn More to see the reason. Some users may not be matched to Entra ID. In other cases, not all surveys are selected for sharing.
Interpreting Results and Taking Action
The power of the Workplace Patterns Report lies in translating these insights into action. Here are some best practices and examples of how to use the findings:
Validate Hypotheses or Discover New Ones: Many HR teams have hunches about work culture (for example, "Excessive meetings might be hurting focus and engagement"). The Workplace Patterns Report helps validate these insights by showing if those patterns truly exist in the data. It can also surface surprising insights. You may discover a relationship you don't expect, such as a strong link between "Documentation time" or the use of certain tools and engagement in Career Growth items. This prompts further inquiry.
Understand the Context:
Use the Highest scoring range info to discern directionality. Suppose "Cross-team Collaboration Hours" has a strong relationship with Innovation (a survey measure). If the highest scoring range is the one with medium collaboration hours (not the absolute highest), it might imply that moderation is key – too little collaboration and too much collaboration could both be suboptimal, with a middle ground being ideal. This nuance is important; it’s not always "more is better." The report can illuminate these subtleties.
The wording of the survey item when interpreting relationships. If an item is negatively phrased (for example, "I feel burned out by my workload"), a "Very Strong" relationship with high after-hours work might manifest as that group strongly agreeing with the negative statement. In such cases, the highest scoring range might actually be the one with lower scores (because lower agreement with a negative statement is a positive outcome). The report’s context usually makes this point clear because it shows which group has the more favorable outcome. Always interpret relationship strength in context of the question content and what a "favorable" score means.
Drill Down for Details: If something catches your eye, dive deeper. For instance, if a particular department or demographic is known for a unique work pattern, you could apply filters to see if the relationships hold within that subgroup or run a team comparison or heatmap for that segment. Combine this insight with other reports, such as filtering by location or using Glint reports, to get a fuller picture.
Combine with Qualitative Feedback: After identifying a strong relationship, check the open-ended comments from the survey if available. You might filter comments for keywords related to the workplace pattern. For example, if an insight shows a strong link between Manager 1:1 time and Engagement, look at comments about "manager support" or "communication." Often, the quantitative pattern paired with qualitative quotes gives a compelling narrative to share with leadership.
Share with Stakeholders: Use the Export and Share functions to communicate these findings. For instance, HR admins and Analysts can export a slide or chart of the top three work pattern insights and include it in a briefing to senior leaders.
Drive Experiments and Initiatives: Treat the insights as starting points for action. If something like "Focus time -> Productivity" emerges as a strong positive pattern, potential action might be to pilot an initiative to block more focus time on calendars and then monitor if engagement or productivity metrics improve further. Conversely, if "After-hours work -> Burnout" is highlighted, A potential action might be to implement no-email hours or educate teams on using delay send in Outlook, then track engagement or burnout scores in the next survey.
Important
The Workplace Patterns Report highlights correlations, not causation. Use your judgment and consider additional factors before making decisions. The presence of these patterns indicates they merit attention—they can confirm existing concerns or reveal hidden issues. Acting on these insights and remeasuring in future surveys helps close the loop and determine whether improving a workplace pattern leads to better employee sentiment. This is the ultimate goal of combining Viva Insights with Viva Glint.