Onboarding and development report
The Onboarding and development report helps leaders understand the onboarding experience of new hires and/or employees who've started out in a new role within the company. The report also identifies opportunities to improve the onboarding experience and structure development.
Because research shows it typically takes new employees 12 months to reach their full performance potential, this report focuses on the entire period a new hire is learning, connecting, and developing in their new role. Additionally, you can customize the definition of new hire to best fit your organization: whether it includes employees who recently joined the company or also employees who recently started out in a new role. You can also customize the number of months the new hire should be in the new role.
This report has three sections, which each address different facets of the onboarding experience for new hires and those new in the role. These sections help you answer the following business questions:
- Coach with manager 1:1s
- Are new hires getting the 1:1 coaching and support from their managers that they need?
- Boost time spent learning
- Is the organization sufficiently encouraging new hires and employees to set aside time for learning?
- Foster new hire networks
- How are new hires developing their network and how fast are they integrating into the organization’s network?
Key metrics provide a deep-dive into each topic, along with a Why it matters interpretation and recommended actions.
To populate the report in Power BI, you’ll need to set up and successfully run the predefined Onboarding and development query in Viva Insights.
Demonstration
The following demonstration uses sample data that’s only representative of this report and might not be exactly what you see in a live report specific to your organization's unique data.
Prerequisites
Before you can run the queries and populate the report in Power BI, you’ll need to:
Be assigned the role of Insights Analyst in Viva Insights.
Have the December 2022 (or newer) version of Power BI Desktop installed. If you have an earlier version of Power BI installed, uninstall it before installing the new version. Then go to Get Power BI Desktop to download and install the latest version.
- Have the HireDate attribute, which indicates when a person was hired, uploaded as part of your organizational data.
Note
If you want your report to include new hires and existing employees who've transferred to a new role, you'll also need to include the RoleStartDate attribute, which indicates when a person started in a new role or function. Without RoleStartDate, however, the rest of the report will still load.
You can add new attributes to your organizational data at any time. For more details on how to add new data for existing employees, refer to subsequent uploads.
Report setup
Run query
- In the Viva Insights analyst experience, select Analysis.
- Under Power BI templates, navigate to Onboarding and development and select Start analysis.
Under Query setup:
- Type a Query name.
- Select a Time period. Time period defaults to Last 3 months.
- Set Auto-refresh (optional). You can set the query to automatically update by checking the Auto-refresh box. When you select the Auto-refresh option, your query automatically runs and computes a new result every time Viva Insights gets updated collaboration data for licensed people.
Note
If organizational data used in an auto-refreshing query changes (for example, an attribute name is altered or an attribute is removed), the query might stop auto-refreshing.
- Type a Description (optional).
- Change the metric rule (optional). To set a new metric rule, select More settings. Then, pick a new rule from the list. For more information about metric rules, refer to Metric rules.
Note
The More settings pane also contains Group by settings. Power BI queries are set to Group by Week, and you're not able to edit this field.
Under Predefined template metrics, view the list of preselected metrics, which appear as gray tags. These metrics are required to set up the Power BI report and you can’t remove them. You can add other metrics by selecting Add metrics.
Important
Low-quality or missing organizational data might affect your metrics and result in warnings or errors. Learn more about data-quality notifications in Data quality in the analyst experience.
In Select which employees you want to include in the query, add filters to narrow down the employees in scope for your report. Don’t remove the predefined “Is Active” filter. For more details about filter and metric options, refer to Filters. If you notice a warning or error here, it's because one of your attributes is missing from your organizational data or is of low quality.
Under Select which employee attributes you want to include in the query, add up to 20 organizational attributes. Once the query runs, you can use these attributes to group and filter the reports.
Important
This PowerBI query needs some specific attributes to run, and we've preselected them for you. These attributes appear in gray and you can't remove them. We might also include some attributes that help your template, but aren't required for your query to run. These attributes appear in blue and you can remove them.
If you notice attributes marked with yellow warnings, that attribute's quality is low. If you notice attributes marked in red and the query's Run button disabled, then your organizational data is missing that attribute.
Learn more about attributes and data quality in Data quality in the analyst experience.
Select Run on the upper right side of the screen. The query might take a few minutes to run.
When your query results are ready, go to the Query results page and select the Power BI icon. Download the Power BI template and get the partition and query identifiers. You’ll need these identifiers later.
Link report to query
- Open the downloaded template.
- If you're prompted to select a program, select Power BI.
- When you're prompted by Power BI:
- Paste in the partition and query identifiers.
- Set the Minimum group size for data aggregation within this report's visualizations in accordance with your company's policy for viewing Viva Insights data.
- Select Load to import the query results into Power BI.
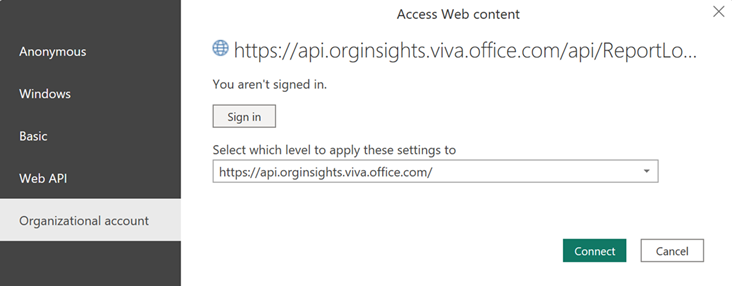
- If prompted by Power BI, sign in using your organizational account. Power BI then loads and prepares the data. For large files, this process might take a few minutes.
Important
You need to sign in to Power BI with the same account you use to access Viva Insights. If available, select Organizational account from the left. You might have to sign in more than once.
Report settings
After the Onboarding and development report is set up and populated with Viva Insights data in Power BI, map values as prompted, which are listed below:
| Value | Description |
|---|---|
| New hire categories | Select the categories you want to consider as “new hires” in the report. Include “Employees who are new to the company,” “Employees who are new in role,” or both. |
| Max. number of months in role to consider | Select the maximum number of months the new hire needs to be with the company or in the new role to be considered a “new hire.” |
After this initial prompt, you can view and set the following parameters on the Settings page:
| Setting | Description |
|---|---|
| Select the time period for the report | Select the time period for which you want to view data in the report. |
| View report by | Select the primary group-by attribute shown in all the report pages. You can change this attribute at any time and all report pages will show group values by the new attribute. |
| Filter by attribute (optional) | Select the organizational attribute and values you want to use to filter the employees shown in this report. |
| Exclusions | Use the check boxes to:
|
| Select the preferred language for your report | Change the language for your report. |
After confirming the settings, check the number of measured employees to confirm this is the population you want to analyze.
About this report
In this section, we:
- Provide metrics specific to this report.
- List the three main report pages, including the business question the page seeks to answer and the type of insights and data the page contains.
Coach with manager 1:1s
Are new hires getting the 1:1 coaching and support from their managers that they need?
Learn how much time employees spend, on average, in monthly 1:1s with their manager. We display this information by group and also by new hires versus tenured employees.
Here's what the visuals on this page show:
- Middle chart – Percentage of new hires who get a recommended minimum 50 minutes of monthly 1:1 time with their managers
- Lower middle chart – Distribution of new hires and tenured employees by the average monthly manager 1:1 time they receive
- Top right chart – How the average monthly time in manager 1:1s is trending over time
Boost time spent learning
Is the organization sufficiently encouraging new hires and employees to set aside time for learning?
View the average hours employees spent in learning-related calendar events per month, broken out by new hires and tenured employees.
Here's what the visuals on this page show:
- Middle card
- Hero metric – Percentage of new hires who don't have any learning-related calendar events in a month
- Chart – Distribution of employees by average monthly learning-related calendar events, broken out by new hires and tenured employees
- Top right chart – How the average monthly time in learning-related calendar events is trending over time
About learning-related keywords
This report figures out which calendar events are learning related by using keywords from meeting and appointment titles in Outlook. We've added a default set of keywords that contains these terms:
- train
- learn
- course
- introduction
- onboarding
- induction
- academy
- education
- brown bag
- brownbag
To learn more about customizing metrics, refer to Customizing metrics in Viva Insights.
Foster new hire networks
How are new hires developing their network and how fast are they integrating into the organization’s network?
Learn how new hires are negotiating and creating networks at work, and also whether those new hires are getting enough manager coaching time.
Here are the visuals that this page shows:
- Left card – Average internal network size
- Middle chart – How sufficient manager coaching time (that is, 50 minutes or more per month) affects employees' average network size
- Top right chart – How the average internal network size is trending over time
Glossary
View this report's metrics.
Other features
The report also includes the following features:
- Why it matters interpretations – Get additional context and links to supporting research.
- Take action recommendations – Discover opportunity areas and recommended actions for each section in the report.
Power BI tips, FAQs, and troubleshooting
For details about how to share the report and other Power BI tips, troubleshoot any issues, or review the FAQ, see Power BI tips, FAQ, and troubleshooting.