Note
Access to this page requires authorization. You can try signing in or changing directories.
Access to this page requires authorization. You can try changing directories.
Organization insights help leaders and managers build high performing teams. Leaders and managers can see key indicators of their organization’s wellbeing, productivity, and team culture, and they can find features and tools to help support their teams.
Subscriptions, roles, and access
To view organization insights:
- You need to have a Viva Insights subscription (that is, a premium license).
- To view organization insights for your team (direct and indirect reports), your Insights admin needs to assign you the Group Manager role in Viva Insights. And, you need to have a number of direct and indirect reports that meets or exceeds the minimum group size your Insights admin set.
- To view organization insights for the entire company, you need "delegate access" provided by a group manager. Learn how delegate access works.
For HR data-driven questions, such as "How many new hires are in my organization?" you'll see insights for all employees who have data uploaded in the organization. For behavioral data-driven questions like "How many after-hours hours do new hires work?" you'll see insights only for employees who have a Viva Insights subscription.
Insights by role
People with delegate access can see organization insights that include every measured employee in their tenant.
People enabled as Group Managers can access organization insights that include people who report to them directly or indirectly. Your Insights admin maintains this reporting hierarchy. If you have delegate access and you're also a Group Manager, you can toggle between the two organization insights views.
Data and privacy
Viva Insights commits that no user will discover information about another identified individual that they couldn't already know. This principle applies to every feature in Viva Insights, including organization insights.
For further detail about privacy and organization insights, refer to our privacy information.
Using organization insights
Note
If a group manager gives you delegate access to view organization insights, you can’t see the manager’s personal insights.
When you open Viva Insights, here's what you might see on the Home page:
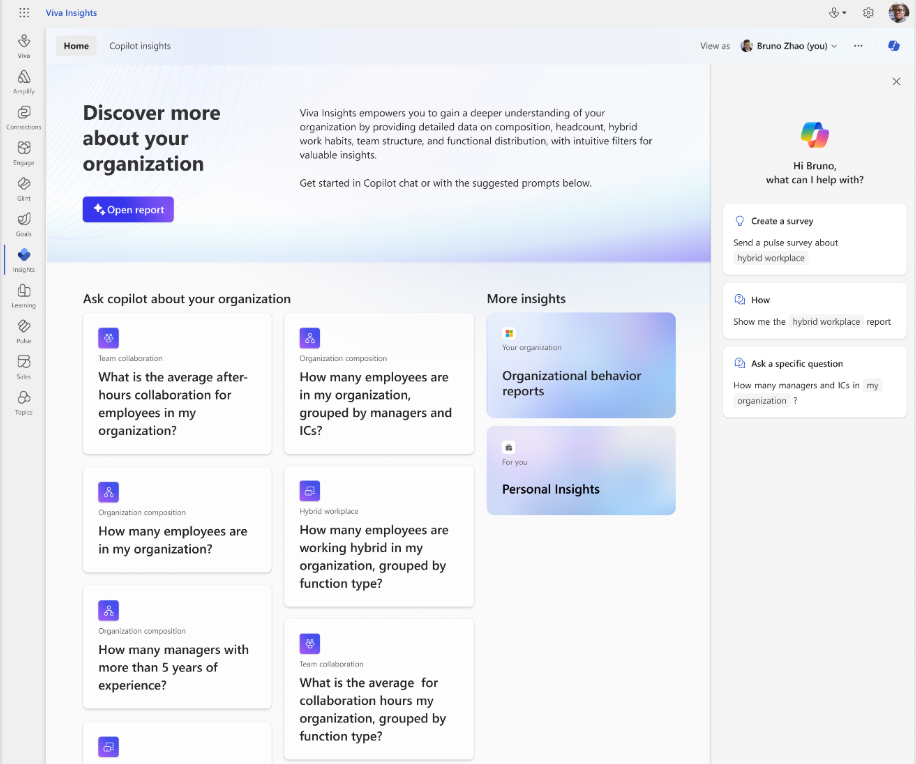
At the top, you'll see recent insights about your organization, such as the number of uninterrupted hours your employees spent working in recent weeks. Select Open report to learn more about those insights.
The rest of the page highlights suggested prompts you can ask Microsoft 365 Copilot about your organization to uncover additional insights. When you select a prompt, that question will appear in the Copilot chat window on the right. Learn more about how to use Copilot.
To access other ready-to-read reports about your organization's employees, customers, and operations such as new hire onboarding and meeting cost and quality, under More insights, select Organizational behavior reports. Learn more about these reports.
Finally, to access your personal insights focused on your own work habits, under More insights, select Personal Insights. Learn more about Personal Insights.
Helpful terms
Current period – Unless otherwise stated, most insights are showing the result for the most recent period—that usually means the most recent complete week of data. A few insights use a four-week or rolling four-week window instead, to smooth normal variability and make it easier to understand the insight. If an insight uses something other than the most recent week for the current period, you will see it called out on the insight card.
Employees – Organization insights provide measures for groups of employees, and are meant to capture what typical workday activity looks like for those employees. To avoid skewing the averages by including people who are not at work during the week (for example, they are on holiday or out sick), organization insights only measure people who have some activity in Outlook or Teams during the week.
Organization breakdown – The groups displayed in the organization breakdown are based on your reporting hierarchy, which your Insights admin maintains. Each group includes people who report directly or indirectly to a person who reports to you. The insights represent the activity of the group, not just that person who reports to you, even though their name is used to label the group.
Those with delegate access who are viewing the insights for the entire company will see the organization breakdown by organizations reporting to top-layer leaders.
Peer organization – Peer organization includes groups near your own group in the reporting hierarchy. If available, the peer organization includes people who report directly or indirectly up to your manager, but not up to you. If there aren't any groups like this, or they don’t meet the minimum group size, the peer organization includes people who report directly or indirectly up to your skip-level manager but not up to you. If there’s not enough people who meet that definition either, you won't see peer organization insights.
Those with delegate access who are viewing insights for the entire company will also not see peer organization insights.
Prior period – The prior period is the period immediately before the most recent period – usually the week before the most recent completed week.
Reporting hierarchy – Your Insights administrator manages the reporting hierarchy. This hierarchy identifies reporting relationships throughout the company: people who are managers, and the people who report to them. The reporting hierarchy might be sourced from Microsoft Entra ID or from a manual upload from your company’s HR information system. Viva Insights uses this information to identify people in your organization, your peer organization, and any organizations that might report up to you.
Your organization – If the insight scope selector says Your organization, this group includes everyone who reports to you directly or indirectly. This group is based on your organization’s reporting hierarchy, your Insights administrator manages. If the insights scope selector says [Your company name], this group includes everyone who has been set up as part of the premium insights group by your Insights administrator.
Control access to Insights features
Applies to: Viva Insights administrators
To control access to certain Insights features, like the Meeting Cost and Quality features, Insights administrators can use the Viva feature access management platform. This platform provides a flexible approach to deployment by letting you enable or disable individual premium features through multiple access policies for the tenant, users, and groups.
Policy settings apply any time a user signs in, allowing the user access to all enabled features. Because you can set multiple access policies -- targeting the tenant, groups, and individual users -- a user might be impacted by more than one policy. Individual user and group level policies always take priority over a tenant-level policy. For instructions, see Control access to features in Viva.
| Insights feature | State | Description |
|---|---|---|
| Meeting cost and quality | Enabled | When this feature is enabled, leaders can see the Meeting Cost and Quality report in the Insights app, and individual users can see the meeting review card and Outlook nudges with insights about the cost and quality of their large and long meetings. |
| Disabled | These features are not available to the Insights user. |
Metric definitions
Refer to Metric definitions for all Viva Insights metric definitions. You can also access metric definitions while you're using Viva Insights—just select the (i) icon next to the organization insight card or organization insight page title.
FAQs
Q1. Can I opt in or opt out of seeing organization insights?
To opt out or back into seeing organizational insights, your Viva Insights administrator needs to enable or disable group manager permissions for you. They can enable these permissions by following the directions in Manager settings.
Q2. How do I get access to organization insights?
Refer to Subscriptions, roles, and access in Organization insights.
Q3. I see my organization insights cards, but the current week values are just “—“. What’s happening?
Viva Insights only reports on activity for employees who are “active” in a week—that is, people who sent at least one message in Outlook or Teams or joined at least one meeting. This method improves accuracy by leaving out people who are away from work for an extended period, like when they're on vacation or taking a leave of absence.
To protect individual privacy, you'll only see organization insights when the number of active group members meets the minimum group size your Insights admin set. Some groups might have a group size close to the minimum. In these cases, if enough people are away from work and the number of active people dips below the minimum, you won't be able to access organization insights for that week. However, you can still refer to trend charts on the Wellbeing, Productivity, and Teamwork tabs. These charts show results for previous weeks when your active group met the minimum privacy threshold.
Q4. How do organization insights handle holiday weeks?
Generally, organization insights show lower activity during weeks with holidays, as the measured results aren't adjusted to make up for the holiday. If an employee takes the entire week off from work during the holiday week, they'll be excluded from the measured result. For employees who don't take the week off, Viva Insights measures the activity that did occur over the course of the week.
As discussed in Q2, you might not see results during holiday weeks if enough of your group takes the week off from work and the active group size falls below the minimum privacy threshold.
Q5. There are data points missing from my trendline visuals. Why?
To protect individual privacy when a group average appears in an organizational insight, Viva Insights checks to make sure the group is larger than the minimum group size.
The measured group only counts people who are active in Outlook or Teams during the week, so the group size might be lower some weeks than others. For example, the group size is more likely to decrease during the holidays. That means that you might see a result for a particular group for one week, but not for a different week when the group size has gone below the minimum. As a result, you might sometimes see broken or incomplete trendlines.
Q6. I don’t see all of the teams reporting to me in my organization breakdown visual. Why?
To protect individual privacy when a group average appears in an organizational insight, Viva Insights checks to make sure the number of measured people active in Outlook and Teams is larger than the minimum group size. We won't show any groups smaller than the minimum group size.
The trend graph can show up to 20 groups that report up to you. You'll see organization insights for each group larger than the minimum group size.
Q7. Why doesn’t the trendline chart show the most recent week of data?
Viva Insights aggregates new data every week. Usually, the most recent week of data in a trendline is labeled with the first day of the last complete week. For example, if someone viewed their data on Wednesday, October 5, 2022, they'd see the most recent week of data labeled September 25, 2022. This data represents activity between September 25 and October 1.
If the most recent week of data in the trendline is labeled earlier than the first day of the last complete week, it might be because:
- The group size has fallen below the minimum in the most recent week.
- If it’s early in the week, processing and aggregation of the new data may have been slightly delayed.
Q8. What happens if I have fewer people reporting to me than I used to?
If you're no longer a people manager and have no one directly or indirectly reporting to you, you won't be able to access organization insights.
To be able to access organization trends, you need to have a certain number of direct and indirect reports in the most recent week of available data. This number needs to be above the minimum that your administrator set.
Here's what this means:
If your total number of direct and indirect reports falls below this set minimum, organization insights won't be available to you. If this number seems like an error, your Insights administrator can validate your group against the organization hierarchy.
Viva Insights bases your eligibility to view organization insights on the total size of your group, not just the number of employees in your group actively using Outlook and Teams. If the number of your direct and indirect reports who actively use Outlook and Teams falls below the minimum in the most recent week, you'll still be able to access organization insights. The insights will just show data for the last period when your active group size was above the minimum. You won’t see insights for the week when the active group size was below the minimum. If the number of your direct and indirect reports who actively use Outlook and Teams falls below the minimum in the most recent week, you'll still be able to access organization insights. You won’t see insights for weeks when the active group size falls below the minimum.
Q9. Can I send feedback about these features?
We would love to hear from you! To send feedback, select the Is this helpful? link at the bottom of any page.