Note
Access to this page requires authorization. You can try signing in or changing directories.
Access to this page requires authorization. You can try changing directories.
Complex organizations are Microsoft Azure Active Directory (AD) customers who use multiple Microsoft 365 or Office 365 tenants. The following two reasons are primarily why your organization has this type of configuration:
Mergers and acquisitions
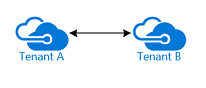
A business merger between two companies resulting in an organization made up with multiple Microsoft 365 or Office 365 tenants and separate Azure ADs. The tenants either choose to remain separate and collaborate together or merge into a single tenant.
The following shows how mergers and acquisitions require the use of two tenants.
Conglomerates
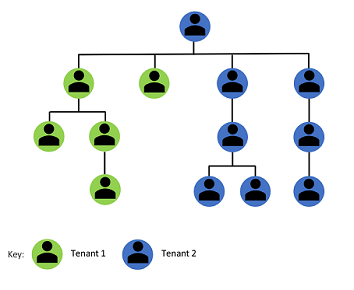
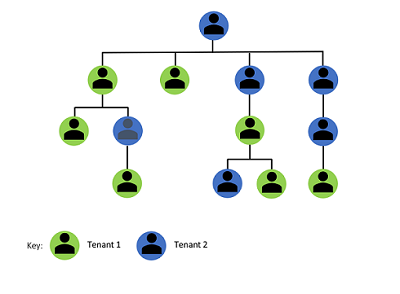
A conglomerate is a corporation made up of several independent subsidiaries. The subsidiaries are tenants that have separate Azure AD and will collaborate together and remain separate.
The concept of conglomerates is as follows.

Purpose of this article
Complex organizations represent challenges for deriving insights. Often, the task falls to analyzing each of the tenants that make up the complex organization independently and comparing them manually. The process can be highly manual in nature. This article provides a growing number of examples that explain how to overcome manual processes. These examples also include those that lead to output visualizations.
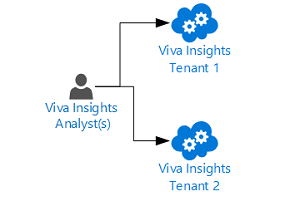
Use Viva Insights
Microsoft Viva Insights provide information and research-based behavioral insights into how an organization gets work done:
Some examples of the works to get done are:
- How to enhance organizational agility
- How to boost employee engagement
- How to improve agility
- How to foster innovation
Advanced analytics for organizations comprised of multiple Viva Insights tenants can be enabled by:
- Combining the data in a central location
- Combining that data with other data sources
A few starter use cases that would be enabled by this data combination strategy are:
Identify collaboration patterns between two distinct business groups (tenants)
Distinguish collaboration patterns between cross business groups (tenants) as compared to true external interactions.
Data combined from Viva Insights with external sources to address headcount planning, employee well-being, permanent remote work, inclusion and diversity, and so on.
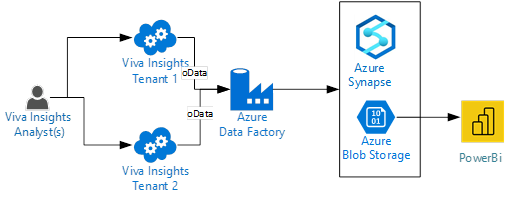
There are different ways to create a data pipeline to copy data from the source to the destination. There are also different data storage locations that can be used, such as storage accounts, SQL databases, synapses, and so on. An example leveraging Azure data factory, Viva Insights organizational data, and Azure blob storage will be described in the following sections with a Business Continuity use case.
Preconditions
The following preconditions are to be fulfilled, prior to continuing with its analytical process using Microsoft Viva Insights:
Organizational data
Organizational data is a key requirement for Viva Insights and further advanced analysis. The organizational data relates to attributes such as employee's title, manager, group, level, and so on. The organizational data that is generally required is further described in Viva Insights prepare organizational data.
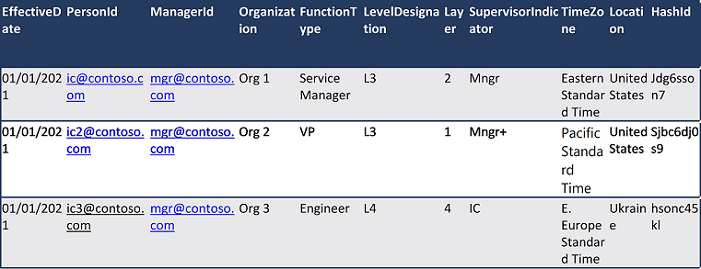
To enable advanced analysis, the following schema can be used in the file that is uploaded into Viva Insights:
Note
The schema should be the same between tenants.
| Attribute Name | Attribute Description |
|---|---|
| EffectiveDate | Date for which the given attribute value applies for the employee. The attribute applies until another record for the same attribute with a different effective date is specified. |
| PersonId | Unique identifier for the employee record. This identifier can be the employee's primary SMTP address or email alias. It must be in a simplified format that contains no spaces. For example, the format person.name@contoso.com is allowed; however, the format <Name, Person> (person.name@contoso.com) is not allowed. |
| ManagerId | Unique identifier for the employee’s manager, which is needed to correctly calculate metrics for time spent with managers and their direct reports. This identifier can be the manager's primary SMTP address or email alias. It must be in a simplified format that contains no spaces. For example, the format person.name@contoso.com is allowed; however, the format <Name, Person> (person.name@contoso.com) is not allowed. |
| Organization | The internal organization that the employee belongs to. An employee’s organization will be specific to the individual needs and could be identified by the leader of the organization, or by another naming convention. This data is needed to correctly calculate metrics for redundancy and insularity. |
| FunctionType | The job function that the employee performs. This job function is specific to the organization. This data is used to filter and group reports, and for grouping of data in Explore the stats features. |
| LevelDesignation | The employee’s level, which is represented as a string. This level is specific to the organization and can represent an employee’s experience or management level, or seniority within the organization. This data is needed to correctly calculate metrics for redundancy and insularity. |
| Layer | The place where the employee is within the organizational hierarchy. Layer is represented as an integer and expressed as the distance the employee is from the top leader of the organization. For example, the CEO is at layer 0. This data is used to filter and group reports, and for grouping of data in Explore the stats features. |
| SupervisorIndicator | The attribute used to view the habits of people managers or influencers in the organization in Power BI visualizations. This attribute powers the Overview table, the Workload charts that are generated when you use a template that requires this attribute. This attribute indicates the manager status of each employee as IC (individual contributor), Mngr (manager), or Mngr+ (manager of managers); however, if a different nomenclature is used in the file, you must update the Power BI chart filters accordingly. If you include SupervisorIndicator, you must also include the values IC, Mngr, or Mngr+ in the organizational data. |
| TimeZone | Time zone in which the employee works. This attribute must be one of the time zones in Time zones for Workplace Analytics. If no time zone is mapped to for an employee, the system will use the default time zone, which is Pacific Standard Time. |
| TenantInd | Unique name for the Tenant. For example, TenantA, TenantB, TenantC, and so on. |
| Location | Geographic region or other location detail. |
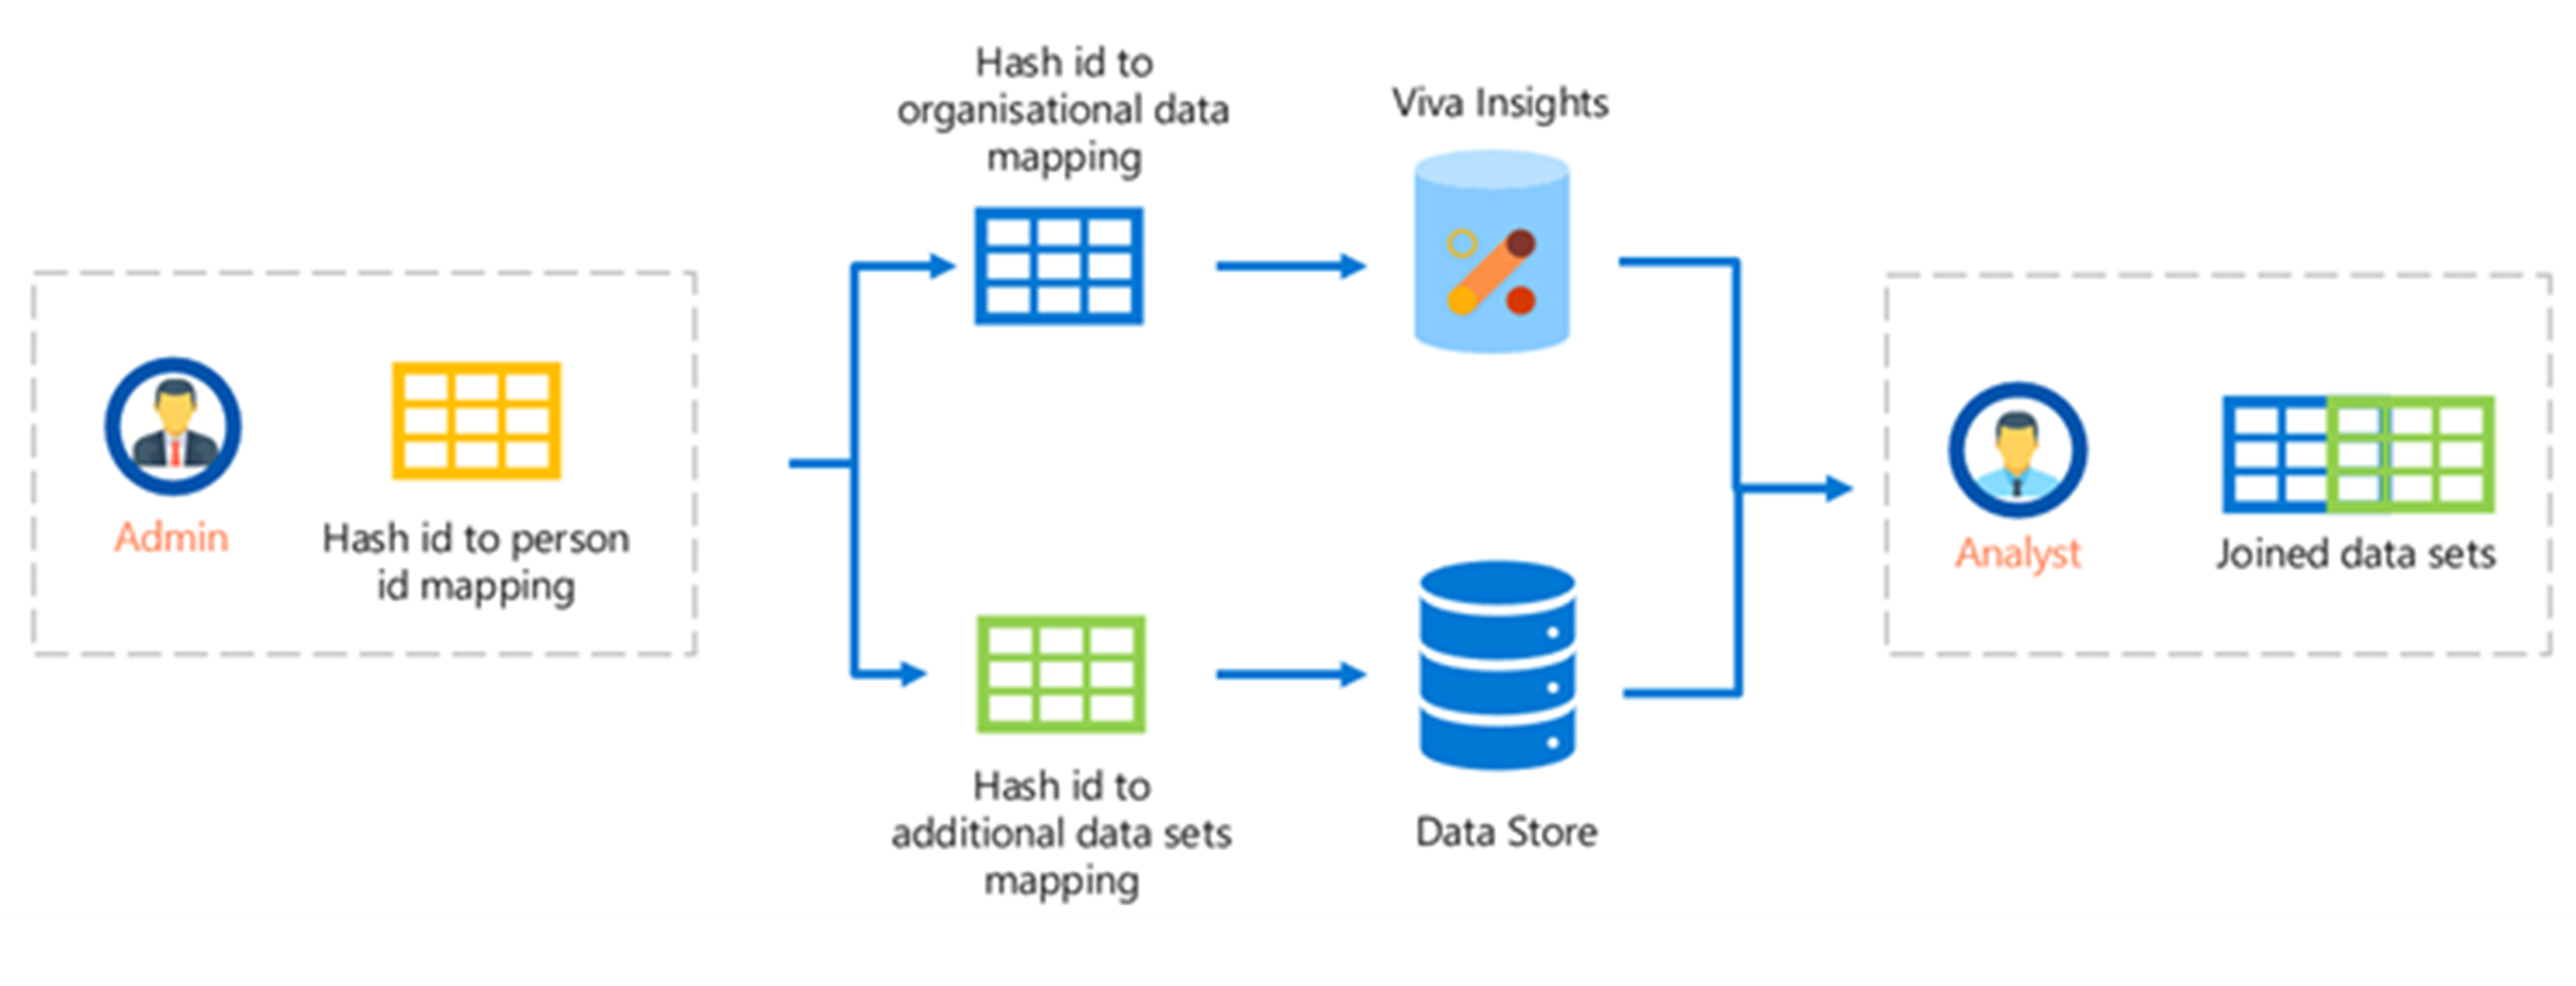
| HashId | Unique Hashed identifier for the employee. This attribute enables further advanced analysis on the Viva Insights query results. |
With the schema in the above table being used in the file, the analysis output from the uploaded file can be joined with other data sources (for example, sales data and zoom data) for an advanced analysis.
Additional instructions for preparing organizational data for Viva Insights are available here.
Example: Sample of an organizational data file
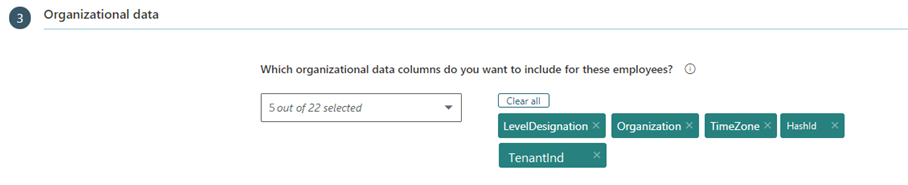
Viva Insights Business Continuity dashboard
Set up the Business Continuity dashboard for your tenant with the following modification:
- In the Organizational data section of the Business Continuity and Hourly Collaboration report, add HashId and TenantInd columns to the list. More columns can be added for this report if needed, for analysis. The following shows what attributes to select:
Azure
For Ad hoc with OData and Automated Data Pipeline, you will need:
- An application registration
- Registered application's secret for each tenant from which you are planning to pull Viva Insights query results.
You will also need an Azure subscription to host the data from the two tenants.
- To register an application, accomplish Steps 1 to 5 in the Automate Exports for each tenant.
- To obtain a secret for the registered application, select Certificates & secrets from your newly registered application in Azure Active Directory.
- For Key authentication, select New client secret and in Add a client secret, enter a description, select when it expires, and select Add. In Client secrets, select the new secret value, and select the Copy icon to copy the value.
- Make a note of the Application ID and secret that are created for each tenant.
- To obtain a secret for the registered application, select Certificates & secrets from your newly registered application in Azure Active Directory.
- In the case of Microsoft Azure subscription, perform the following steps:
- Deploy custom deployment from arm template.
- Configure the deployed resources.
The template creates the following resources:
- Resource group
- Key vault
- Storage Account
- Azure data factory using managed identity
(The example of a privilege that allows for creation of the above resources is Azure Administrator.)
Solution samples
The case of using query data from Viva Insights from multiple tenants, the following are a few sample solutions.
Ad hoc manual approach
Viva Insights queries can be executed and the output can be downloaded and further analyzed offline. This sample will be using the Business Continuity report listed in the Requirements section. There are no other pipeline setup requirements.
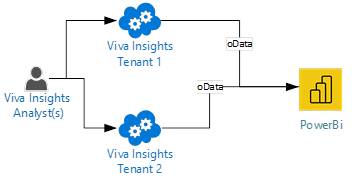
Ad hoc using OData approach
Viva Insights queries can be scheduled to auto refresh and accessed via OData links to provide further analysis or to be visualized in PowerBi reports. This sample will be using the Business Continuity report listed in the Requirements section. There are no other pipeline setup requirements.
Automated data pipeline
Viva Insights queries can be scheduled to auto refresh and downloaded to a central data store location for further analysis or visualizations. The solution sample uses Azure blob storage. This sample will be using the Business Continuity report listed in the Requirements section. The setup details are available here.
Solution Sample Pipeline Setup
Data pipeline - Automated
Download the DataFactory_OData_arm_template.json file from the Complex Organization sample solution in GitHub.
Deploy the arm template for data factory creation for MultiTenant by performing the following steps:
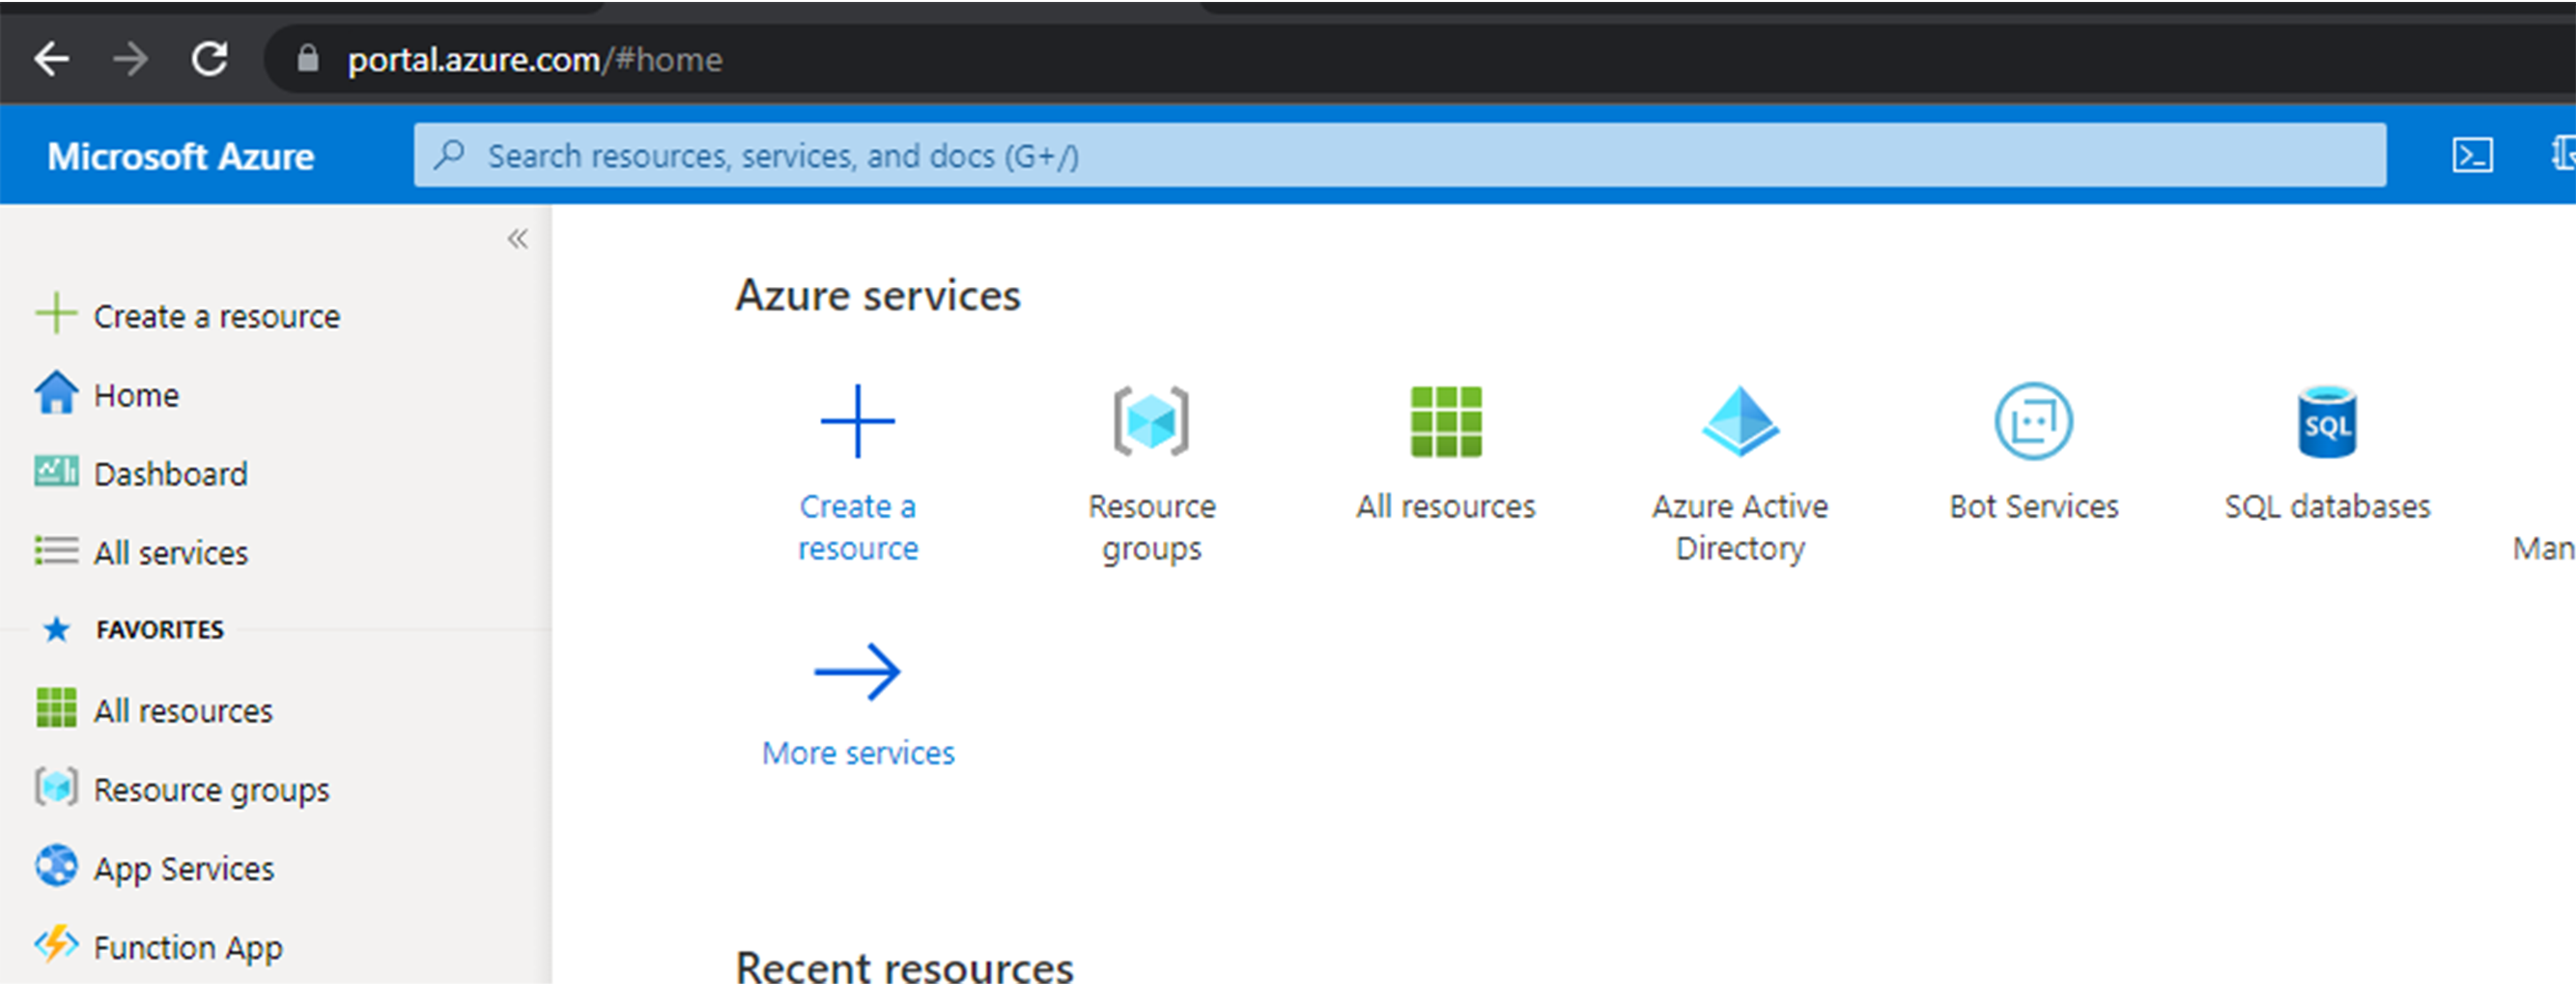
Launch the Azure portal for the subscription you want to use.
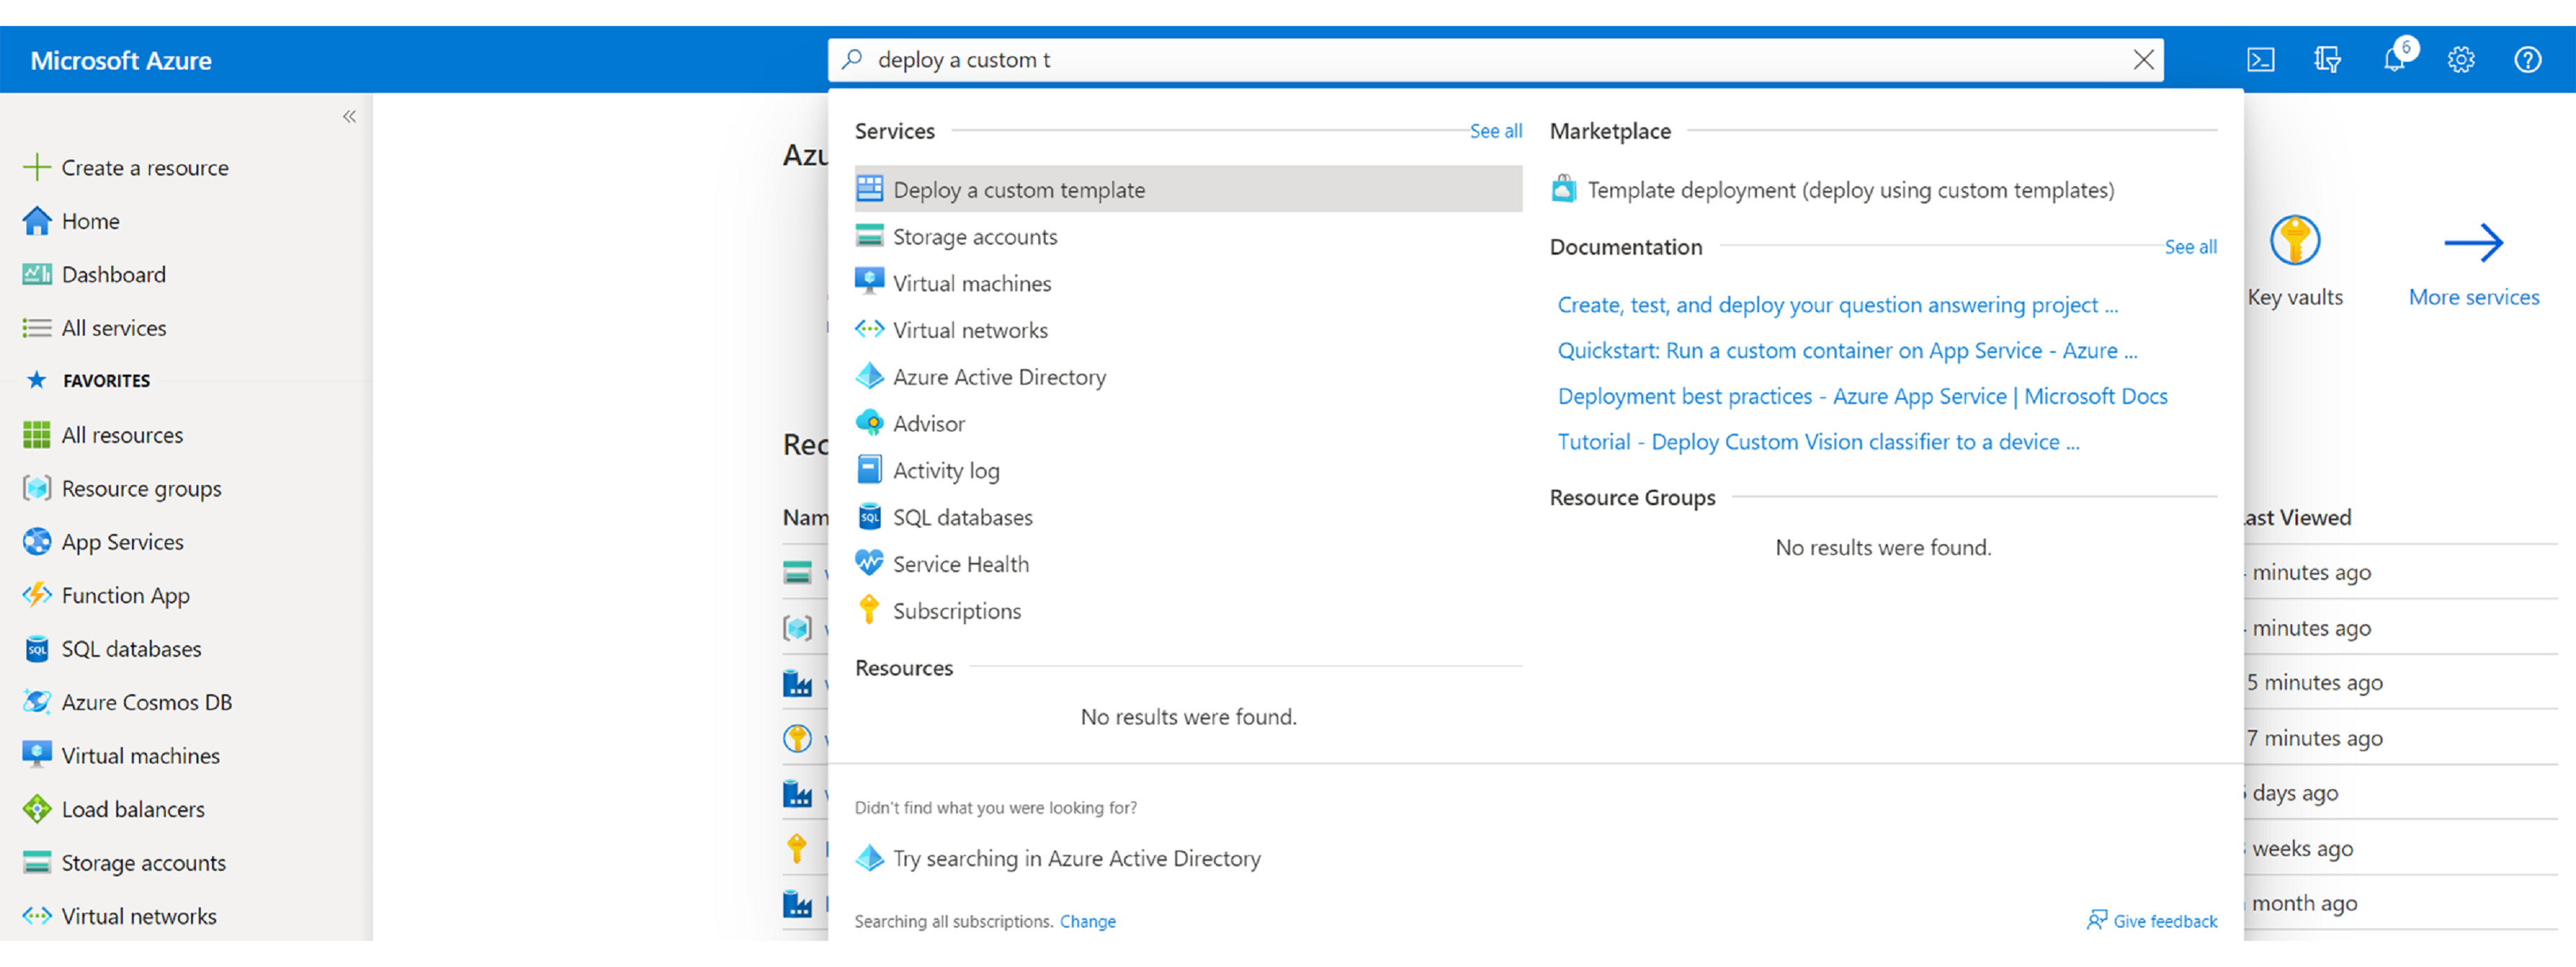
Search for Deploy from a custom template in the search bar.
After Deploy from a custom template is shown (under Services pane), select it.
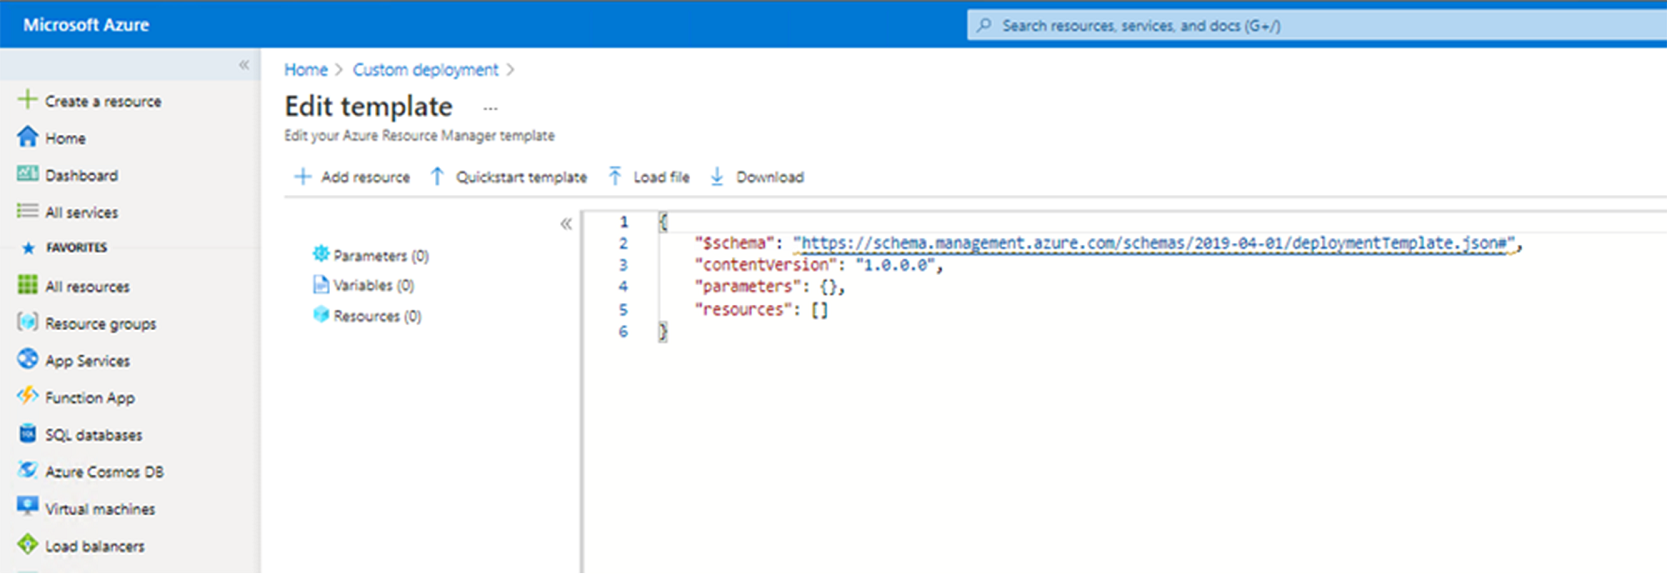
Select Build your own template in the editor. The Edit template screen appears.
Select Load file.
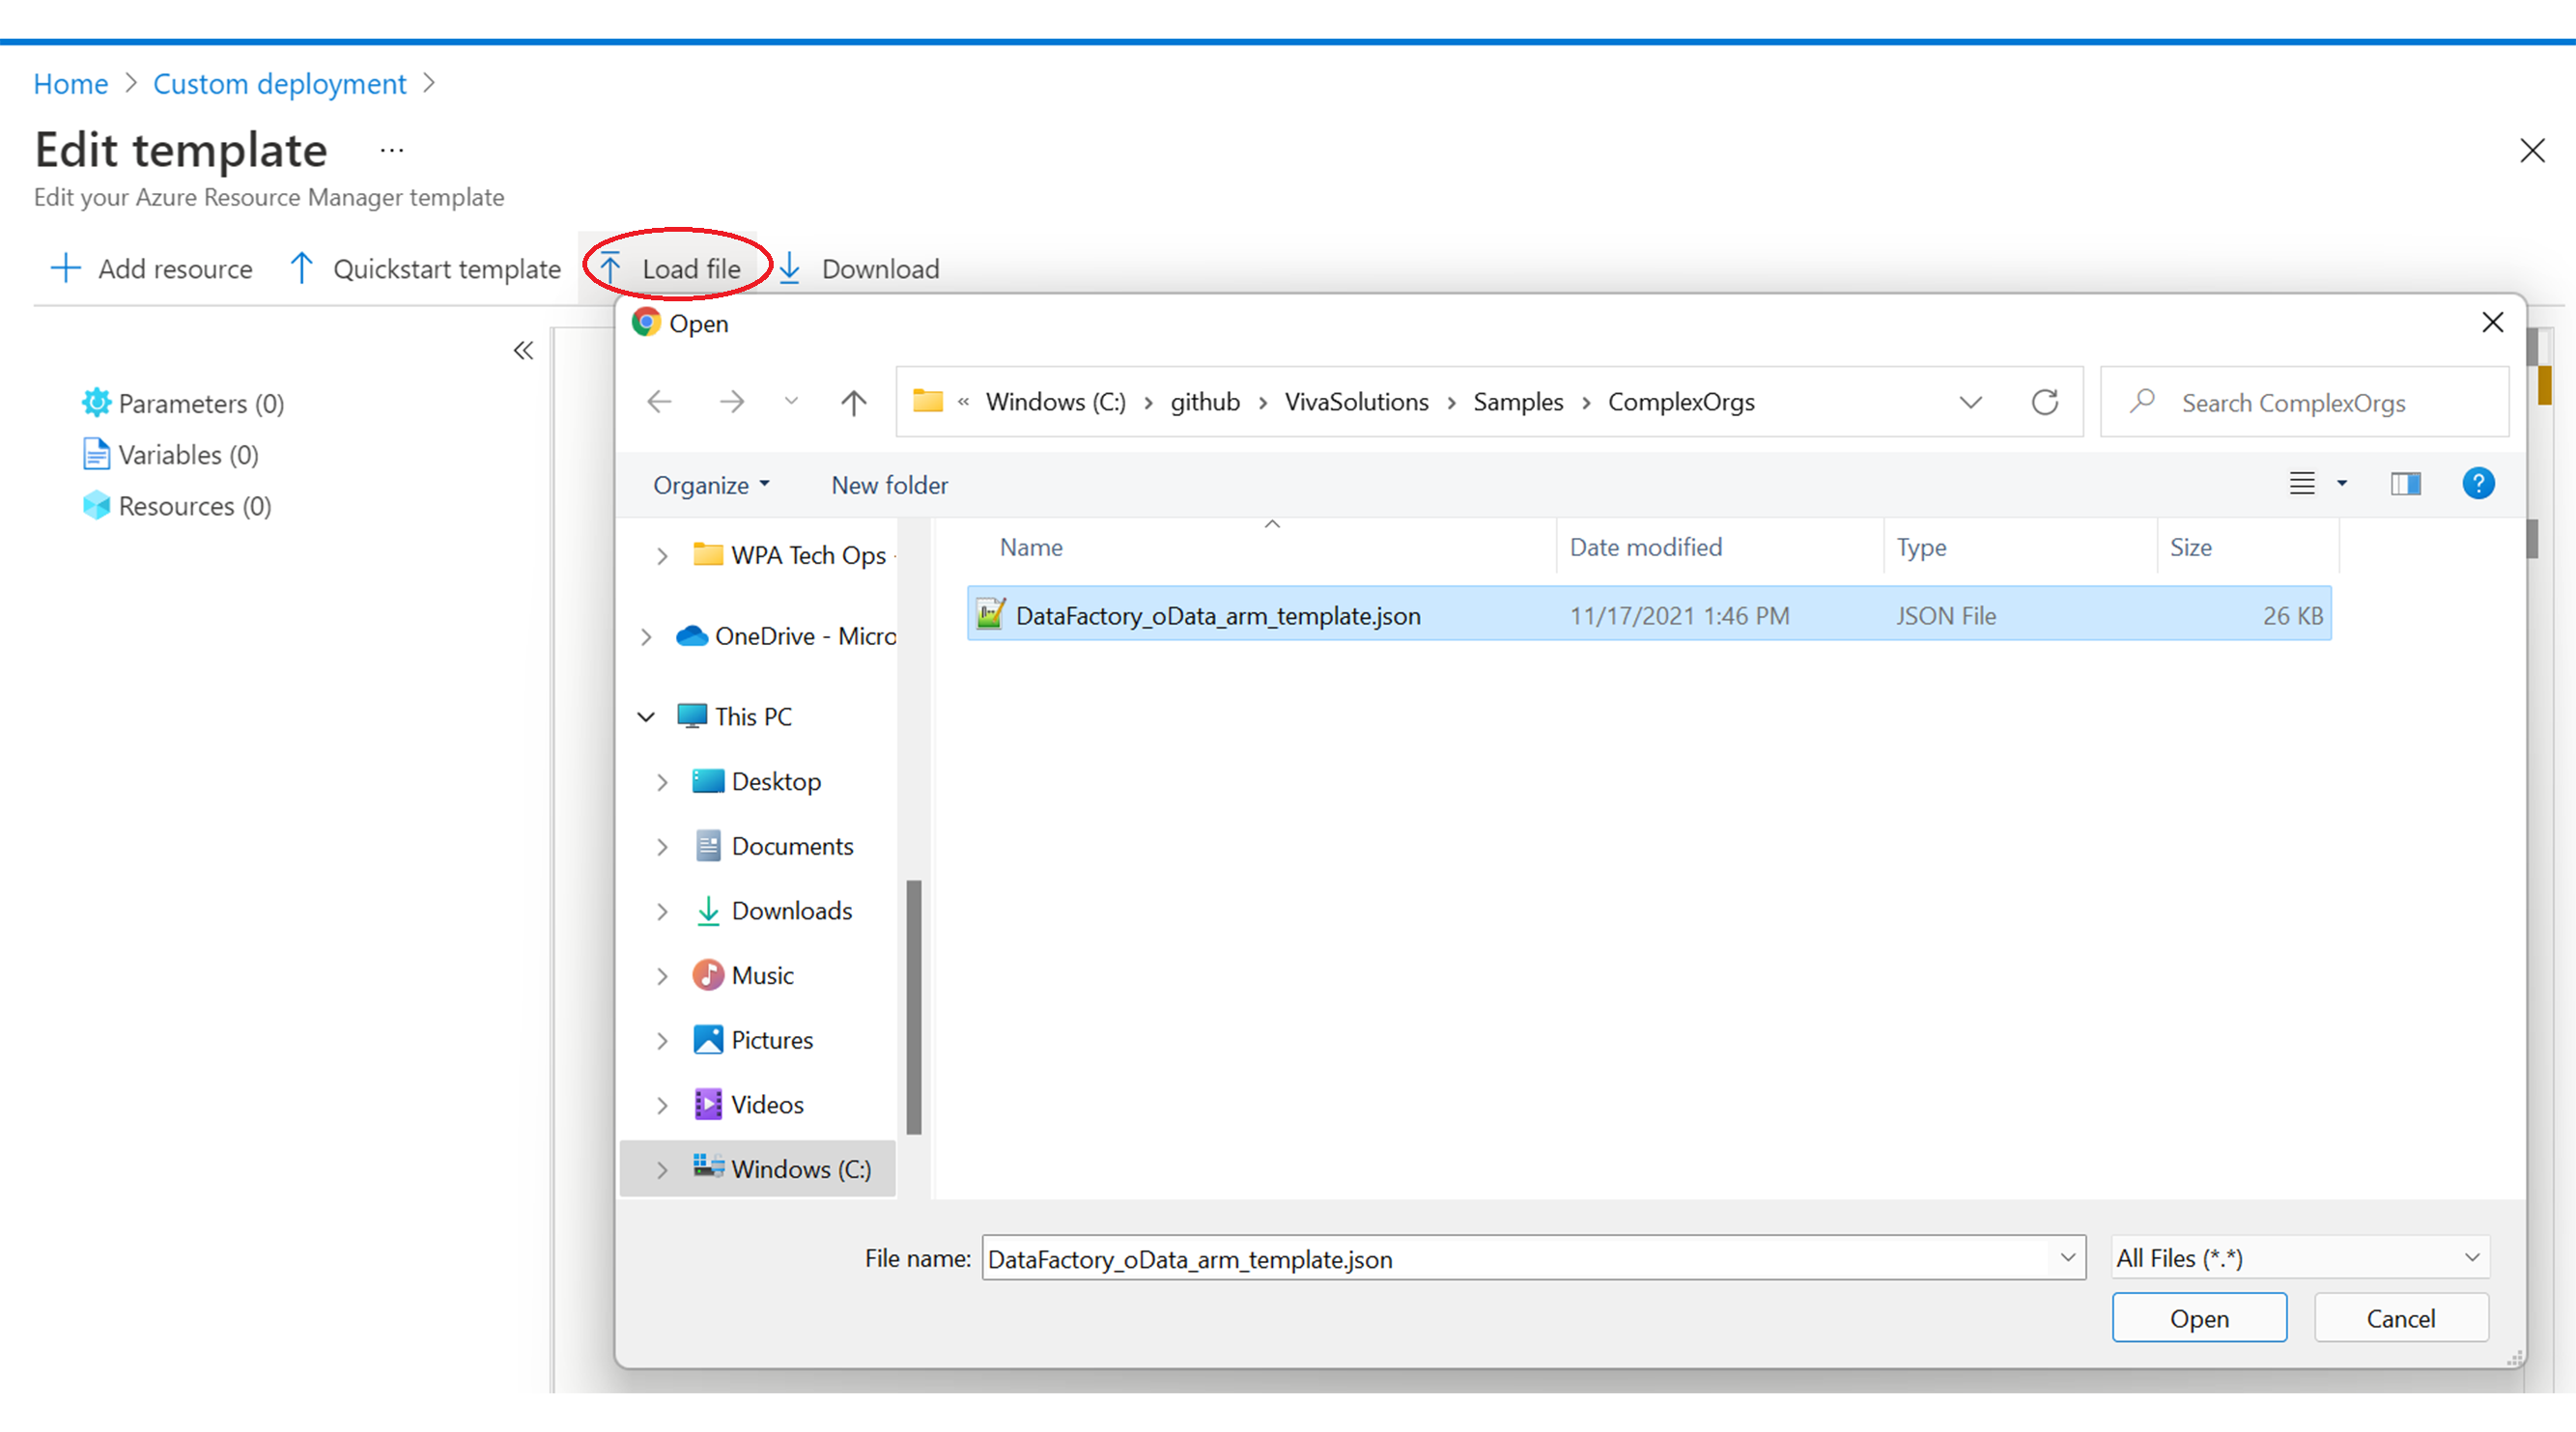 The browser window is displayed.
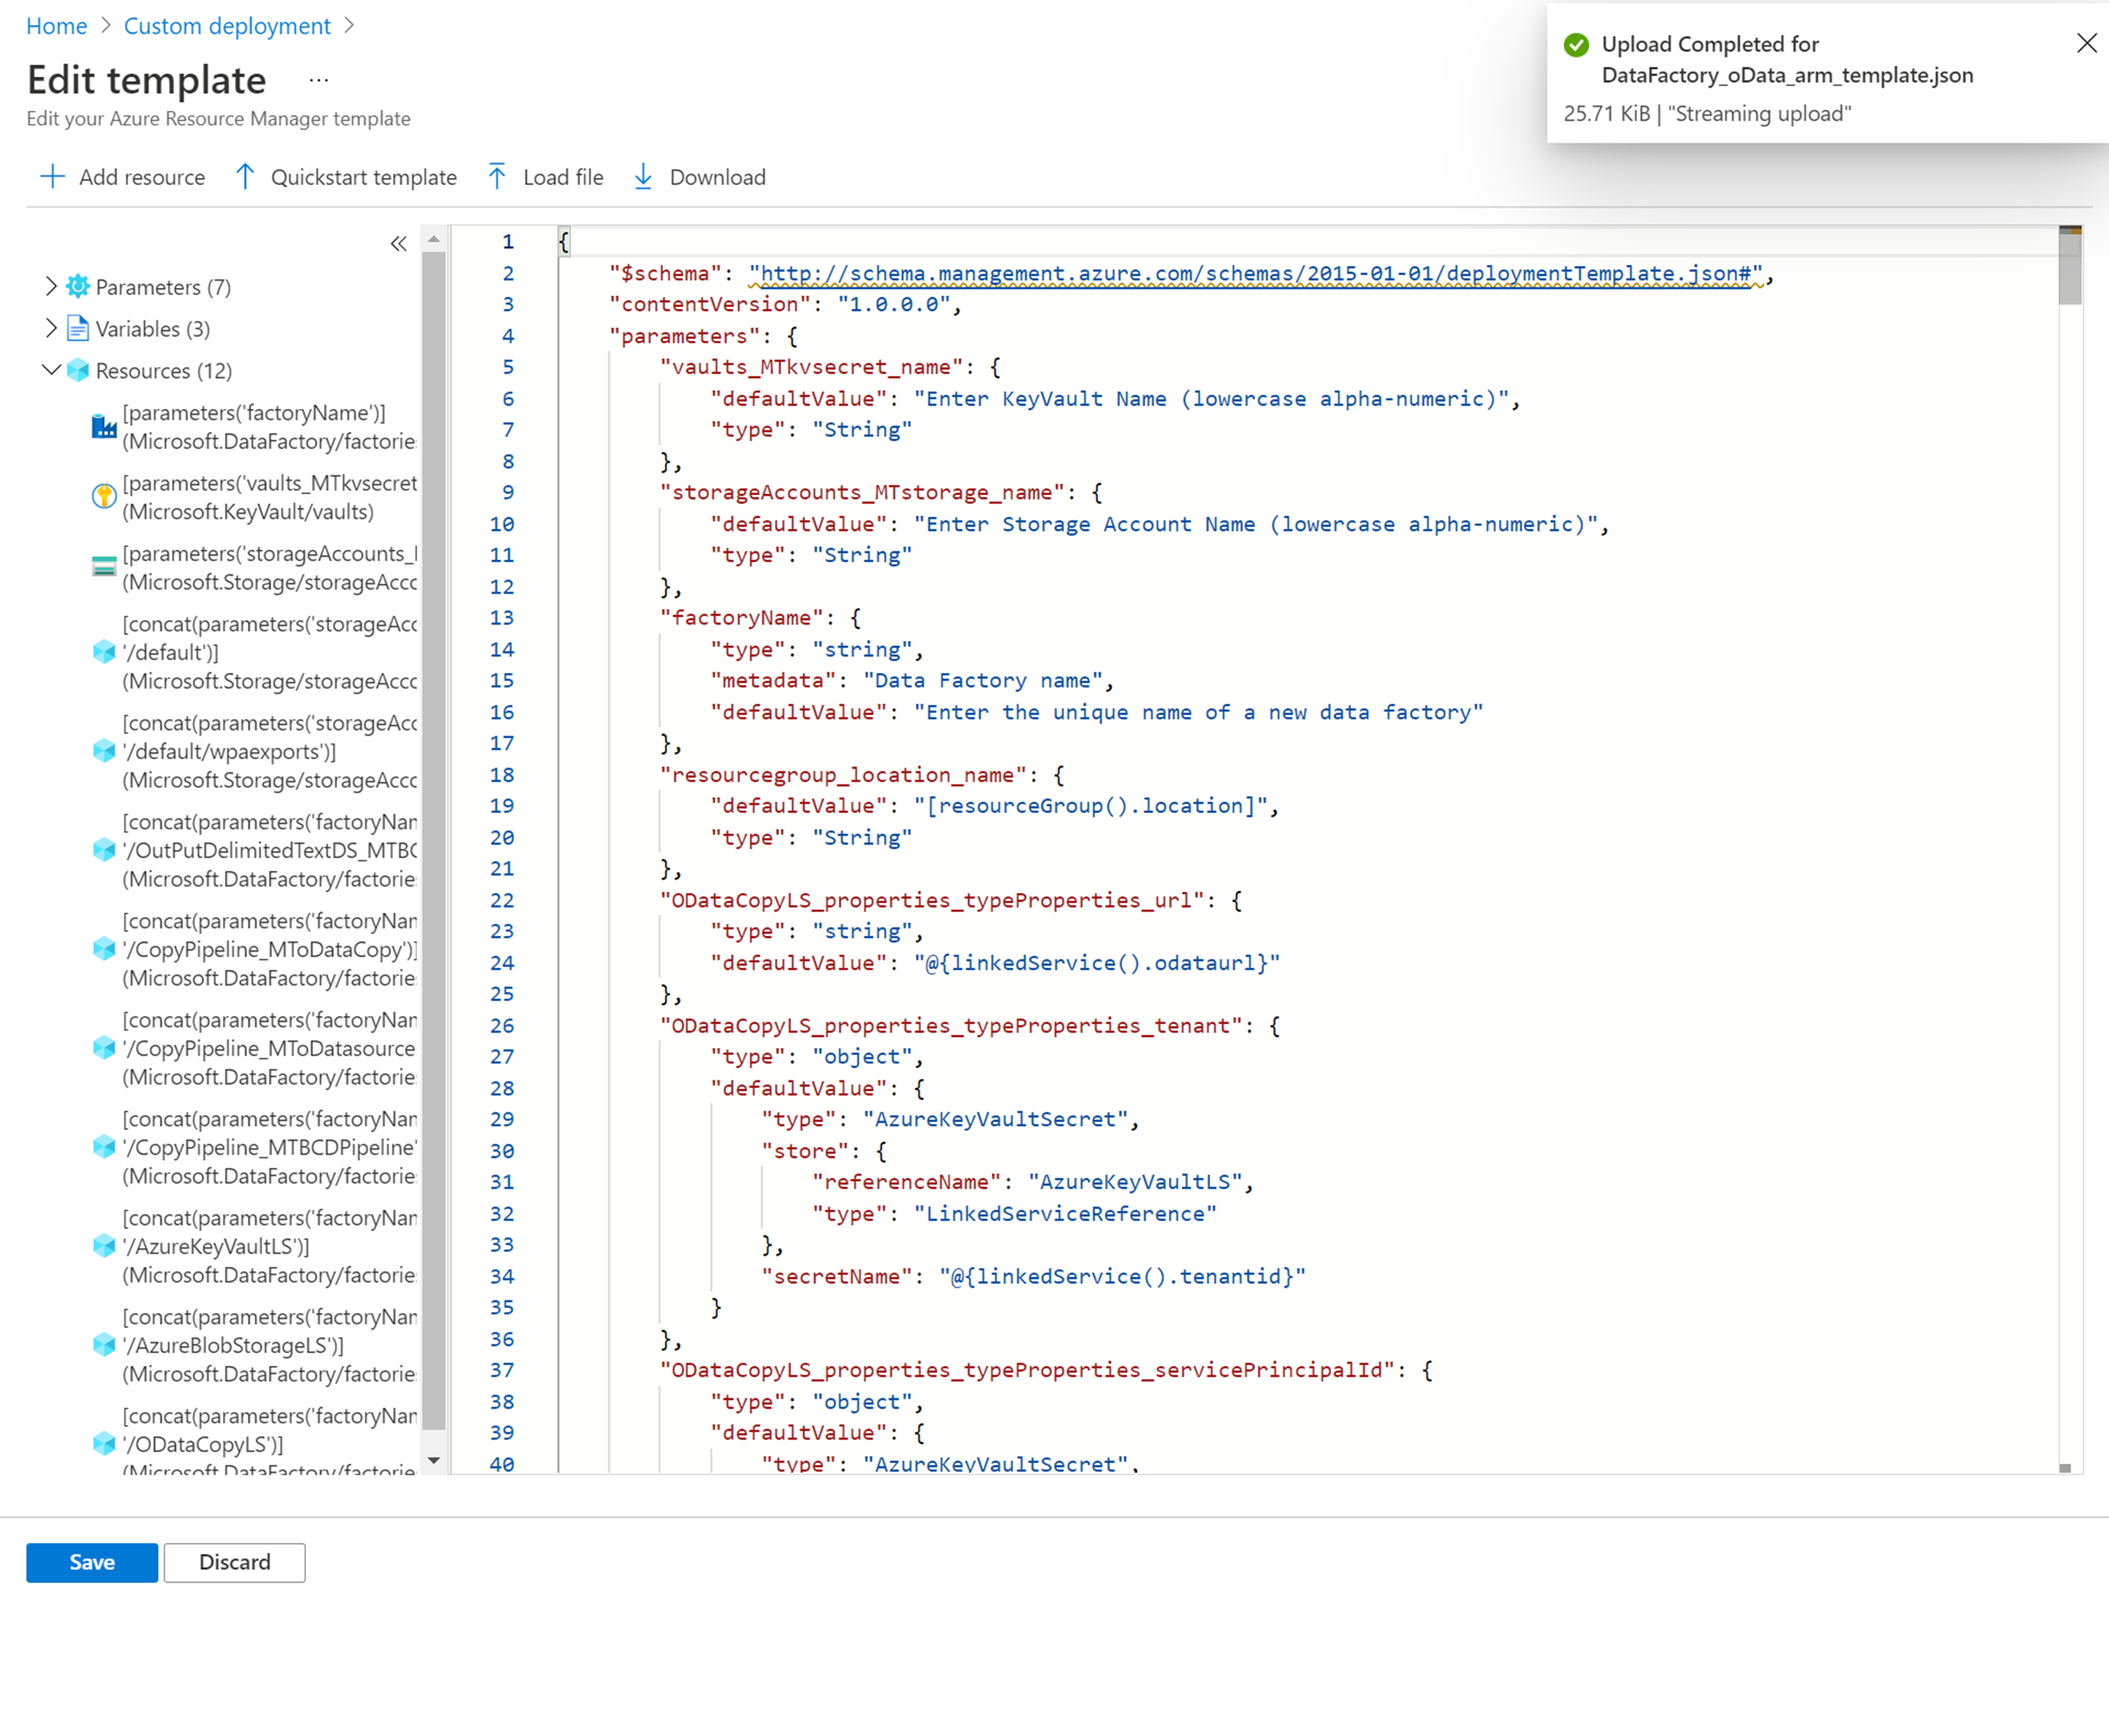
Navigate to the location that contains the downloaded DataFactory_OData_arm_template.json file and select Open.
In the resultant screen, select Save.
Provide values for the highlighted items: Resource group, Region, Vaults_MTkvsecret_name, Storage Accounts_MTstorage_name, and Factory Name.
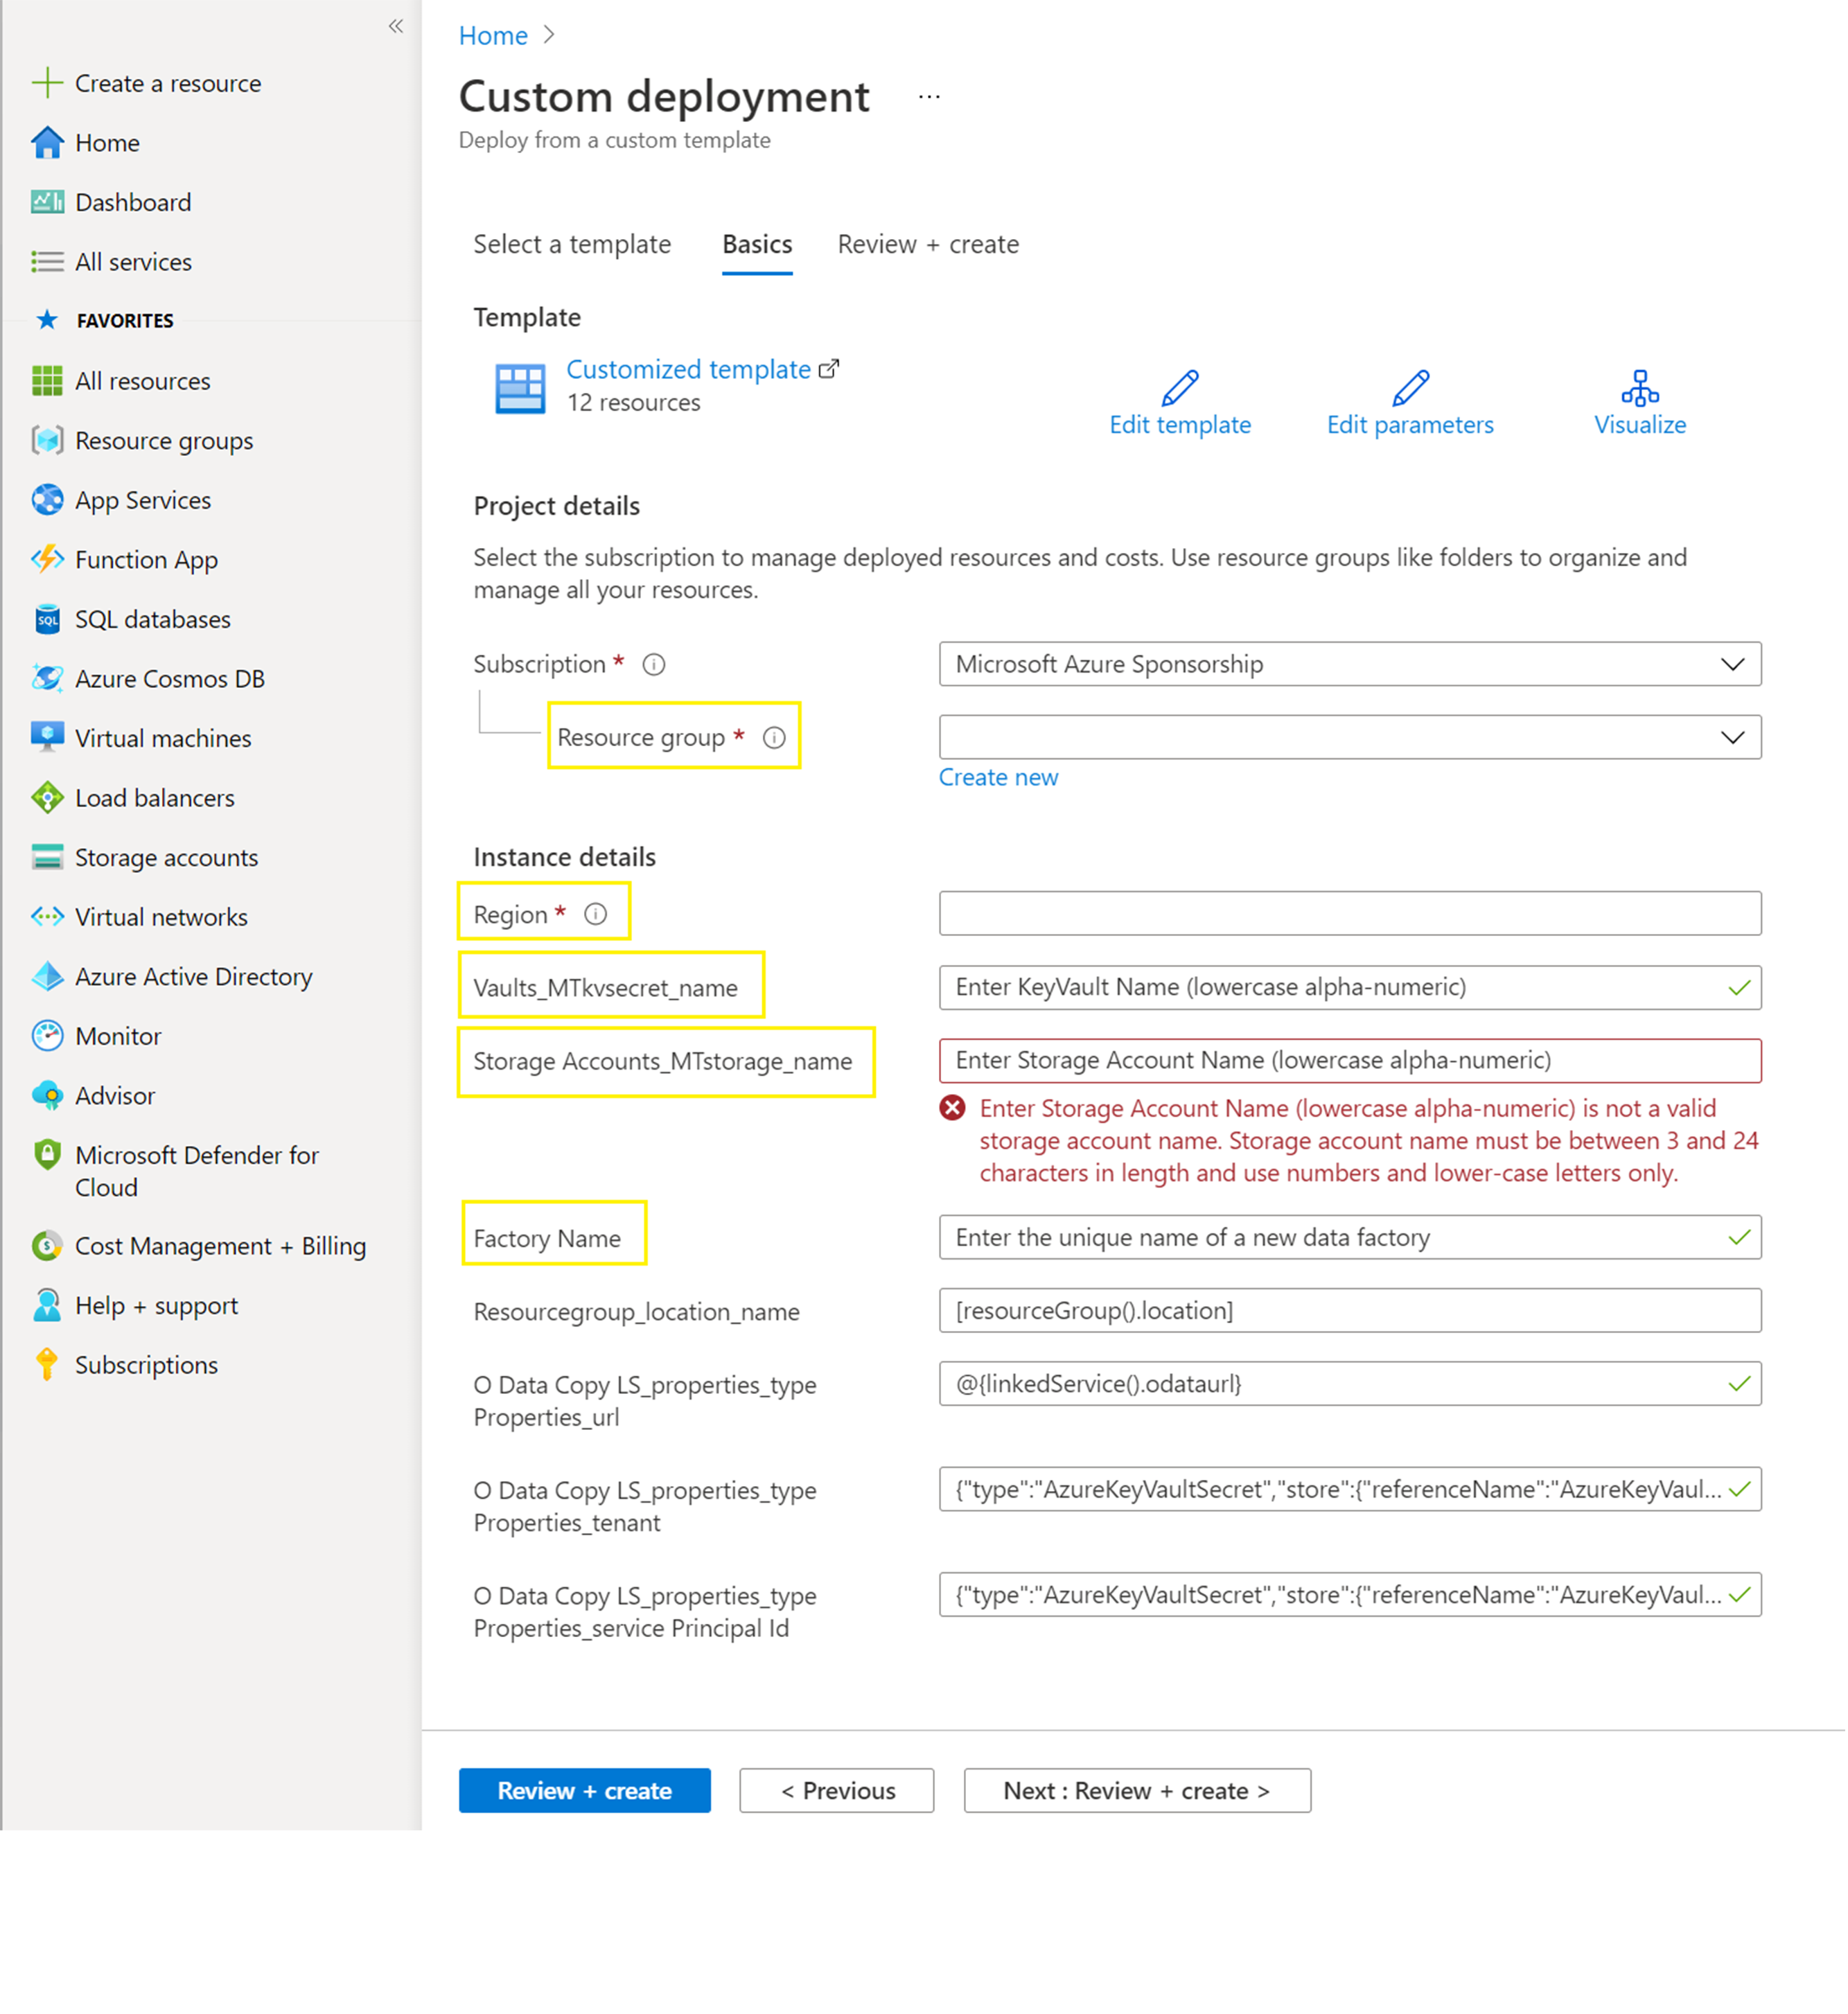
Select the Review + create tab, and select Create.
Grant access to the data factory managed service identity to the key vault and the storage account by performing the following steps:
- Launch the Data factory (V2) resource by clicking its link to obtain the managed service identity.
- Select Properties. The screen shows details for the chosen Data factory.
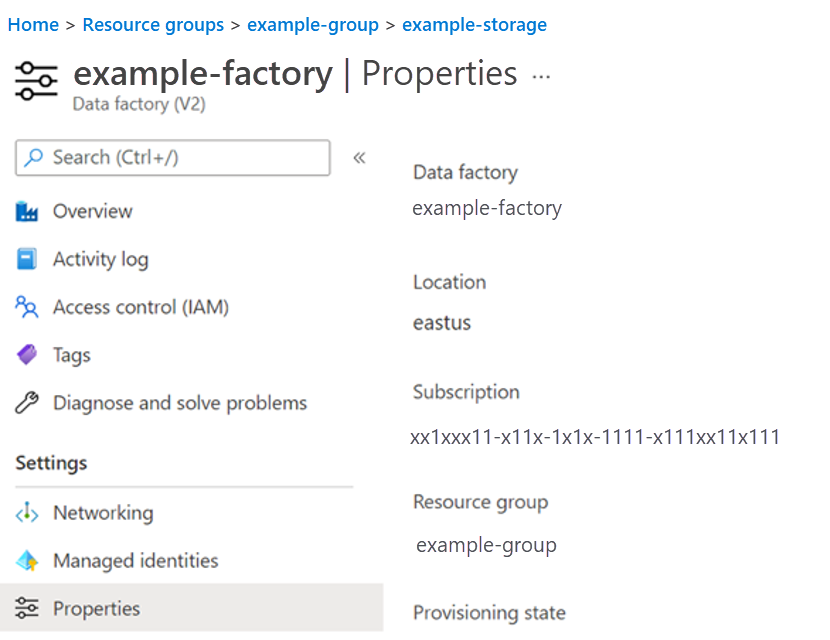
- Copy the value of the Managed Identity Application ID attribute.
- Navigate back to the screen of the resource group by selecting Overview, the Resources tab and the resource group name under it.
- Launch the Key Vault by clicking its link.
- Select Access policies in the left pane.
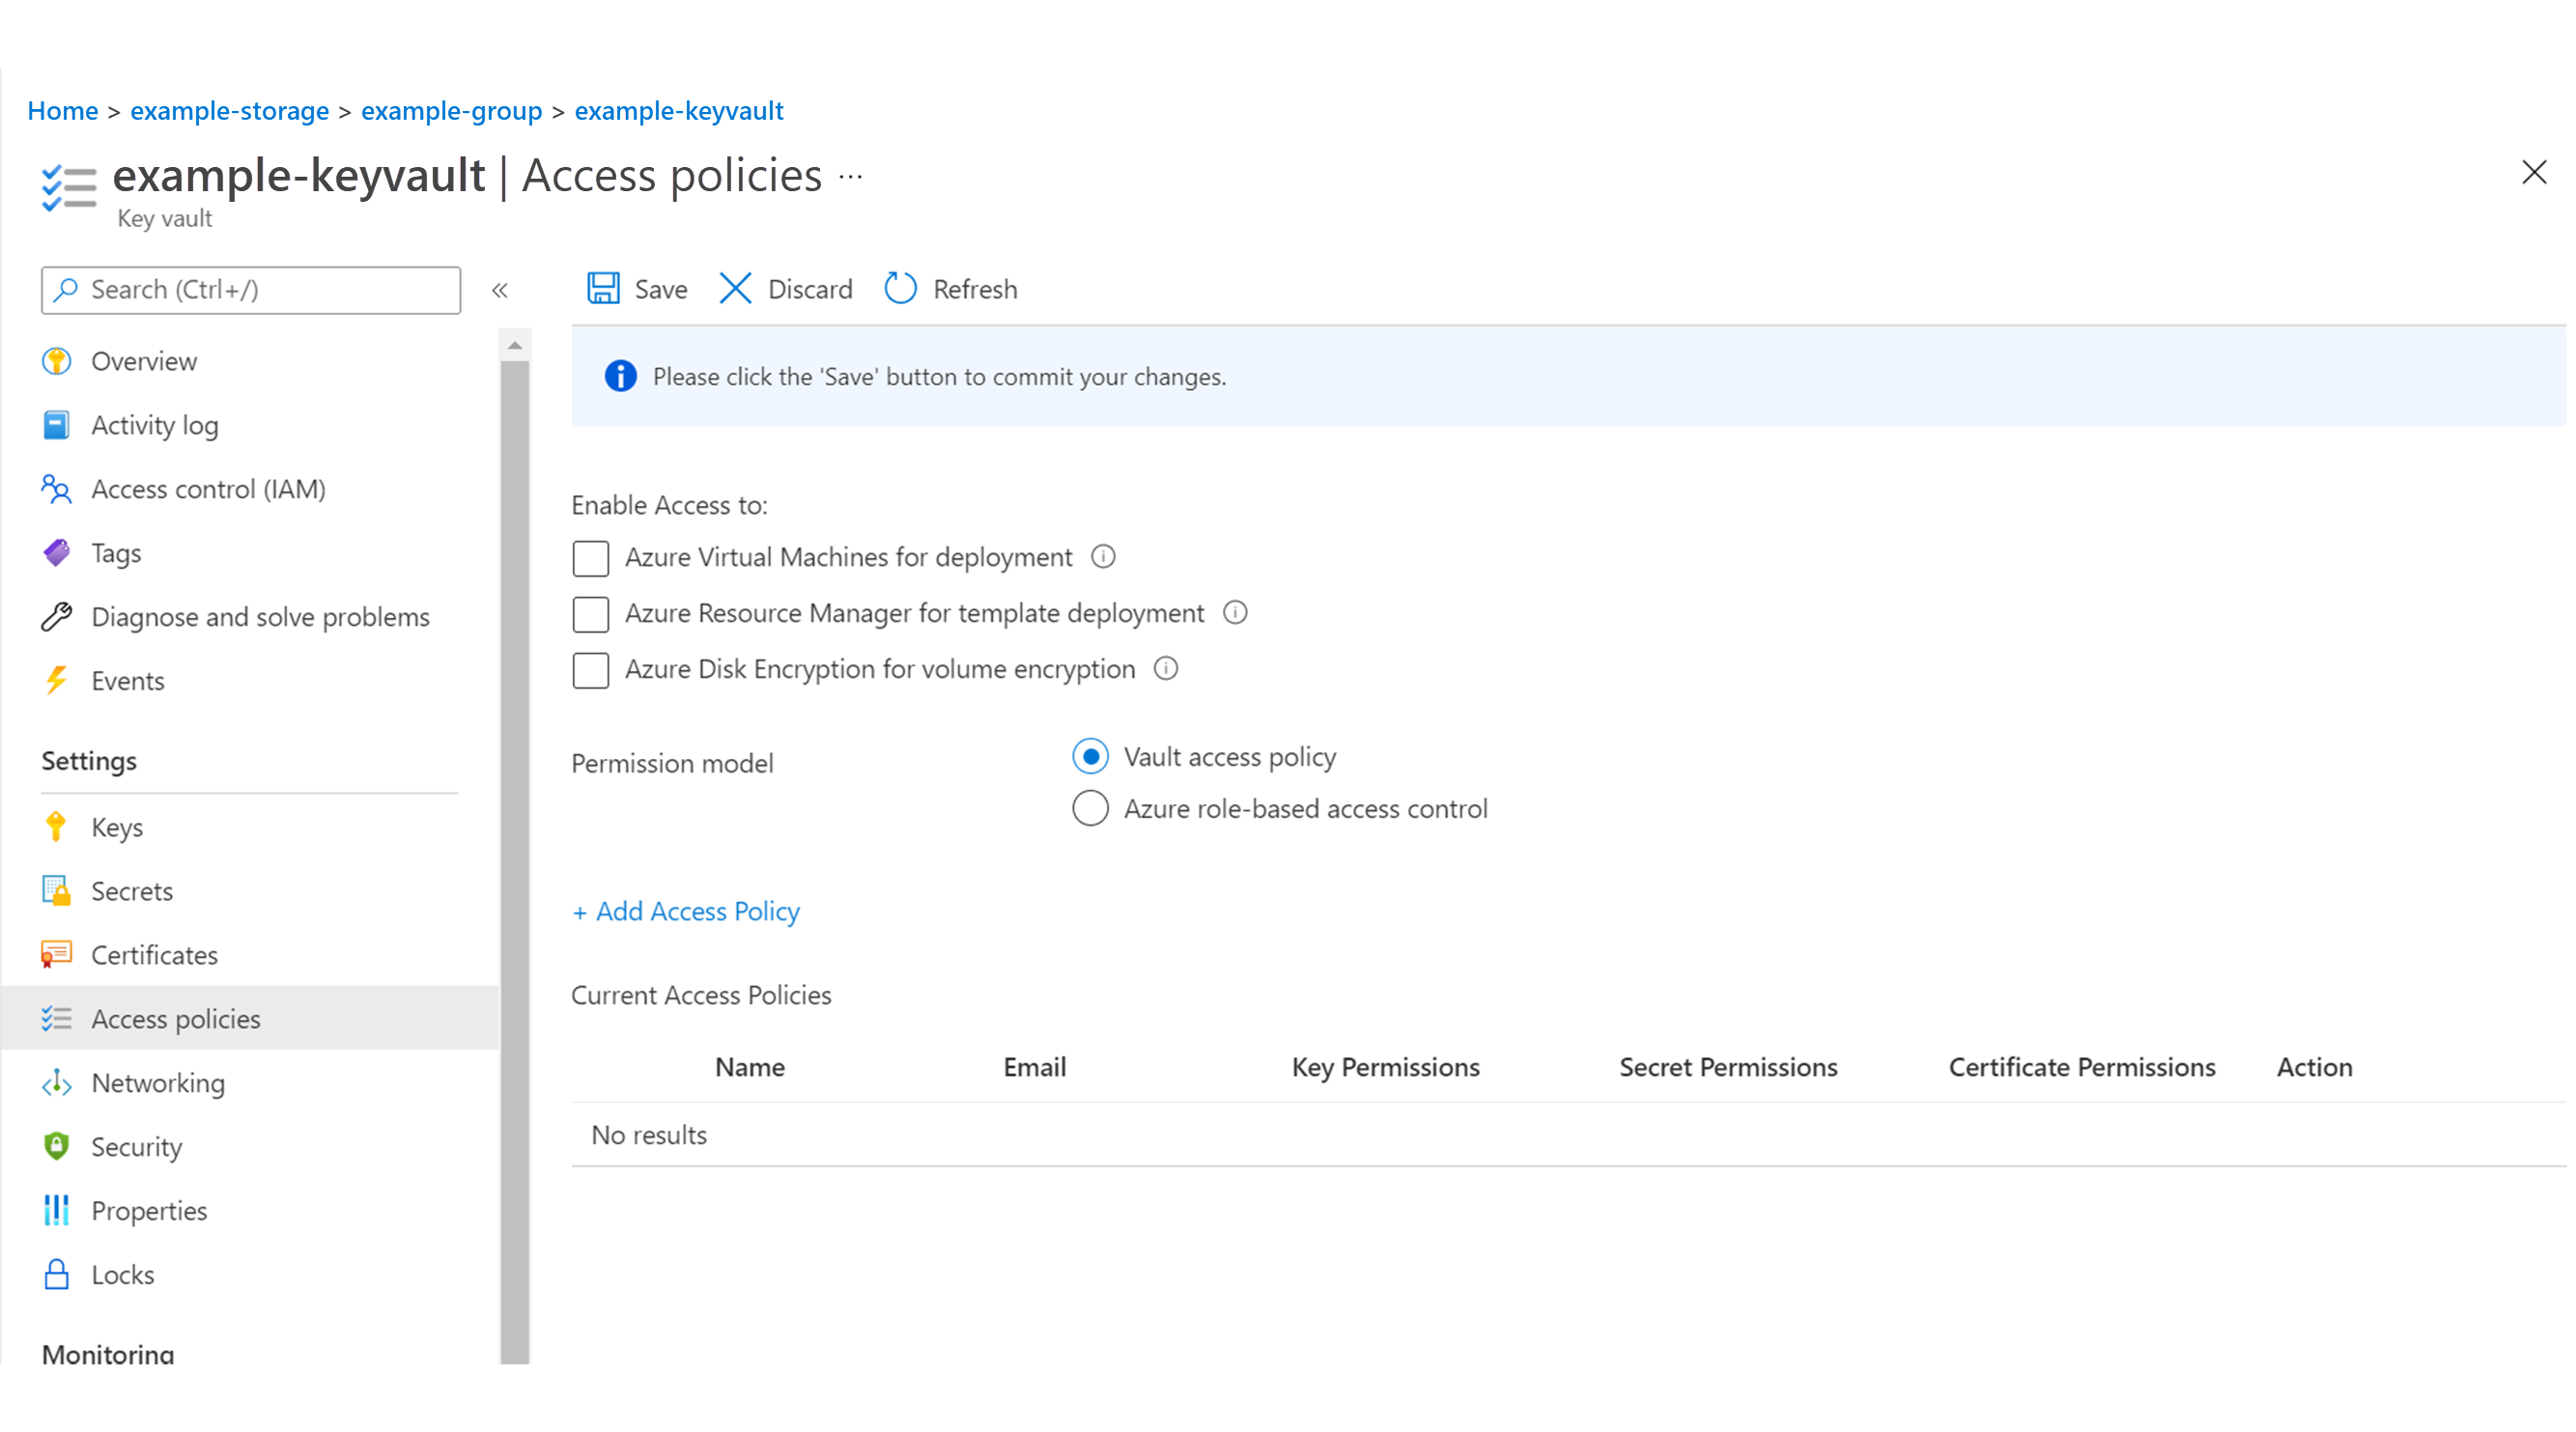
- Select + Add access policy in the center of the screen. The Add access policy screen appears.
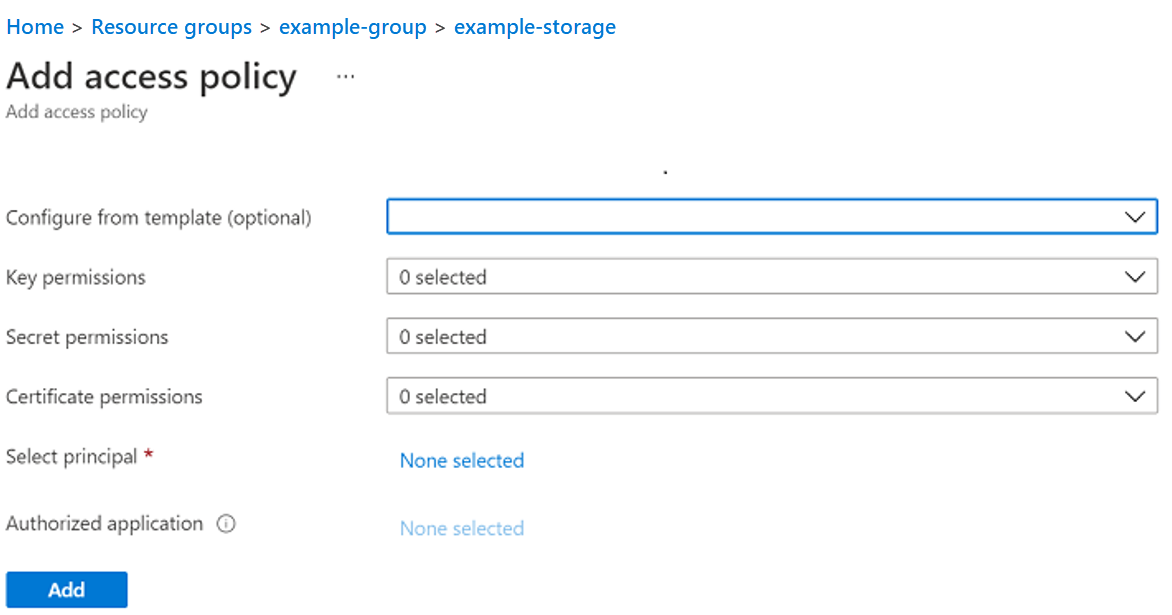
- Add your own account by setting values, as follows:
- From the Configure from template drop-down list, choose Key, Secret, & Certificate Management.
- From the Select principal field, search for your ID, and once it is displayed, select it. Your ID is displayed under the Selected items pane.
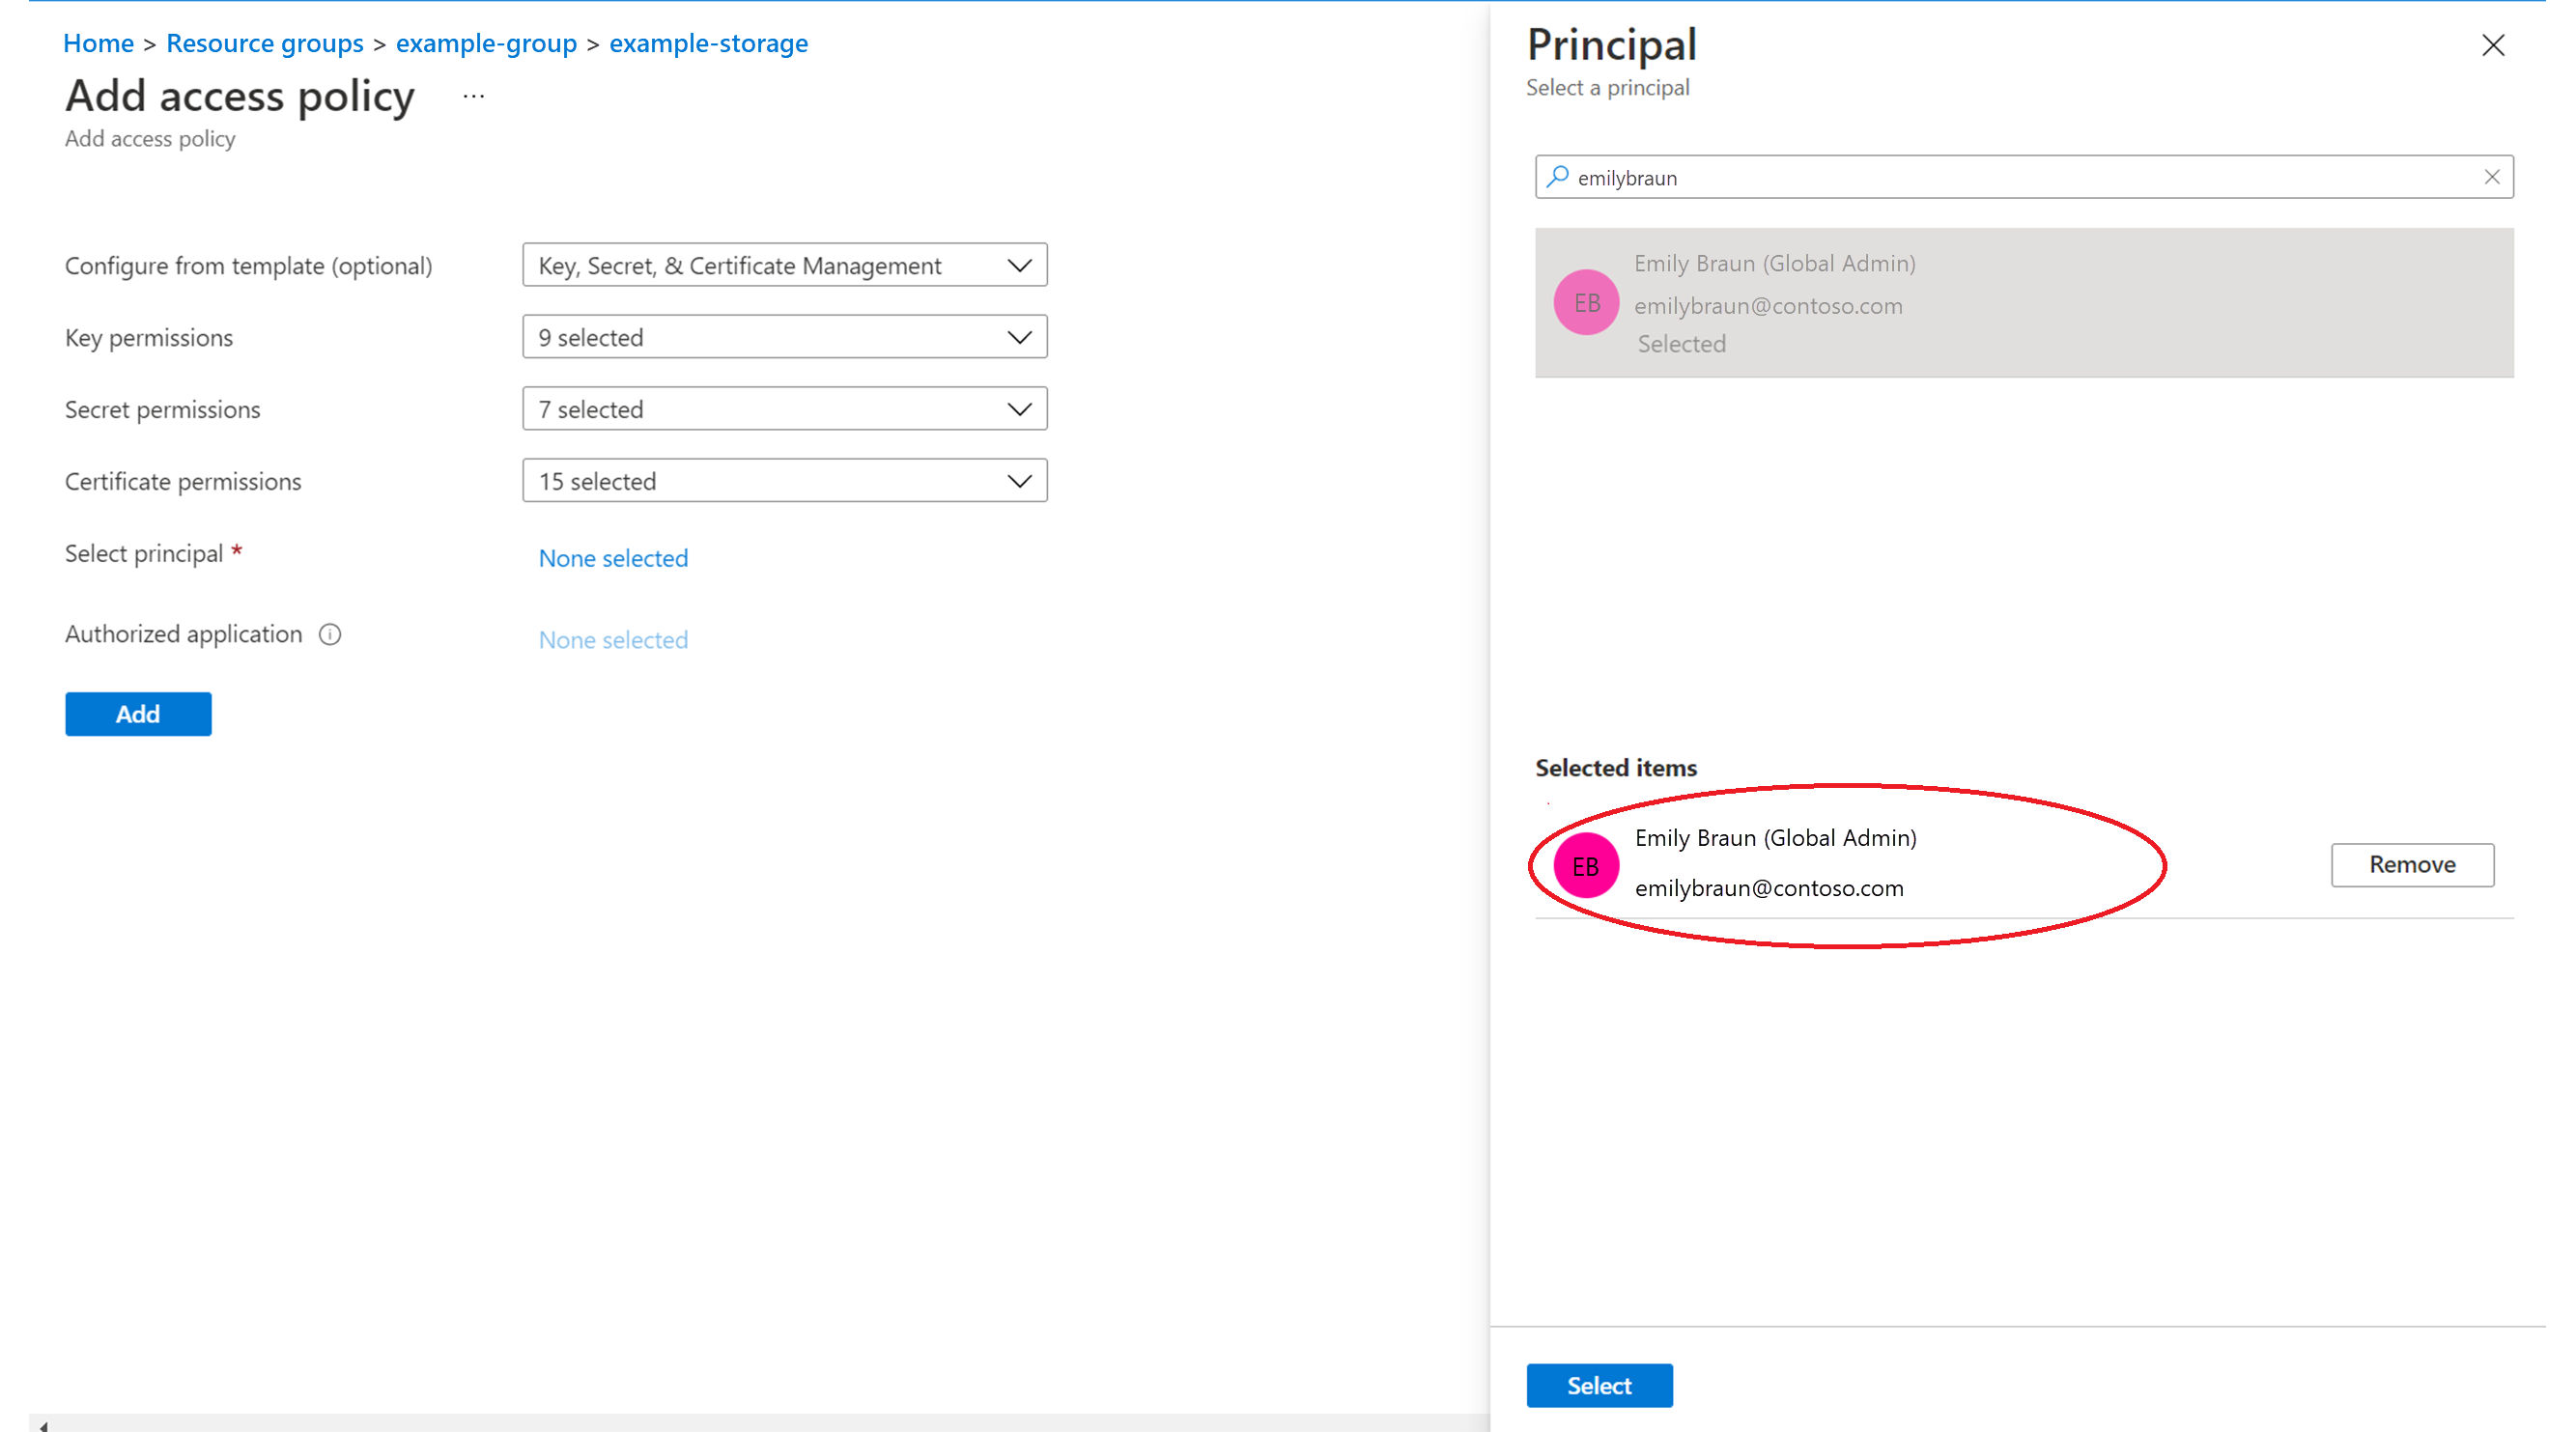
- Select Add.
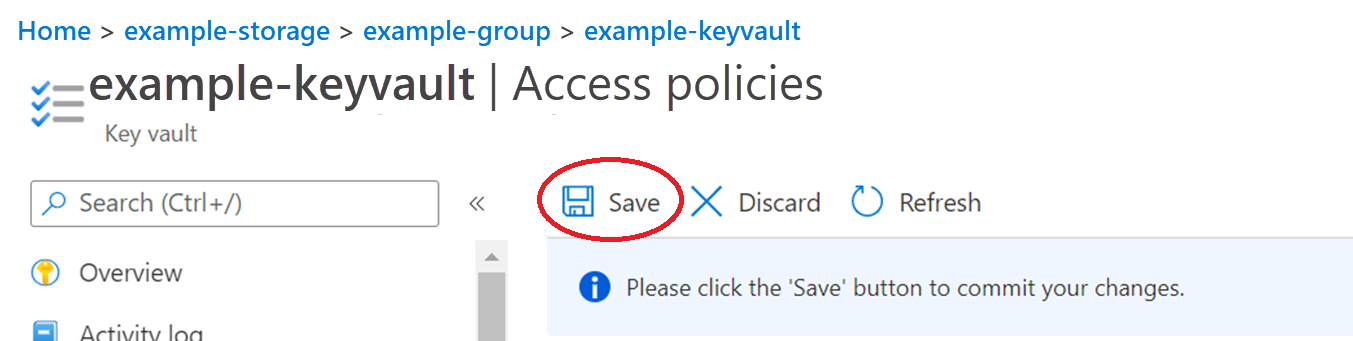
- Select Save in the upper-left of the screen.
Add the keyvault's secret permissions to the managed identity by performing the following steps:
- From the keyvault's properties screen (as the following shows), select Access policies in the left pane.
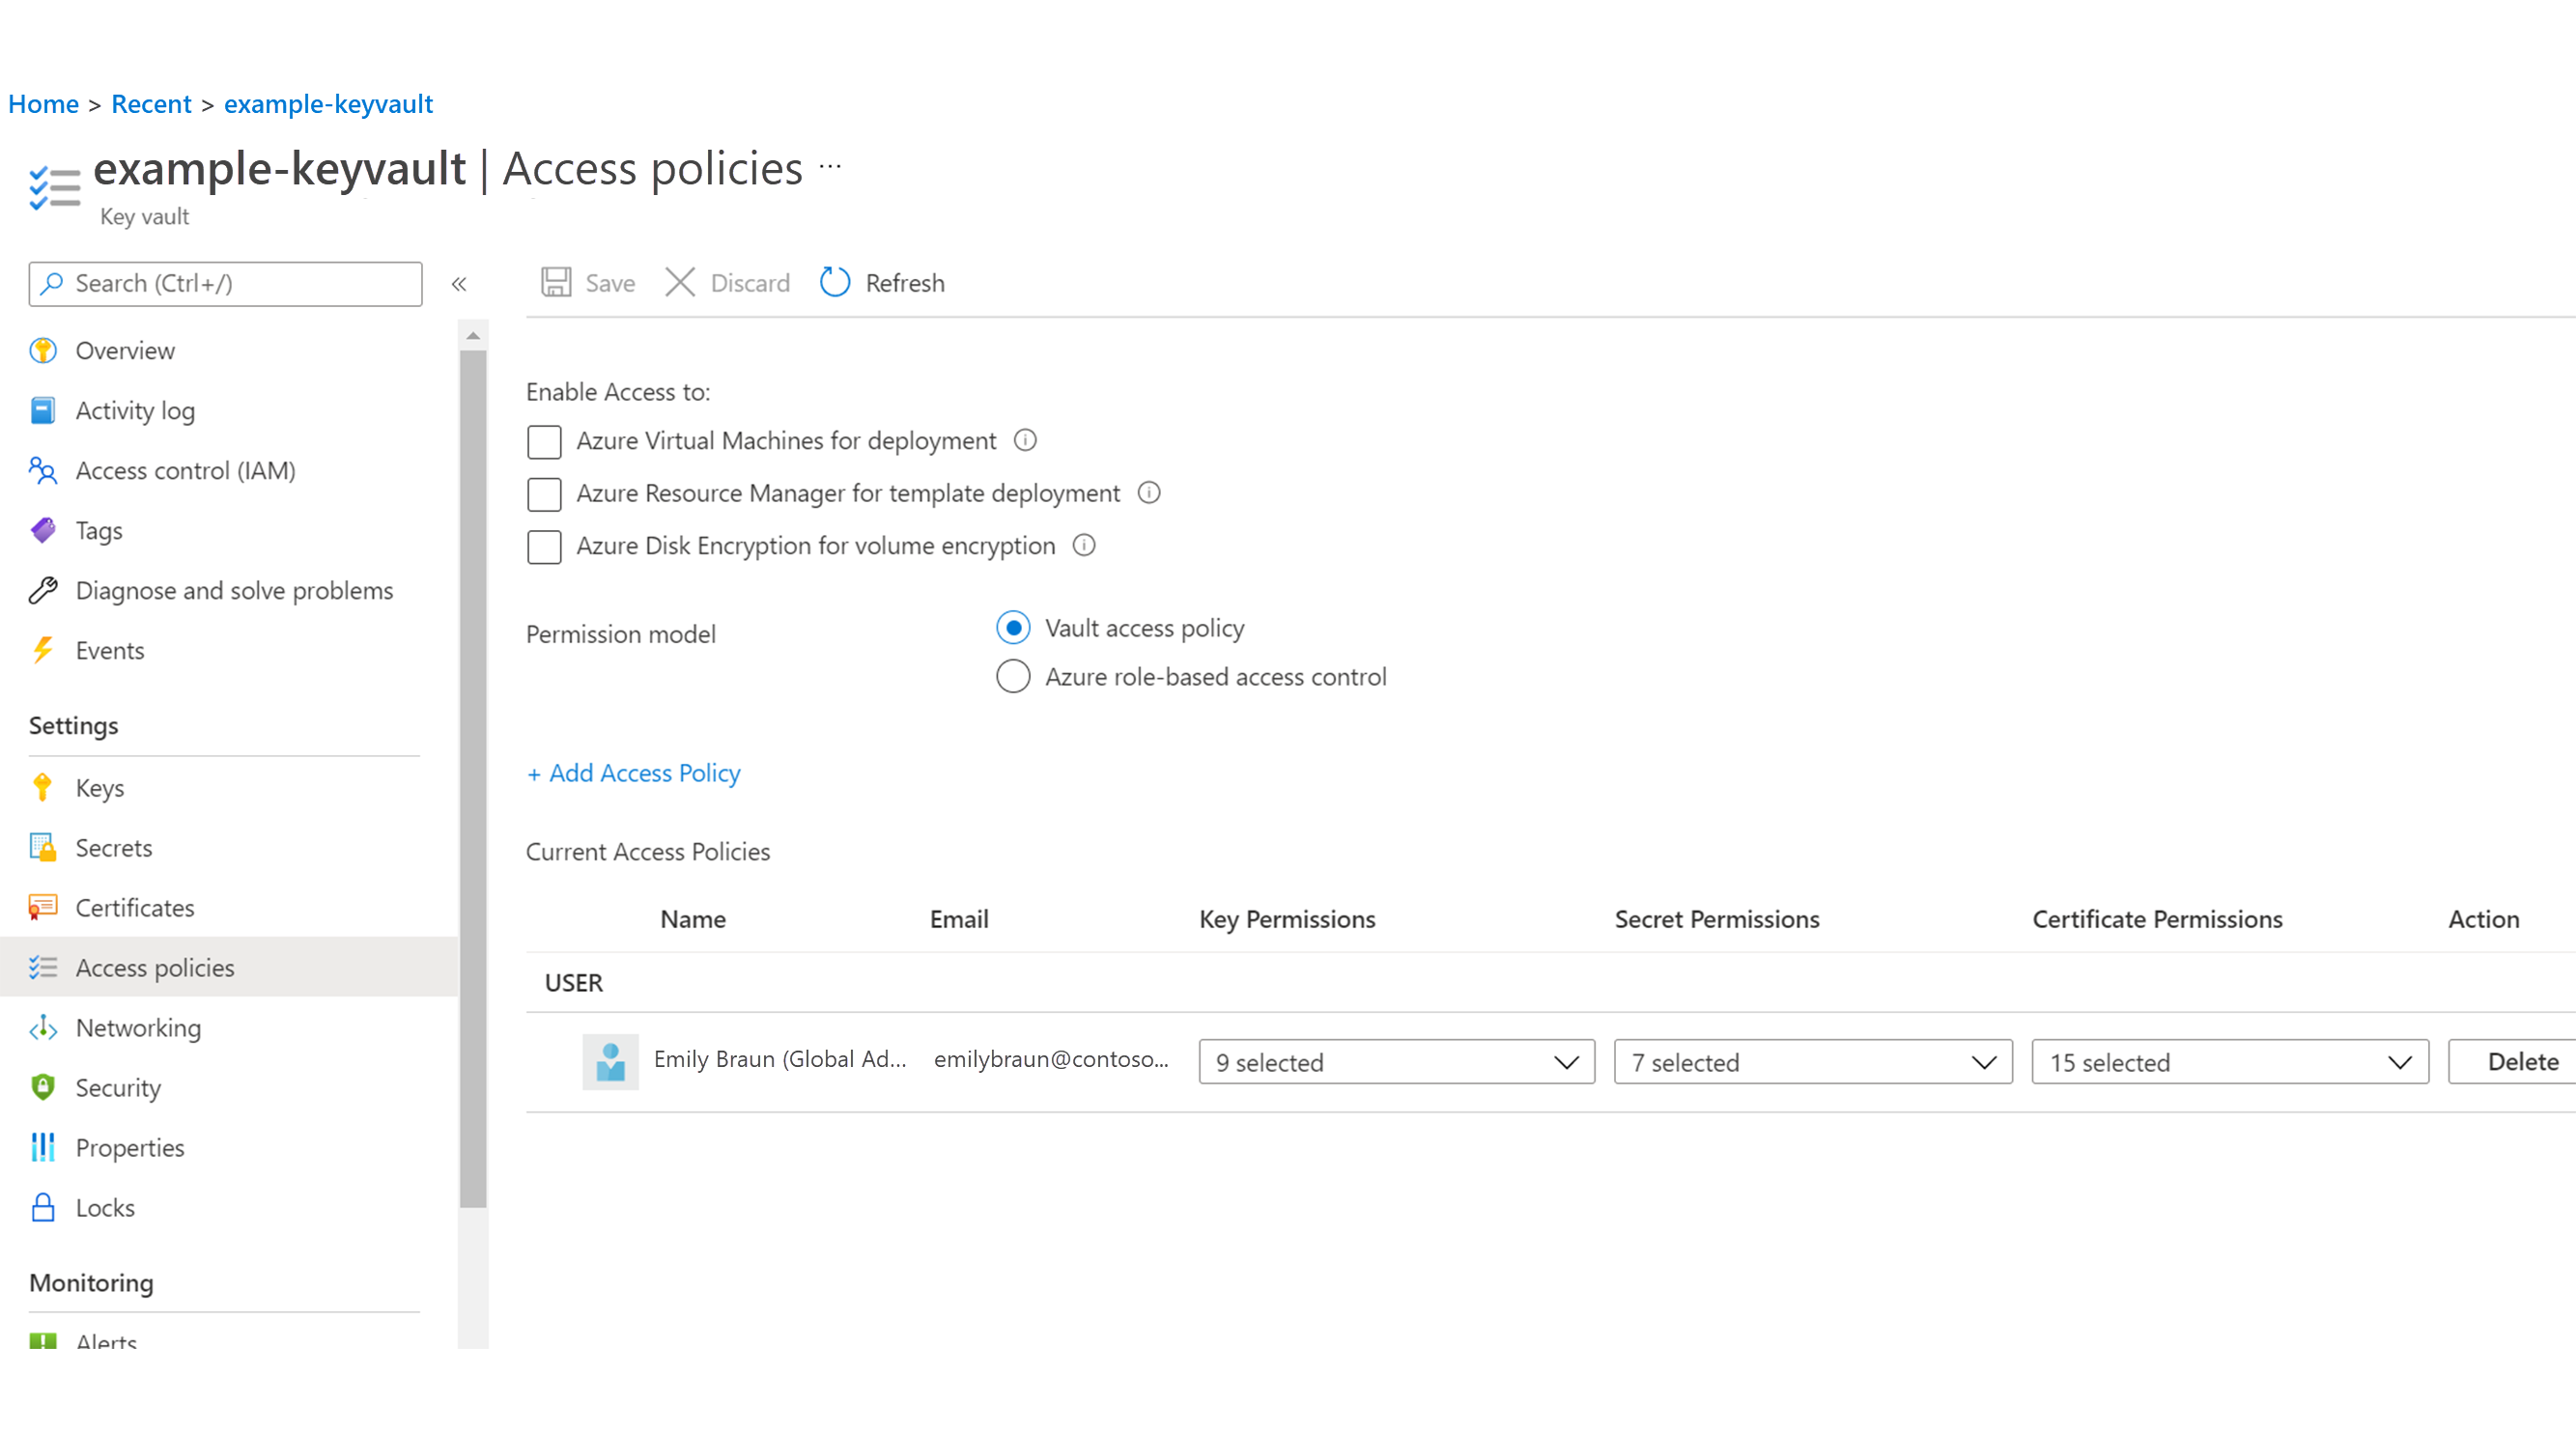
- Select + Add access policy. The Add access policy screen appears.
- From the Secret permissions drop-down list, choose Get and List.
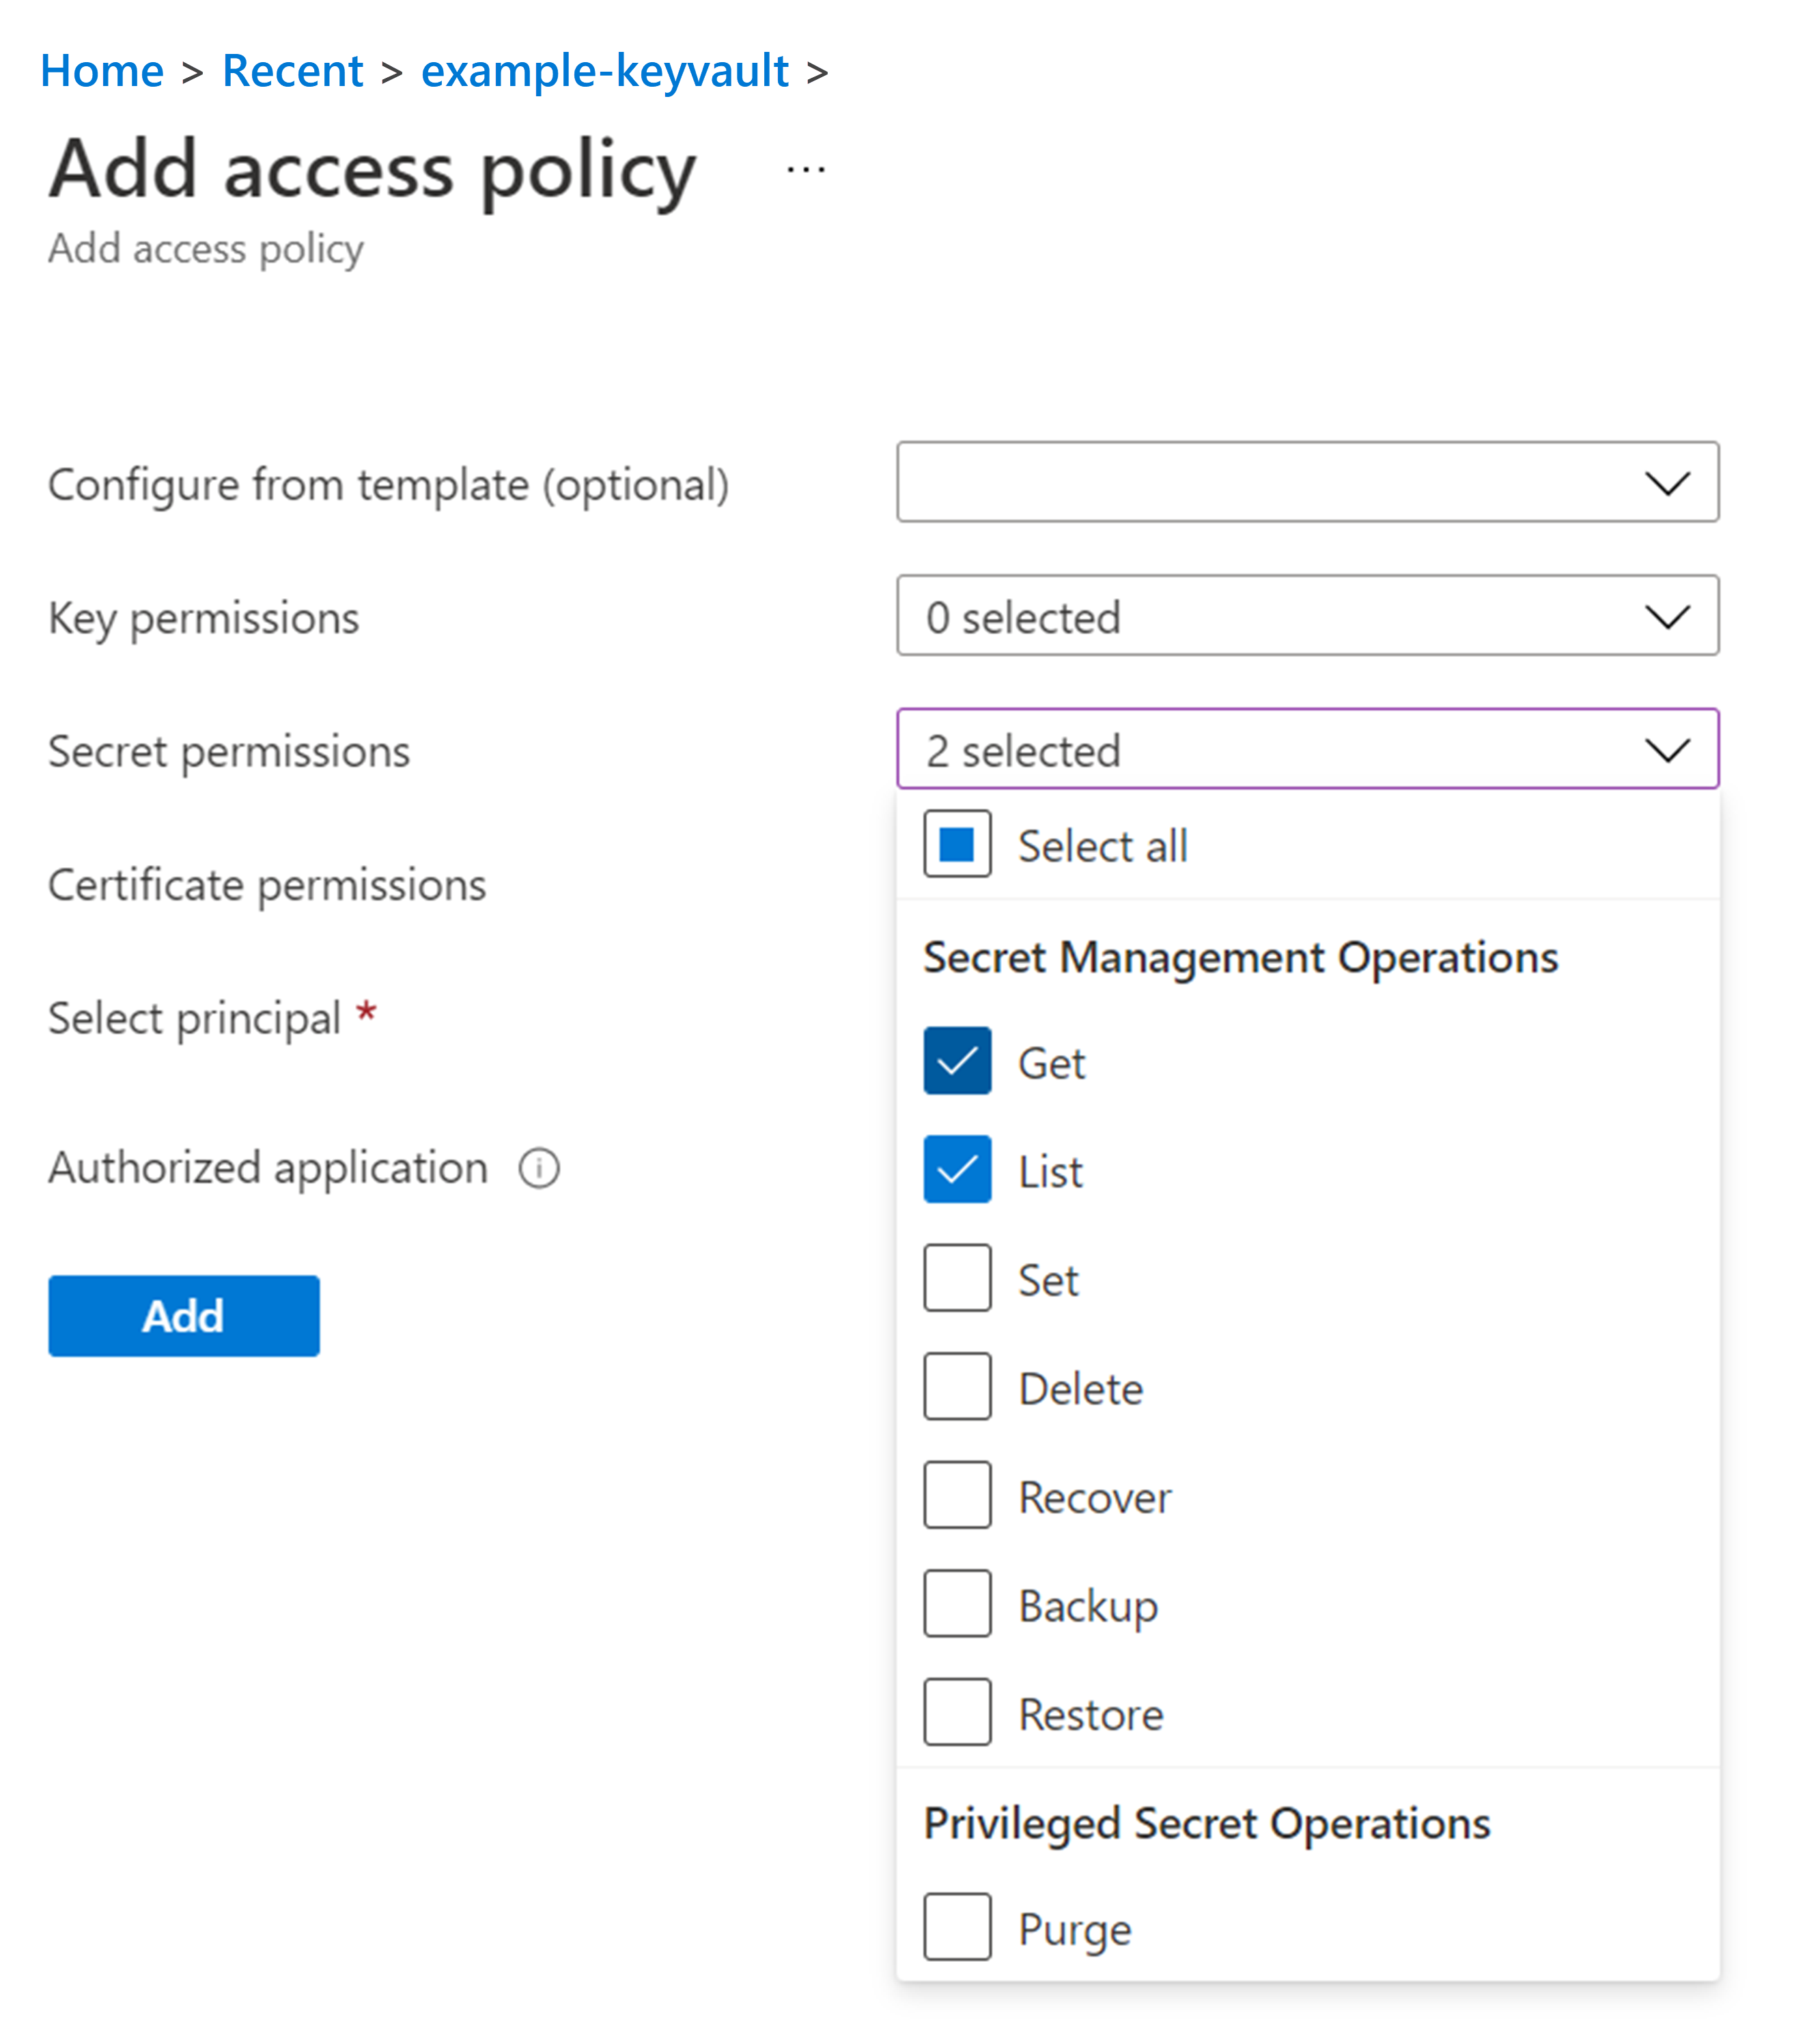
- From the Select principal field, search for your ID, and once it is displayed, select it. Your ID is displayed under the Selected items pane.
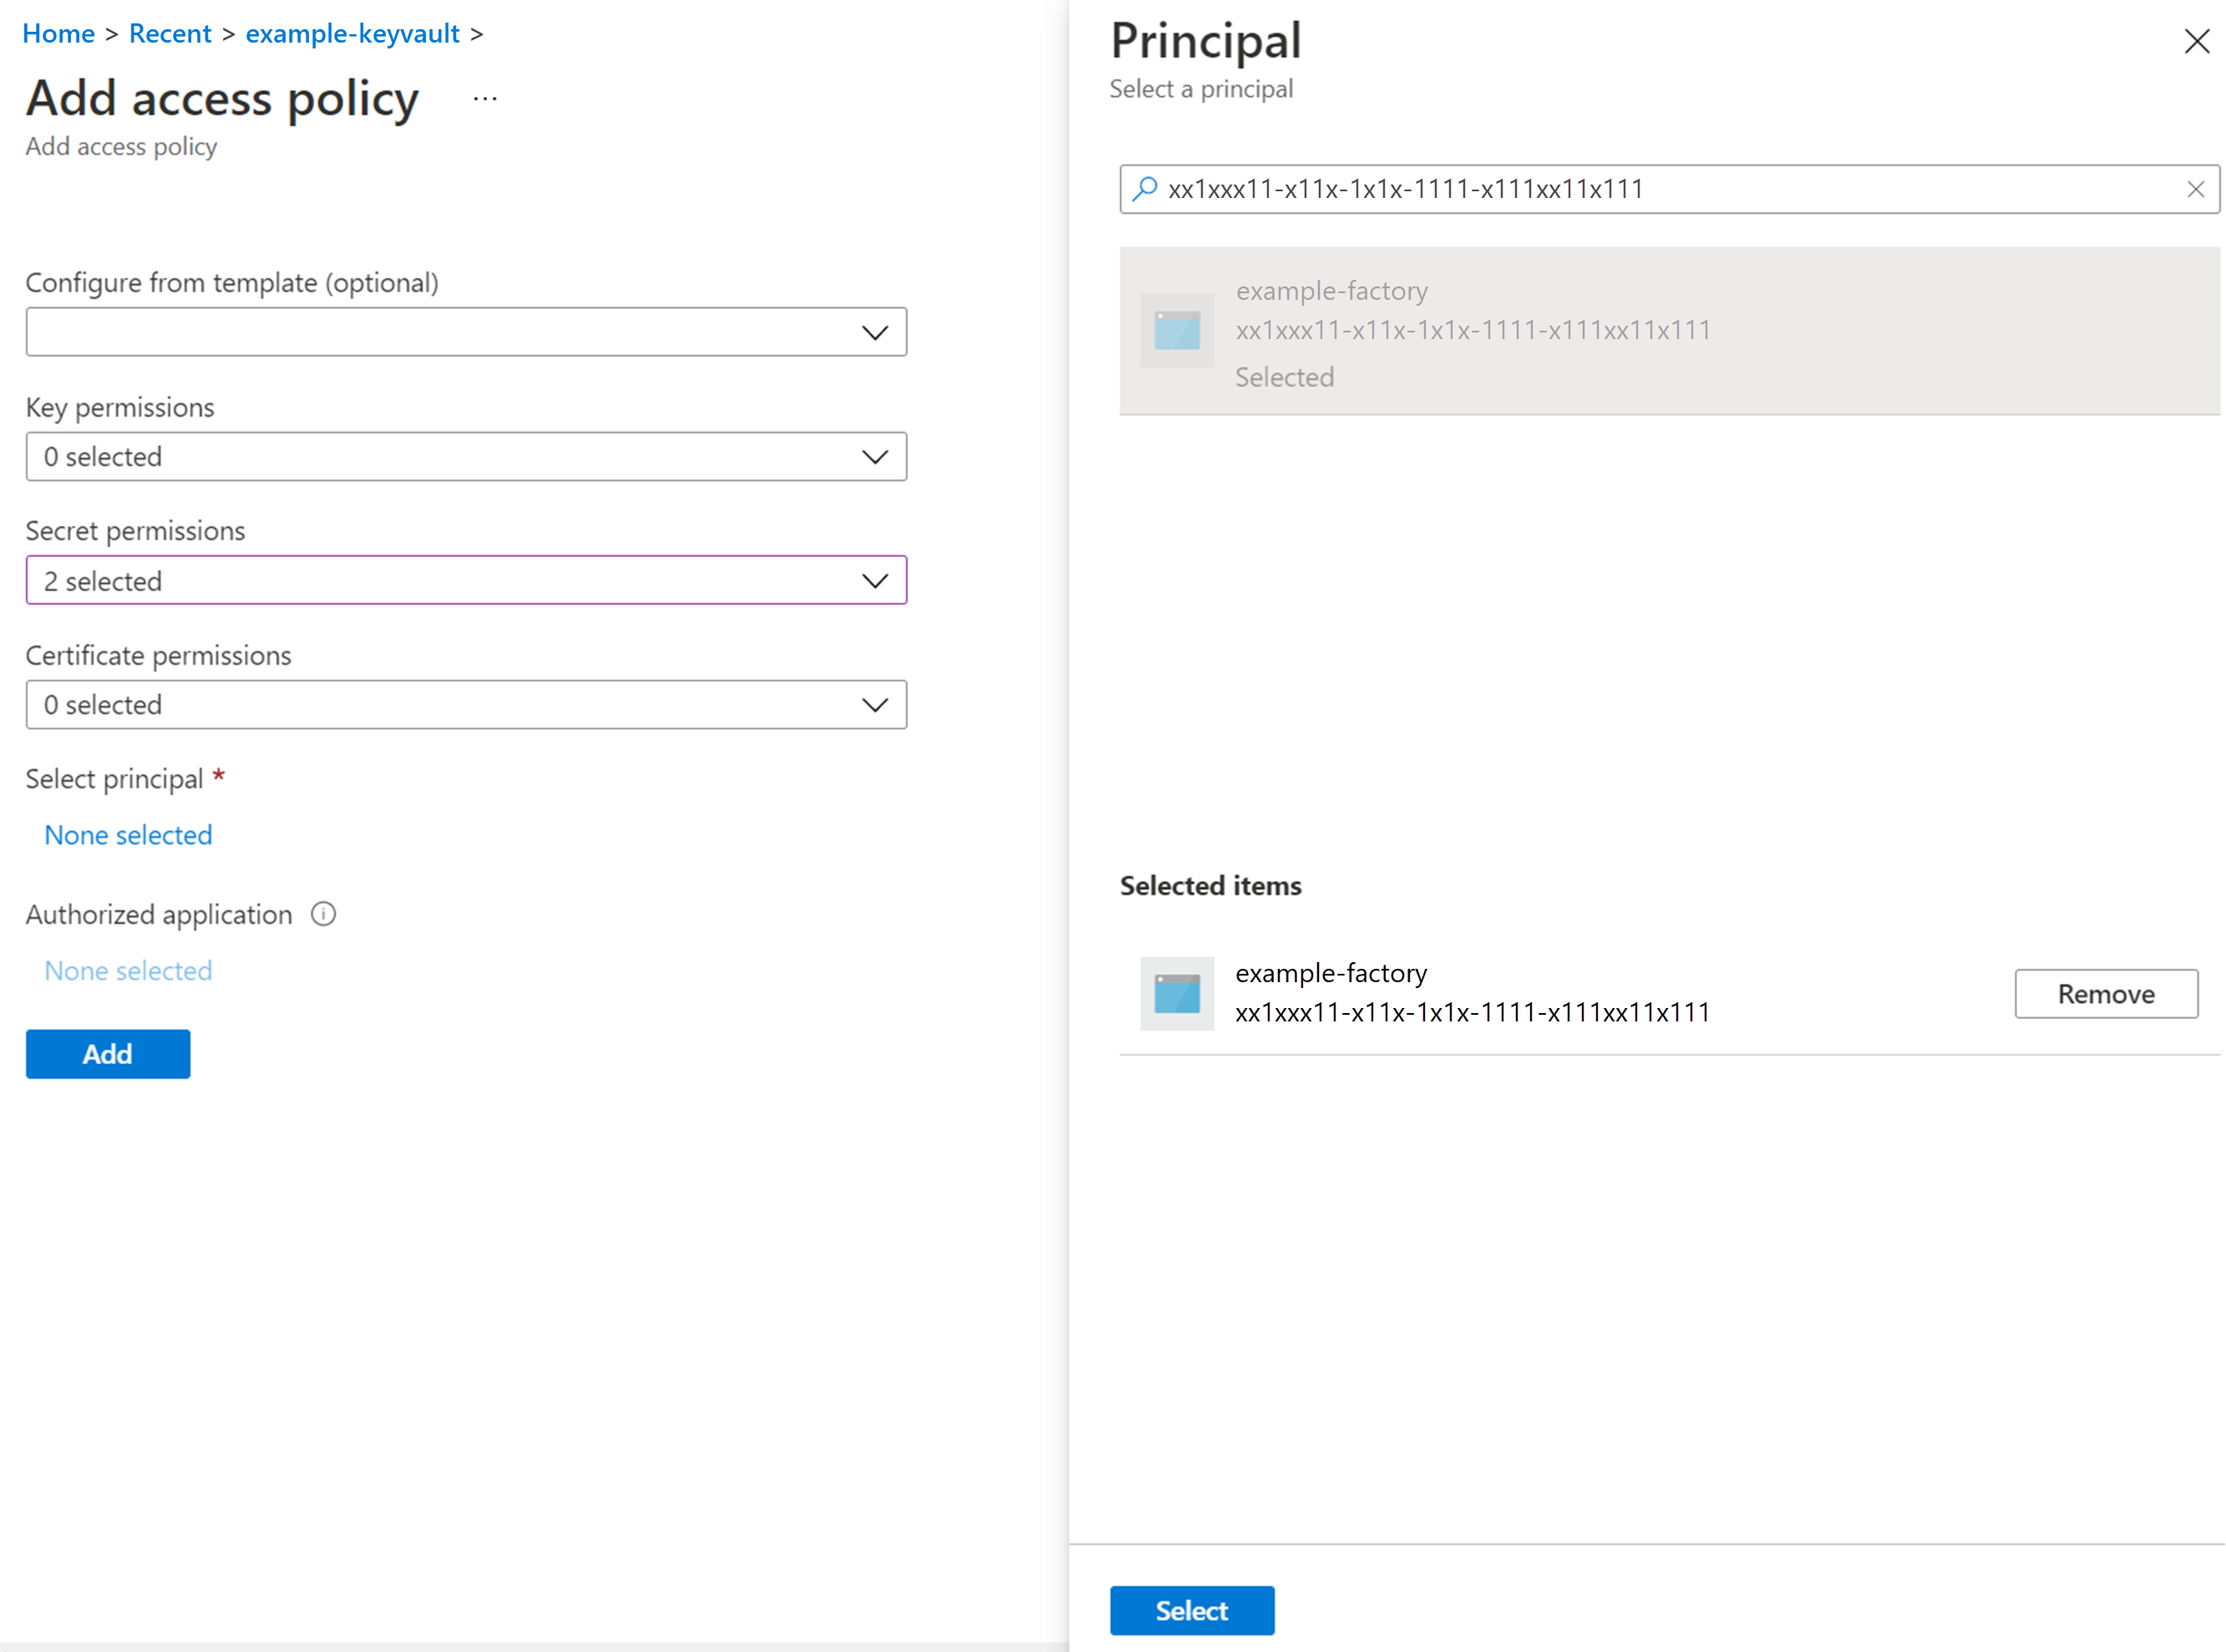
- Select Add.
- Select Save in the upper-left of the screen.
- From the keyvault's properties screen (as the following shows), select Access policies in the left pane.
Grant Storage Account permissions to the Data Factory Managed Service Identity.
- Launch the resource group. The screen displaying details of the chosen resource group appears.
- Launch the storage account. The screen displaying details of the chosen storage account appears.
- Select Access Control (IAM) in the left pane.
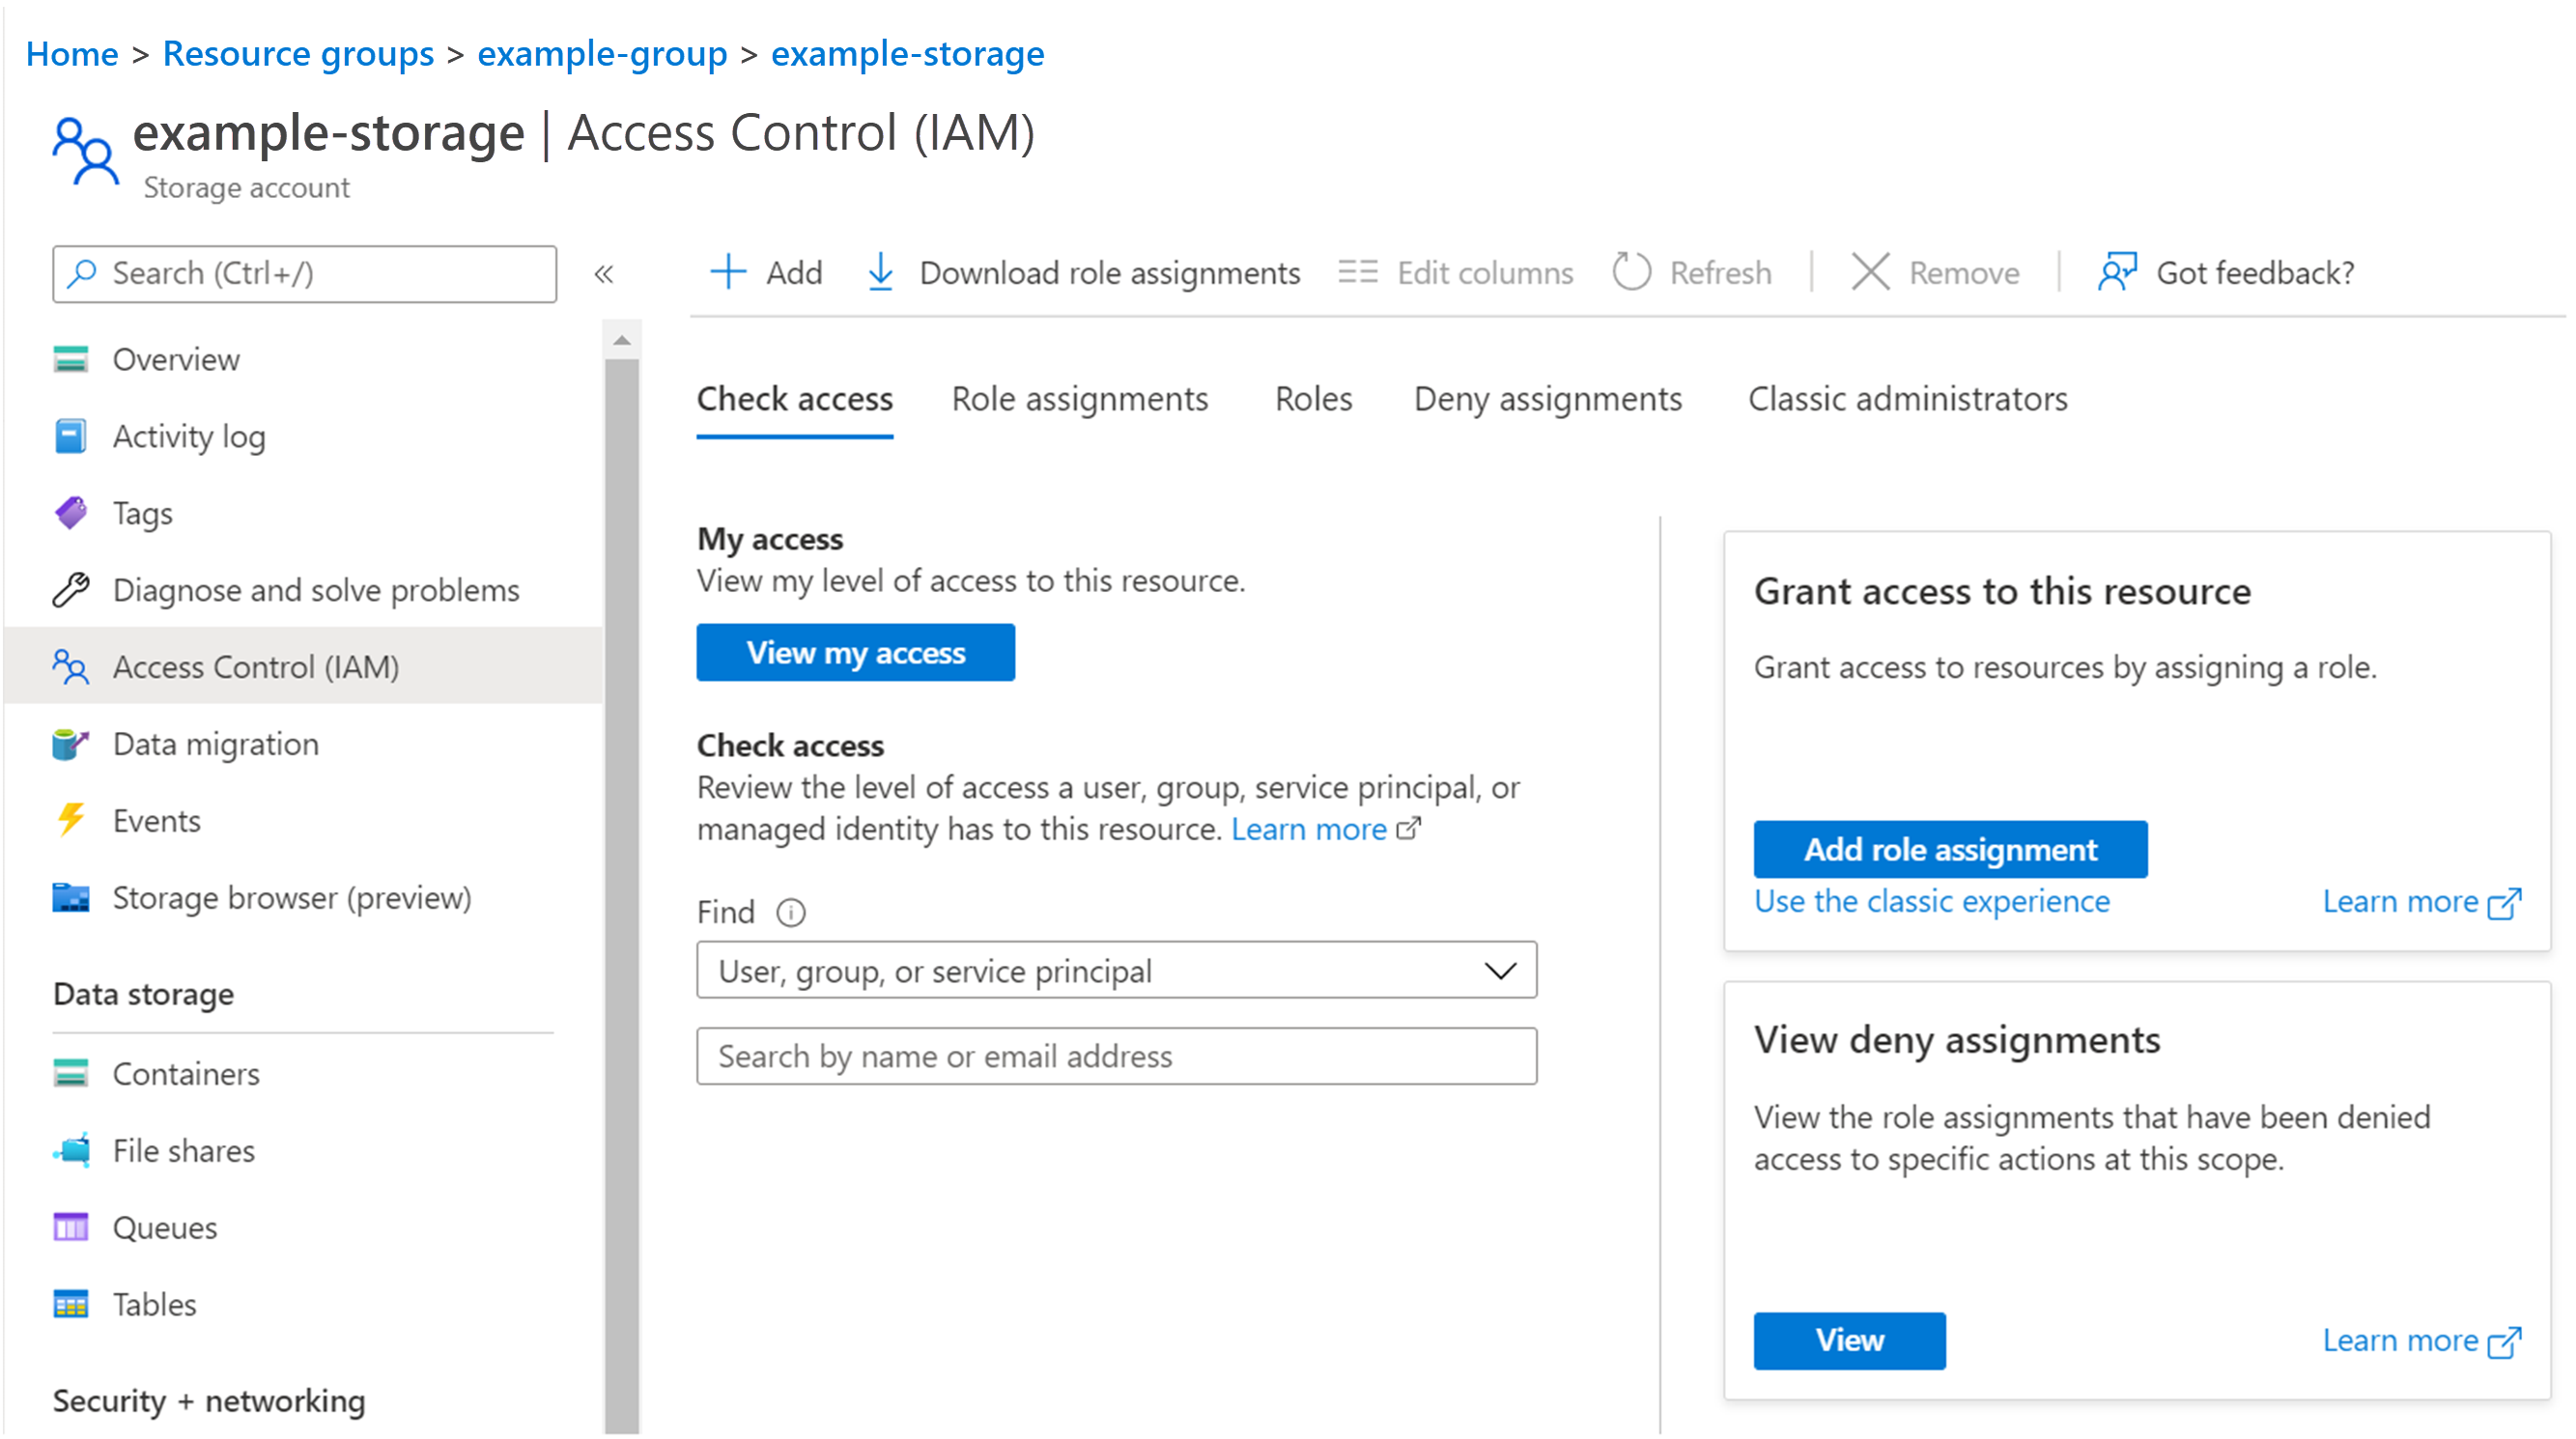
- Select the Role assignments tab, as shown.
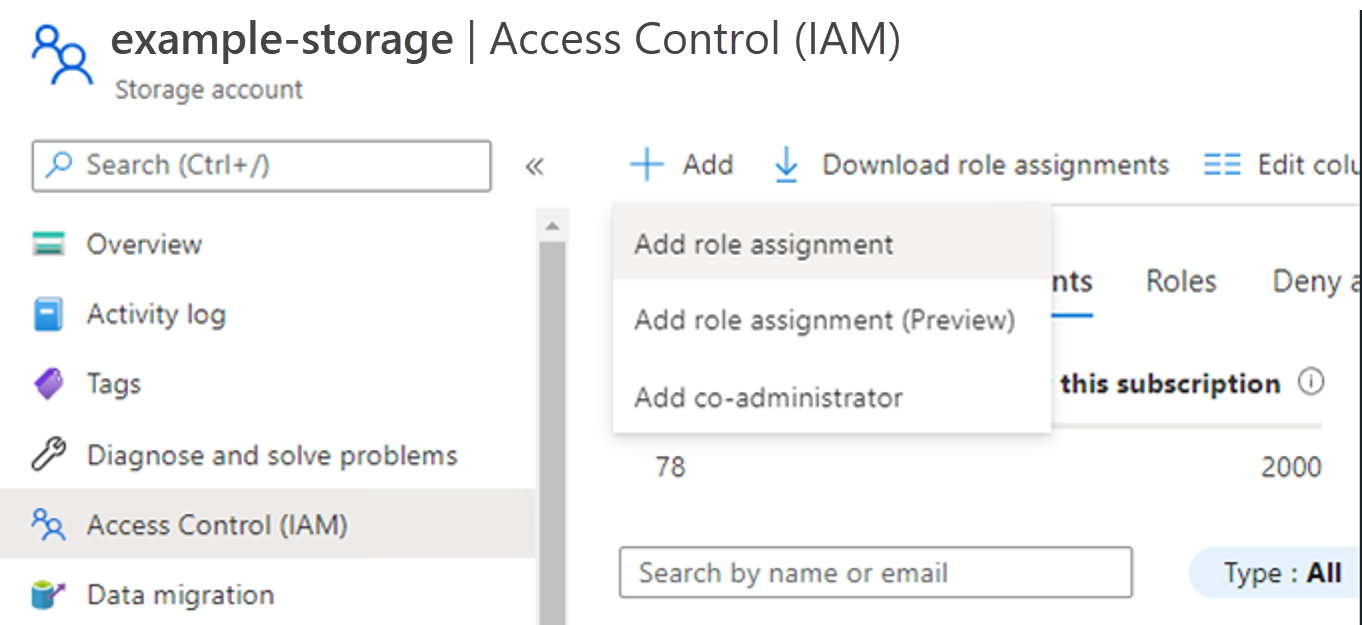
- Select + Add and select Add role assignment. The Add role assignment screen appears.
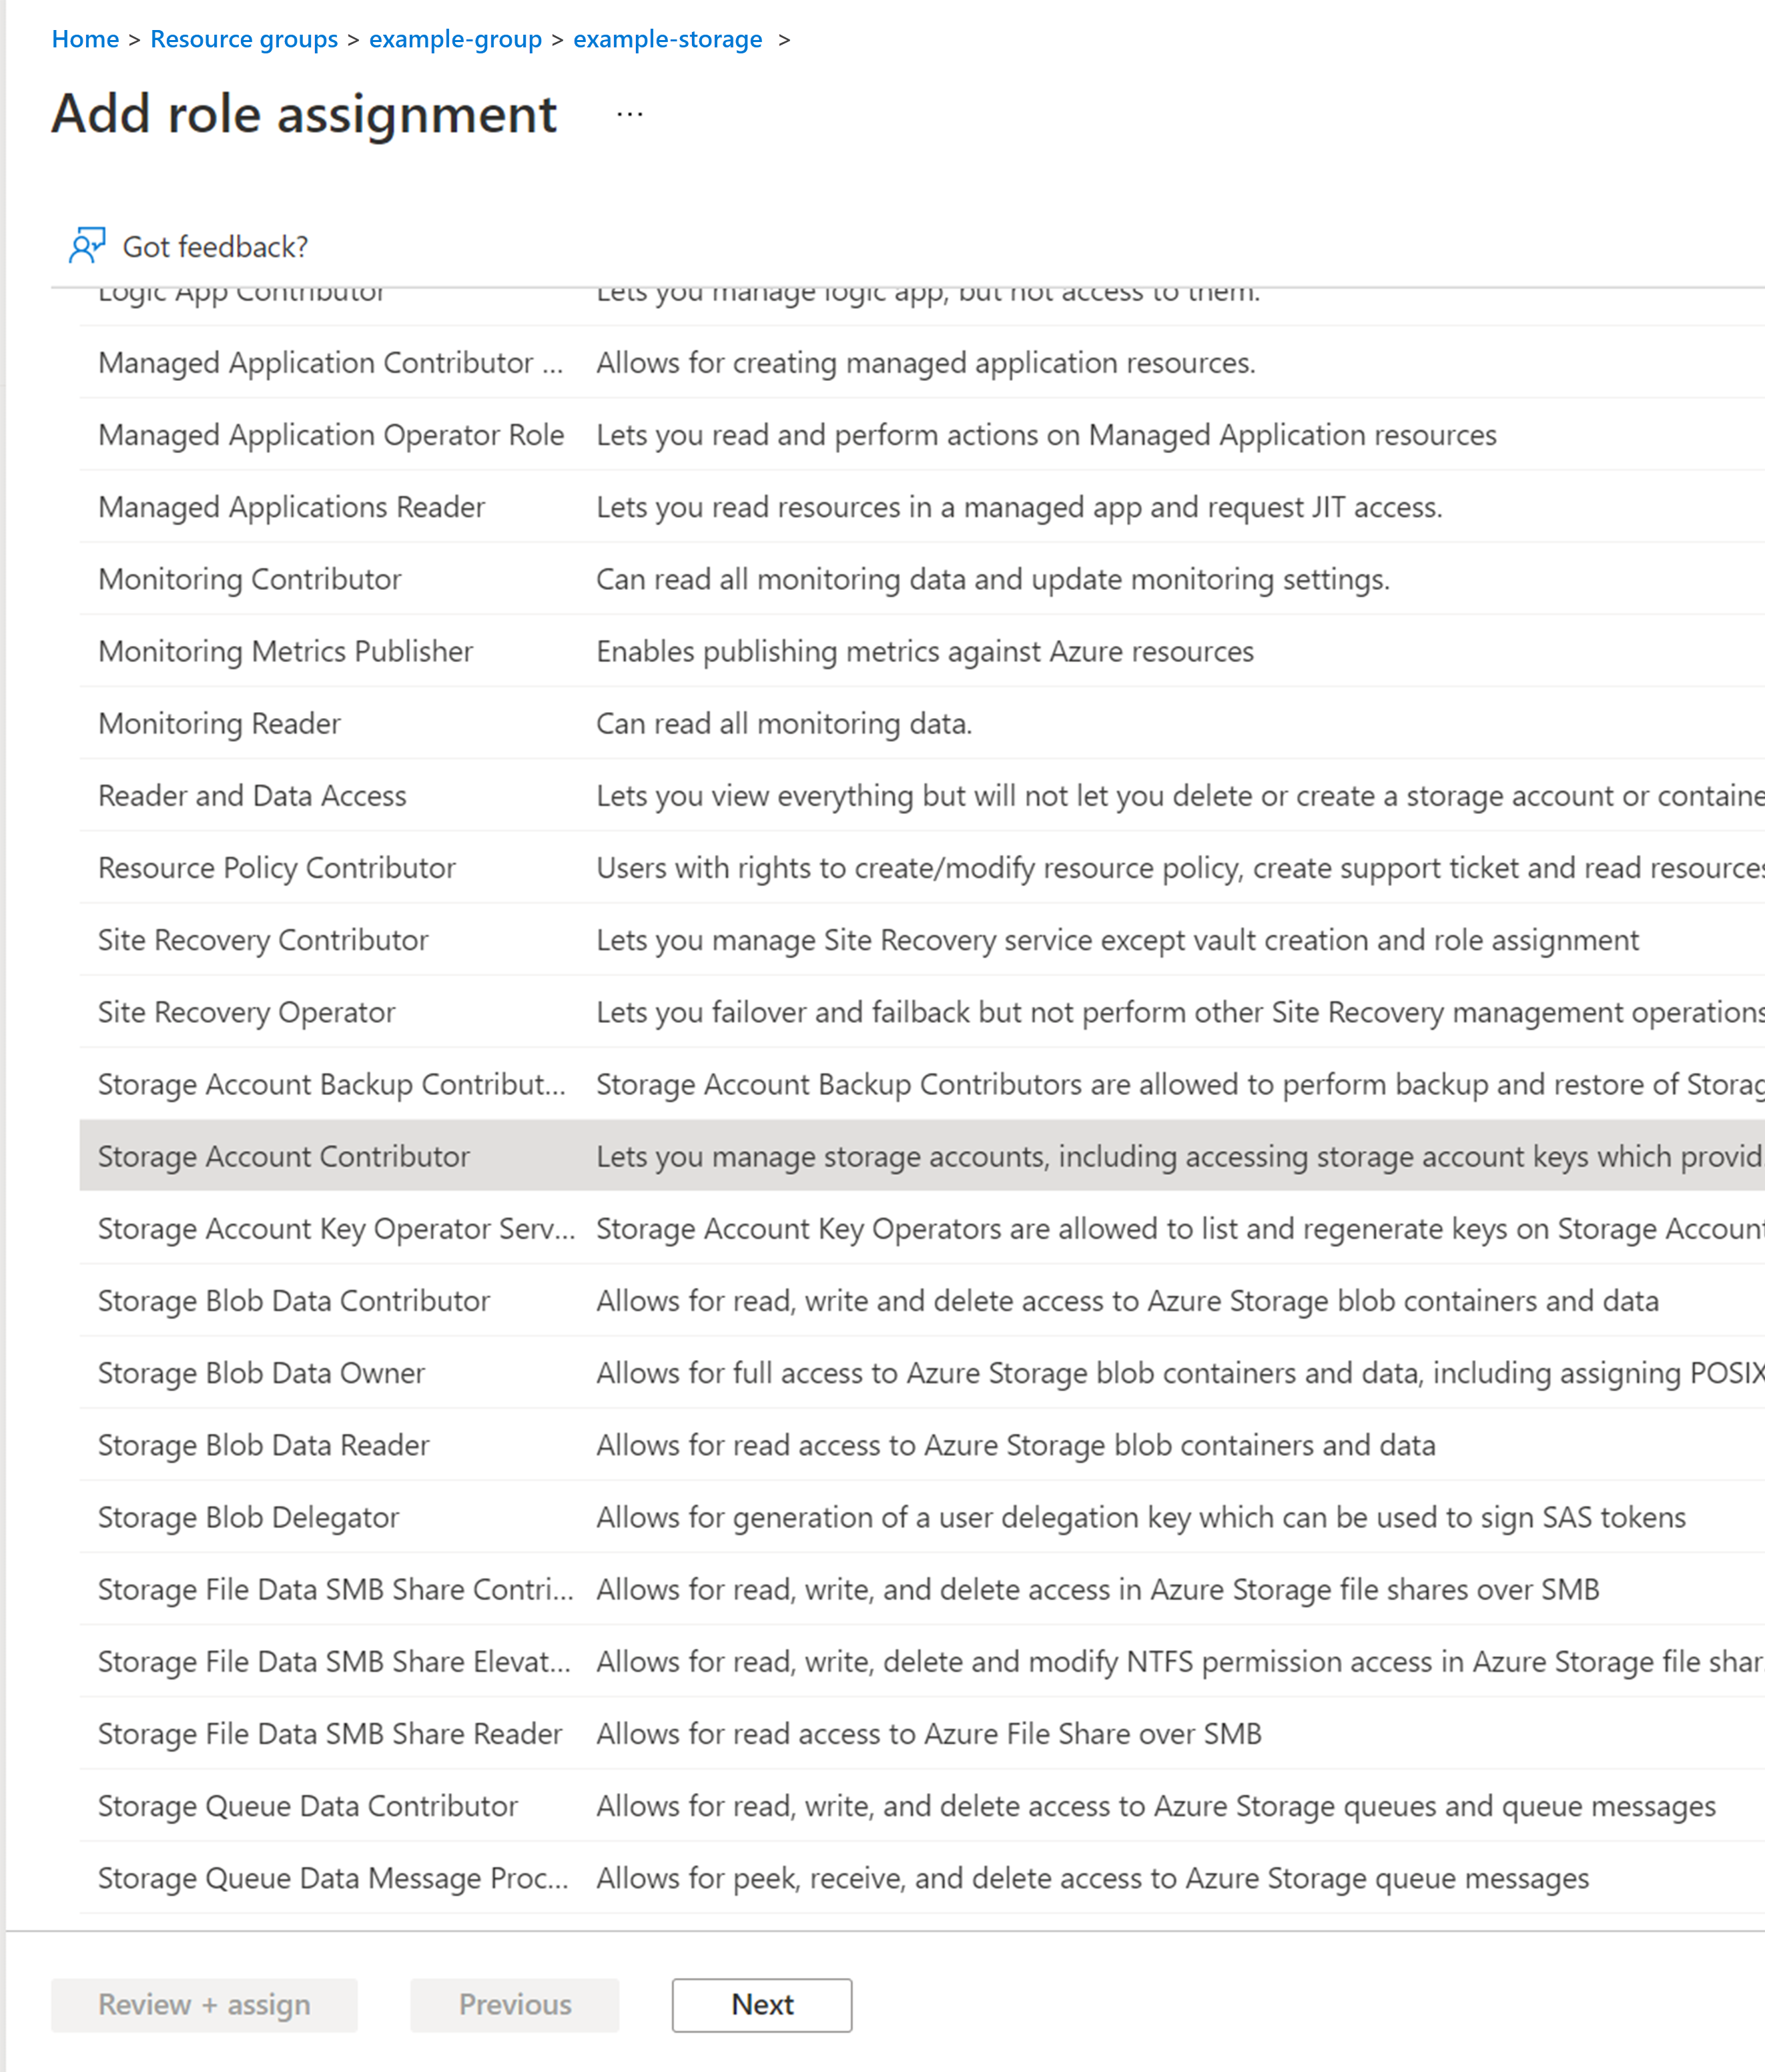
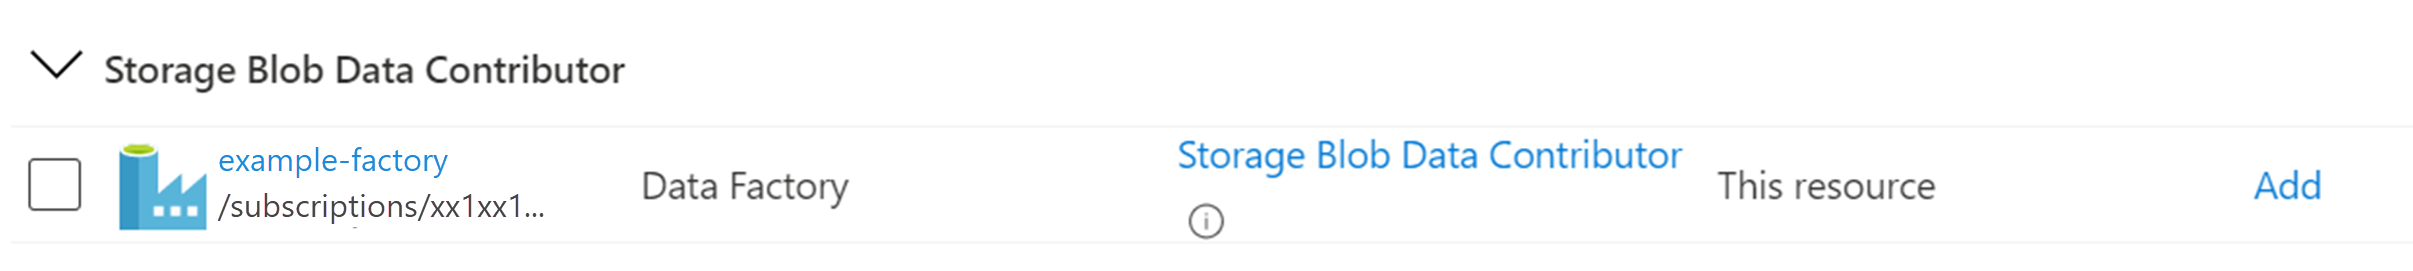
- Select Storage Blob Data Contributor, and select Next.
- Select the Members tab, and under Assign access to, choose the Managed identity radio button.
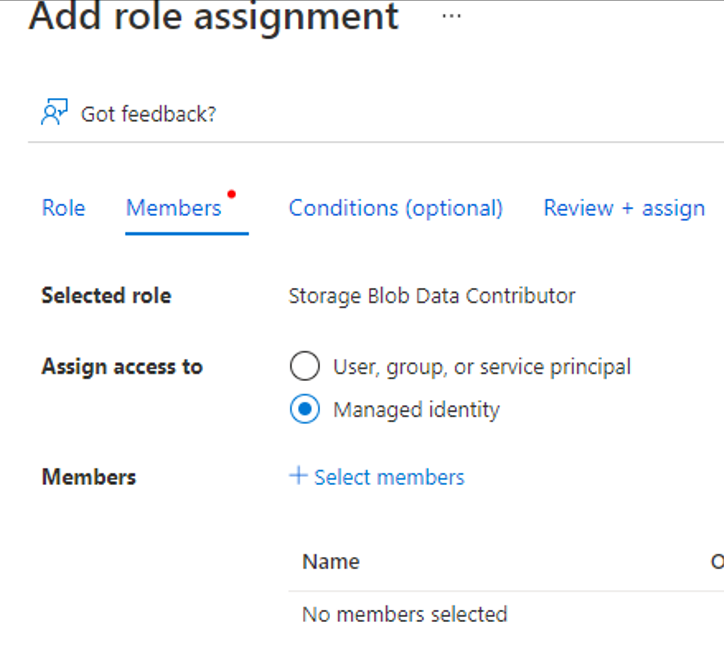
- Select + Select members in the center of the screen. The Select managed identities screen appears.
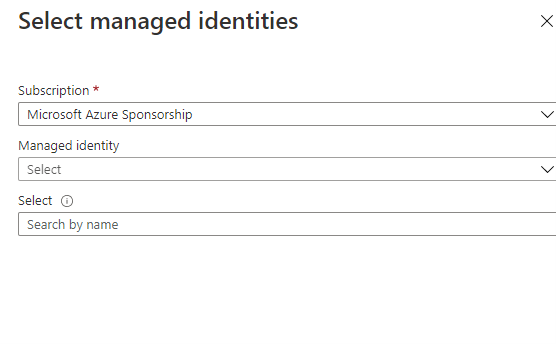
- From the Managed identity drop-down list, choose Data factory (V2).
- Search for the Data factory name you defined in Data pipeline - Automated step 2h from the Select field.
- Select the Select option. The Add role assignment screen appears.
- Select the Review + assign tab, and select Review + assign at the bottom-left of the screen.
- Refresh the browser to view the Role assignments screen again, in which you can view the Data factory application you have just added.
Create a file named ODatasources.txt.
Create a
.txtfile with the following comma-delimited schema for each OData source and the tenant reference information that will be stored in keyvault.Column name Description ODataurl OData URL from viva insights query tenantid Name of the secret in the Keyvault for the TenantID (aka omstenantid, aad tenantid) aadresource The aadresource for the OData servicePrincipal Name of the secret in the Keyvault for the application ID that will be used to access the OData URL secretName Name of the secret in Keyvault for the secret for the application ID that will be used to access the OData URL path OData path of the OData URL fileName Pre-fix name of the file Note
The content in the
.txtfile will be a comma-delimited one. This content is built using the schema in the above table. This schema-based content is created for each OData source.
A sample of the
ODatasources.txtfile is shown in the following graphic. This file contains details of two tenants, who are each assigned two sets of OData URLs they can govern. Each OData URL for a tenant uses the keyvault secret created specifically for that tenant.
Generate the secrets in Key Vault by performing the following steps:
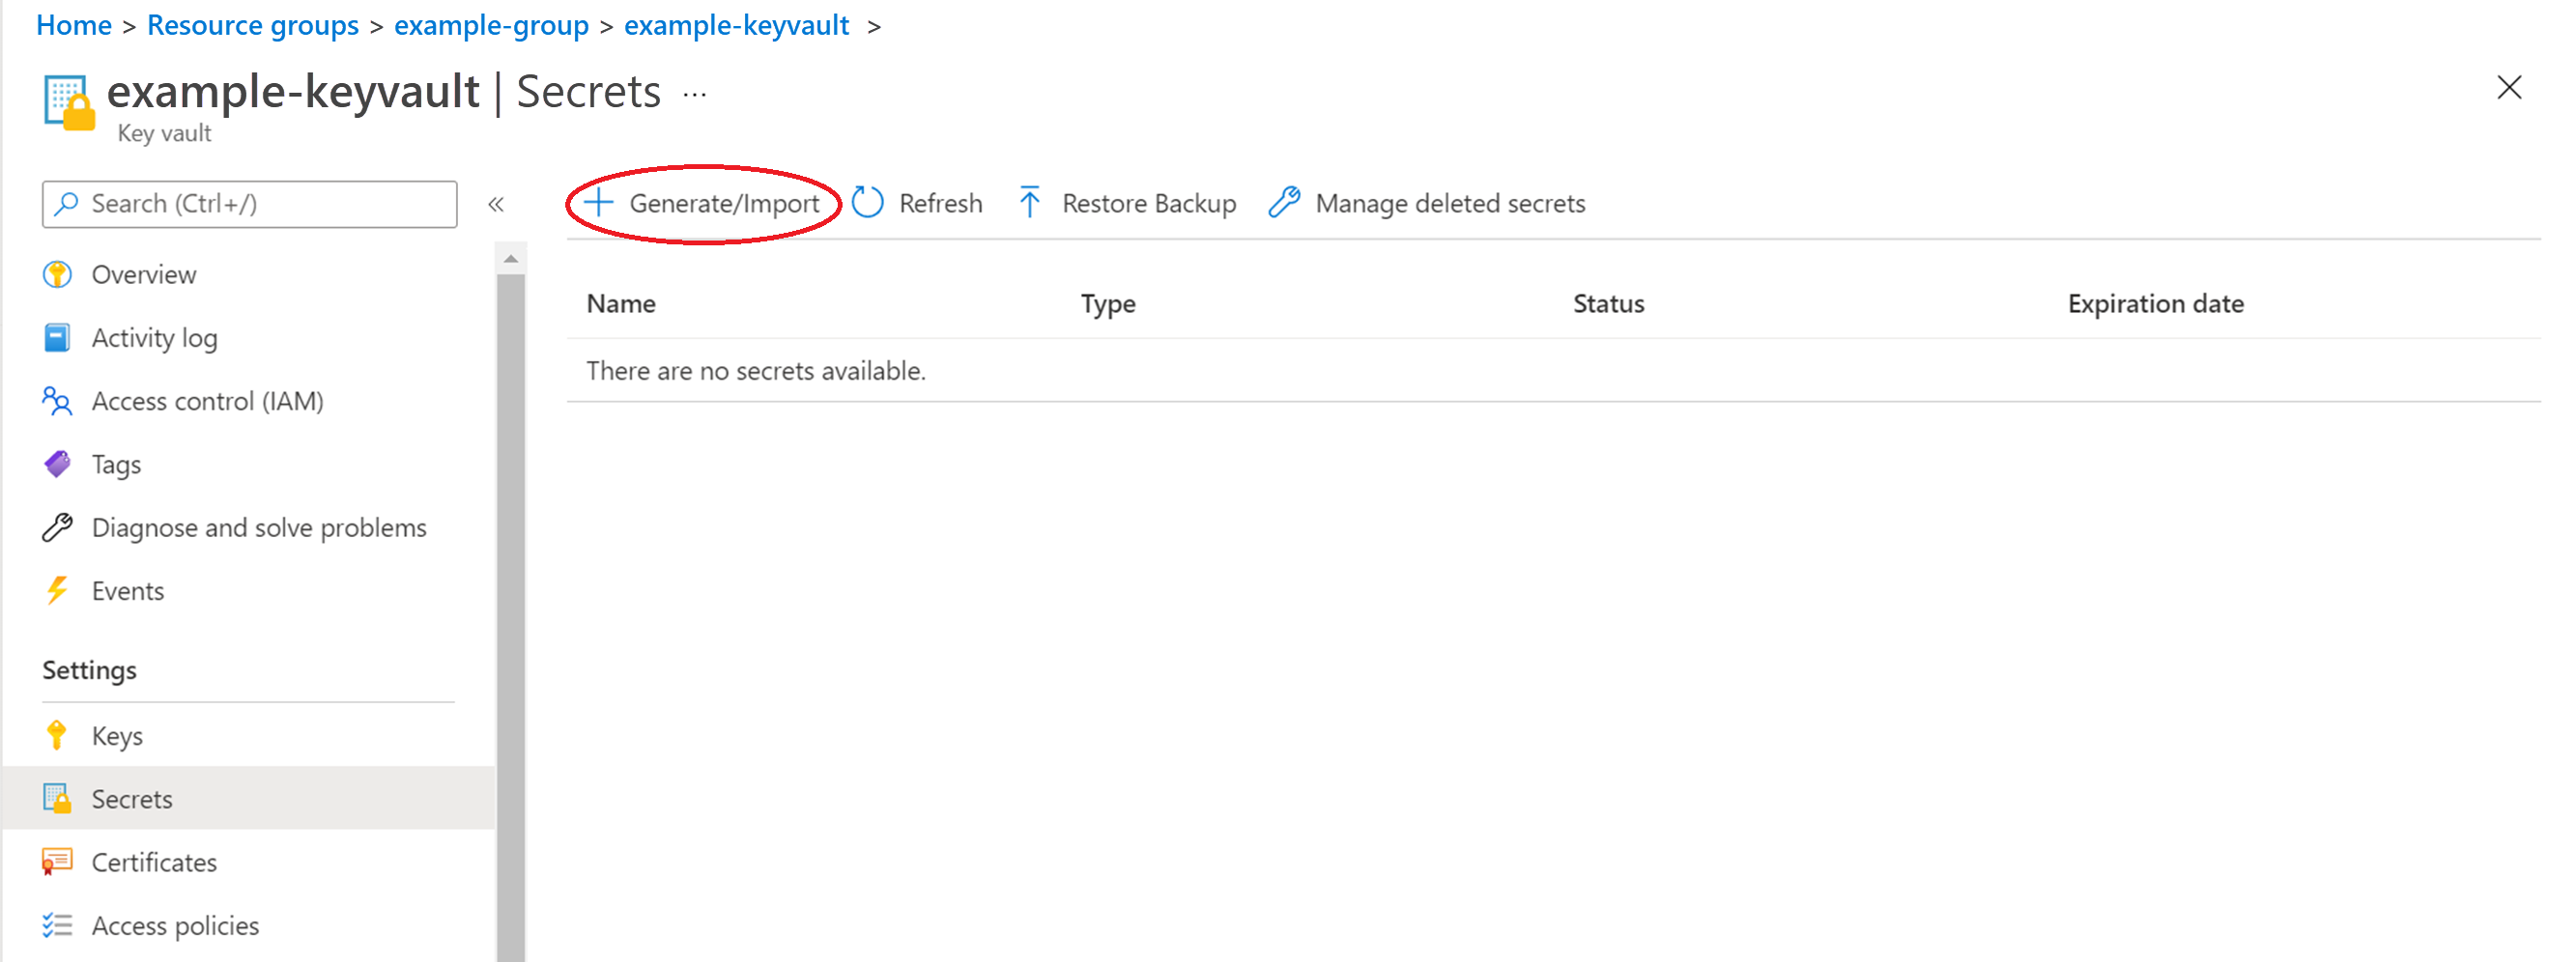
Launch the Key Vault.
Select Secrets in the left pane, and select + Generate/Import.
Create the secrets using the names in the following table.
Note
The two examples after the table describe the process of creating a secret.
Secret Name (based on the examples Tenant 1 and Tenant 2) Value description tenantid1 Azure AD TenantId for Tenant 1. Example: bd382938-yyyy-yyyy-yyyy-yyyyyyyyyyyy servicePrincipal1 Service Principal for tenant 1. Example: lld32e908-yyyy-yyyy-yyyy-yyyyyyyyyyyy MTWpaSecret1 Credential for servicePrincipal1 for tenant 1. Example: dsfUELk23r7912!# tenantid2 Azure AD TenantId for tenant 2. Example: bd382938-xxxx-xxxx-xxxx-xxxxxxxxxxxx servicePrincipal2 Service Principal for tenant 2. Example: hh2bd38d-xxxx-xxxx-xxxx-xxxxxxxxxxxx SPSecret2 Credential for servicePrincipal2 for tenant 2. Example: bjdIOLUE.j23iu2!#
Example 1: This example provides a sample OData URL for each of the tenants, namely Tenant 1 and Tenant 2, in which the names of the secrets to be created are present.
Tenant 1: In this example, the tenantid1, servicePrincipal1, and MTWpaSecret1 values are the secrets to be created in the keyvault.
https://workplaceanalytics.office.com/2de6681a-42d5-46fa-a858-2660f5743815/scopes/e0d8d313-6075-4c25-b714-98843532ae61/jobsOData/a6ca4178-f30b-4c7a-8c8e-38f53fe1d2d0/GroupToGroup,tenantid1,https://workplaceanalytics.office.com,servicePrincipal1,MTWpaSecret1,GroupToGroup,GroupToGroupTenant 2: In this example, the values tenantid2, servicePrincipal2, and SPSecret2 are the secrets to be created in the keyvault.
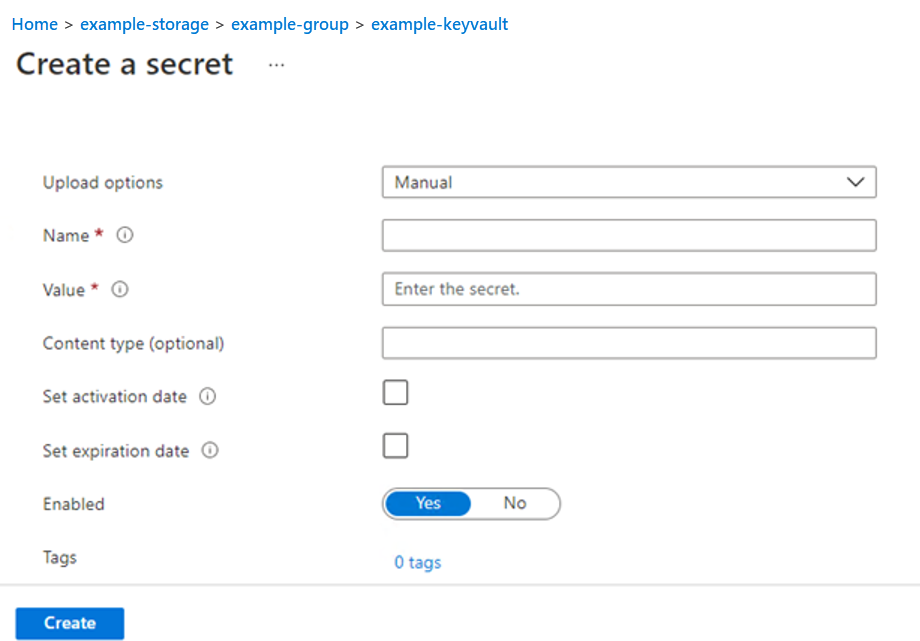
https://workplaceanalytics.office.com/10c5ca3c-a4d2-424d-8af3-f0efd6c79c99/scopes/217c5147-e12b-448c-9672-25b79a9ec0f0/jobsOData/ae3270dc-ba5a-4c40-b6b9-81fd9b5a4eac/GroupToGroup,tenantid2,https://workplaceanalytics.office.com,servicePrincipal2,SPSecret2,GroupToGroup,WpAAIGroupToGroupExample 2: This example describes (in a pictorial form) the step involved in creating a secret, using the tenantid1 value from the Tenant 1 example.


Creating a secret
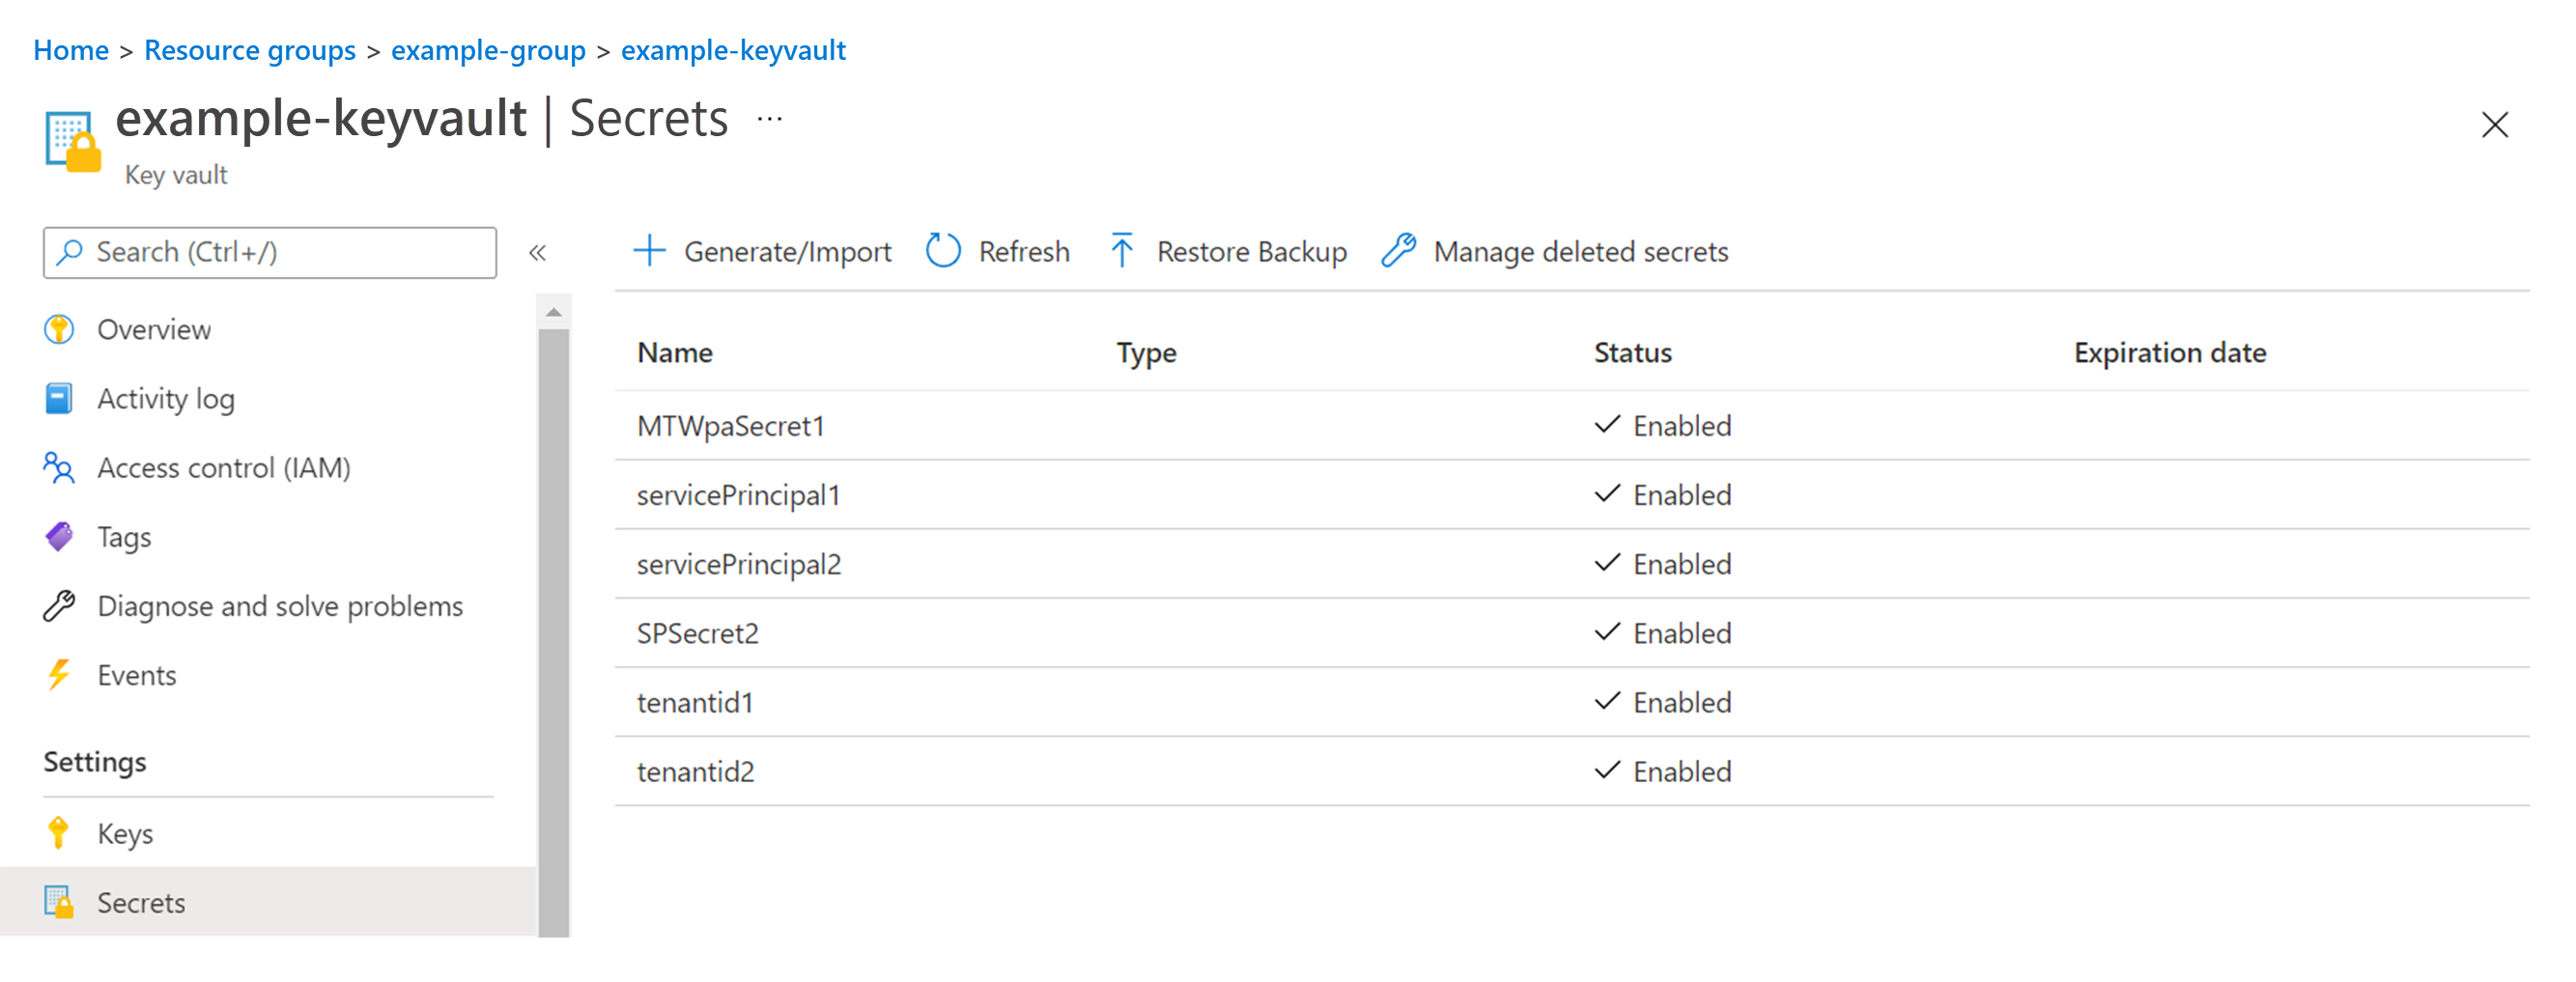
Created (the above) secret in the key vault
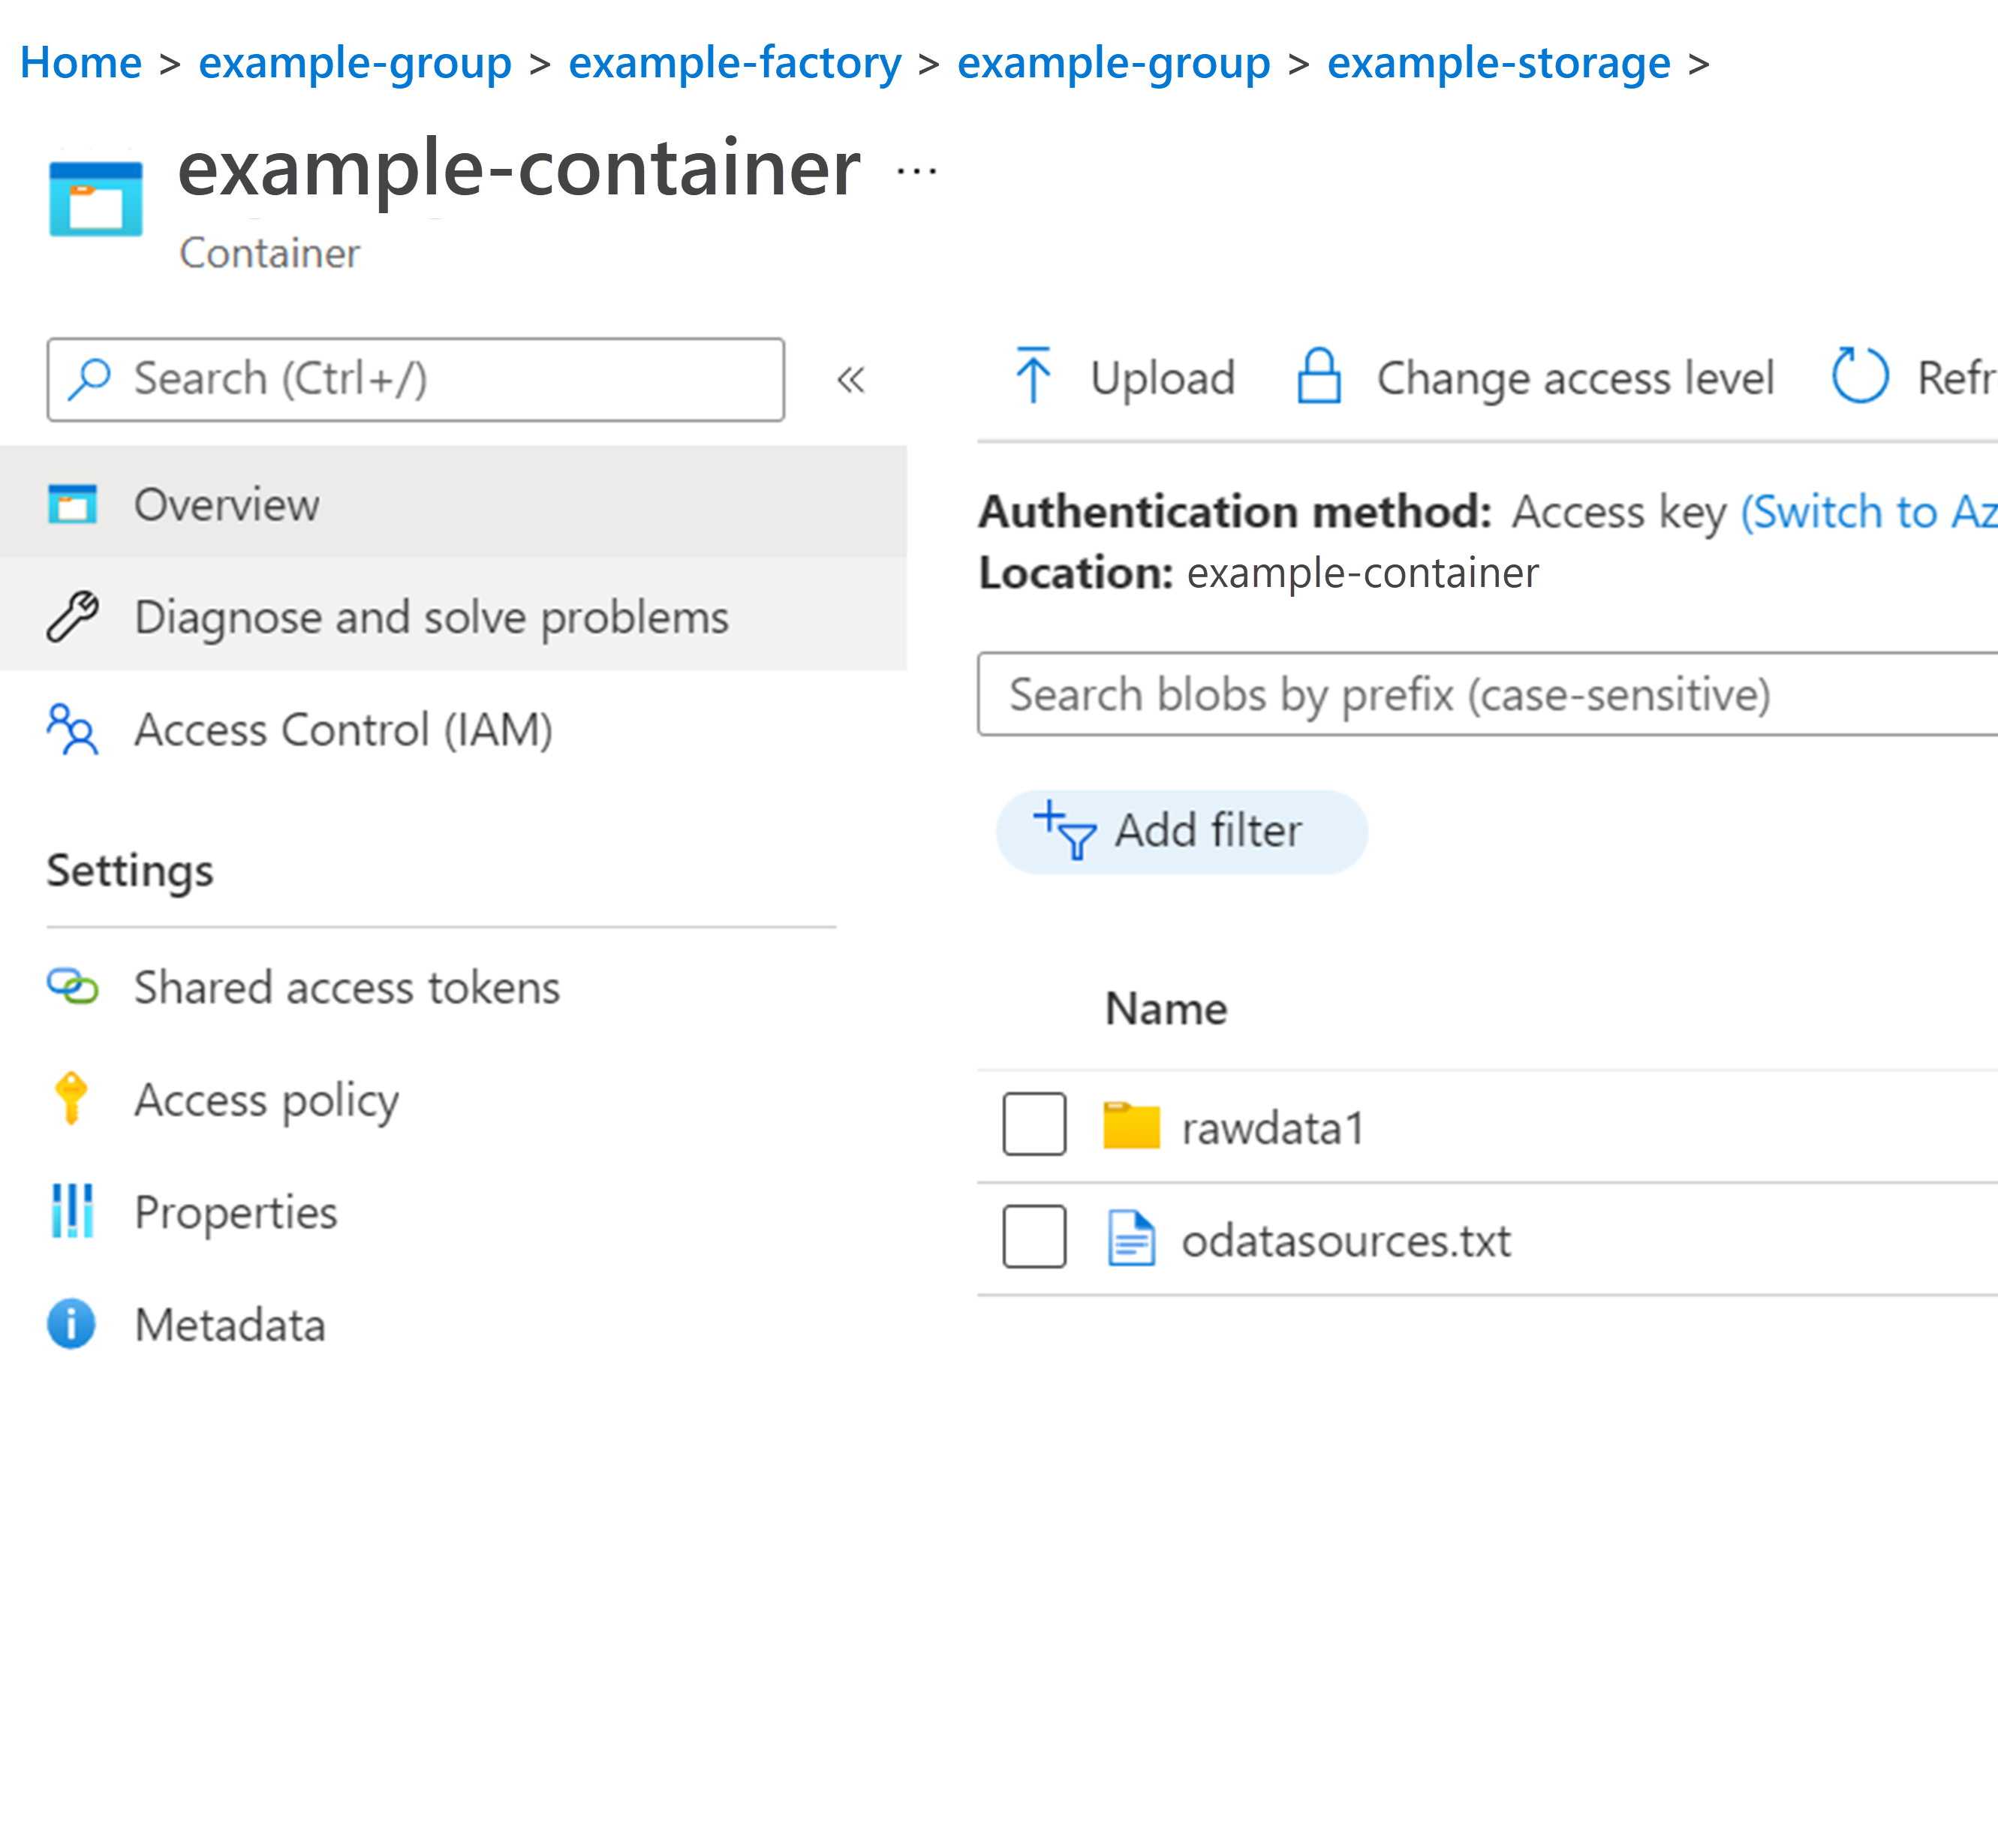
- Upload the ODatasources.txt file to the storage account in the wpaexports container by performing the following steps:
- Launch the storage account.
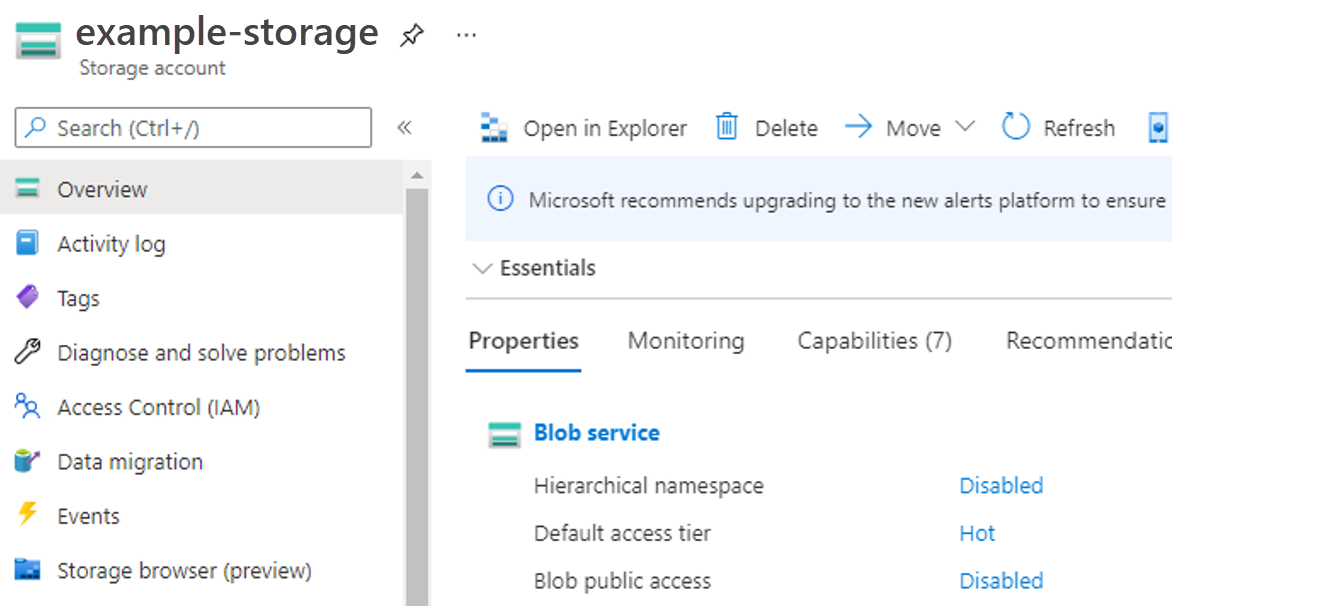
- Select Containers in the left pane.
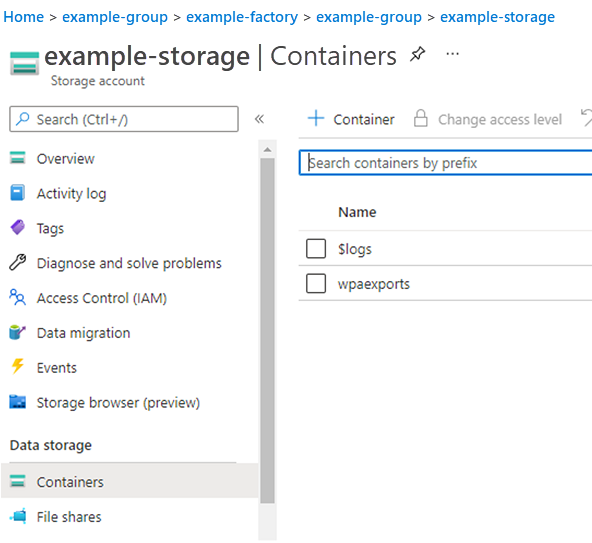
- Select the container you created earlier in Data pipeline - Automated, step 2h. The screen displaying details/options in this container is displayed.
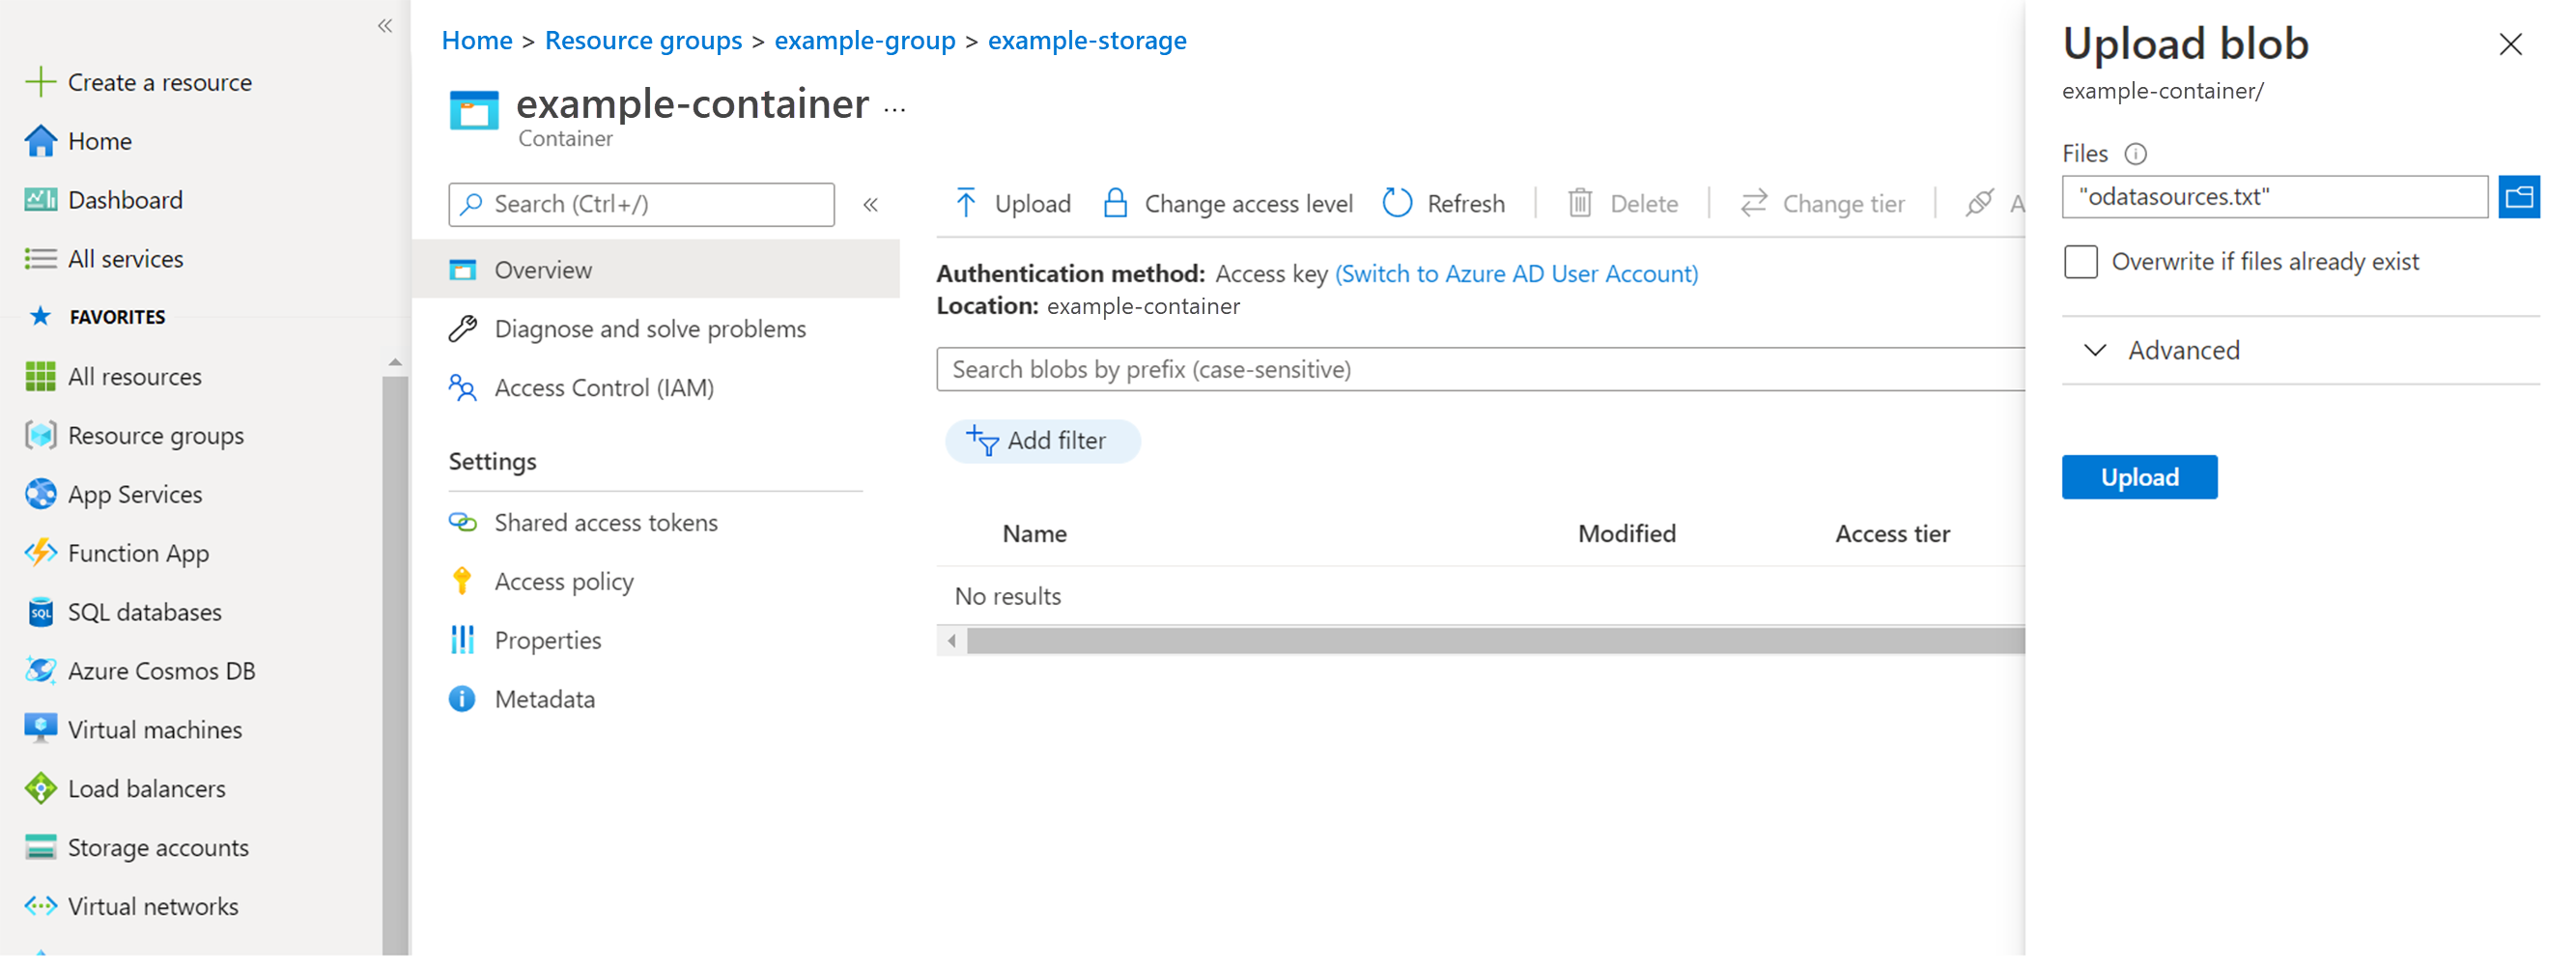
- Select Upload to the right of the search bar. The screen displaying the uploaded file appears.
- Launch the storage account.

To set trigger for pipeline
A trigger can be created in the Azure data factory to execute the pipeline on a schedule. This schedule is dependent on the needs and the report granularity. For the Business Continuity, it is at a week grain. The minimum timeframe would be on a weekly basis, for example, every Tuesday.
Creation of a trigger for a pipeline is shown in the following graphic:

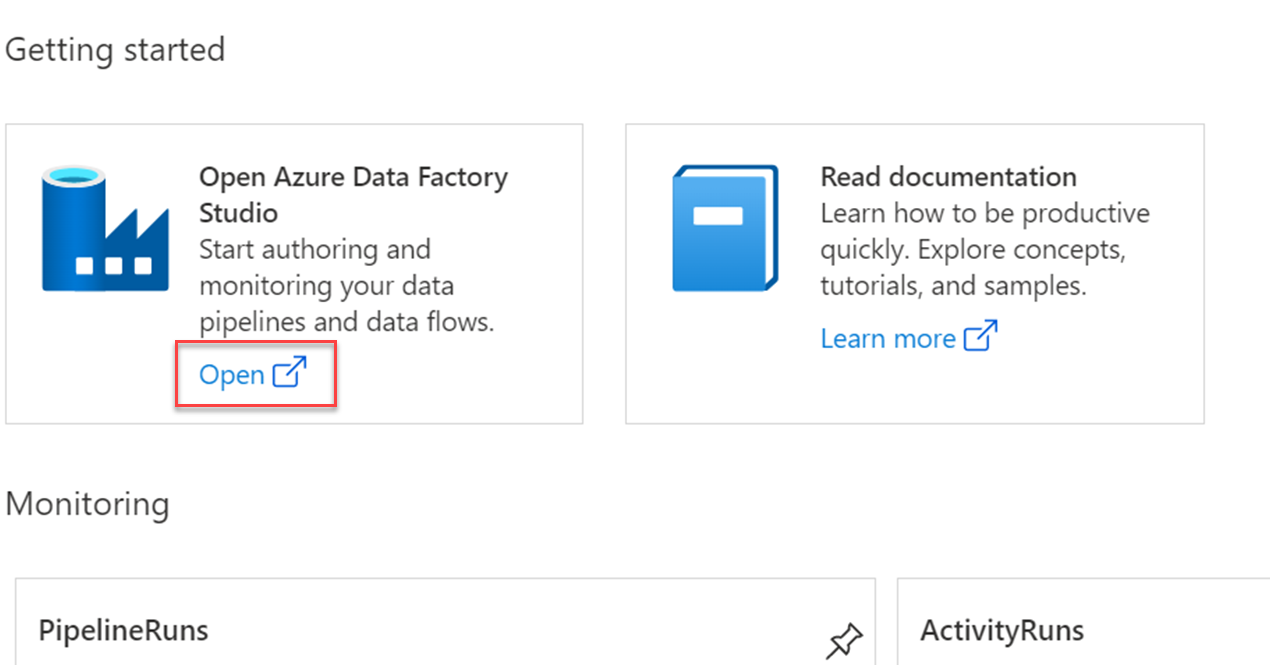
To execute the pipeline manually
Launch the data factory created earlier, and select Open under the Open the Azure Data Factory Studio option in the Getting started pane.
Note
Data factory is the one created during deployment of arm template for data factory creation for MultiTenant.
Select Author in the left pane.
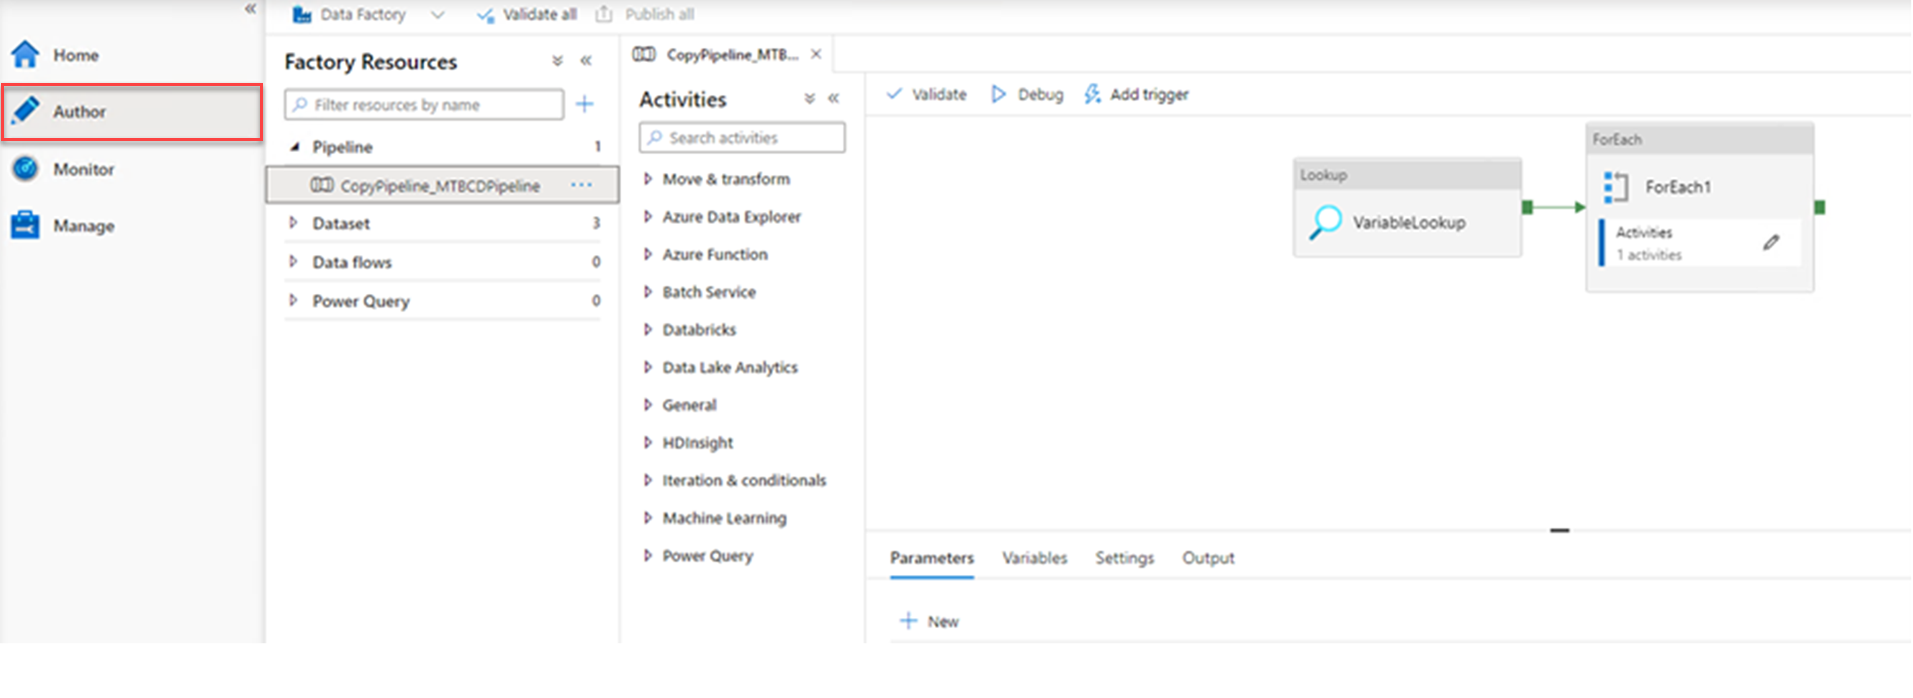
Expand the Pipeline pane and select CopyPipeline_MTBCDPipeline.
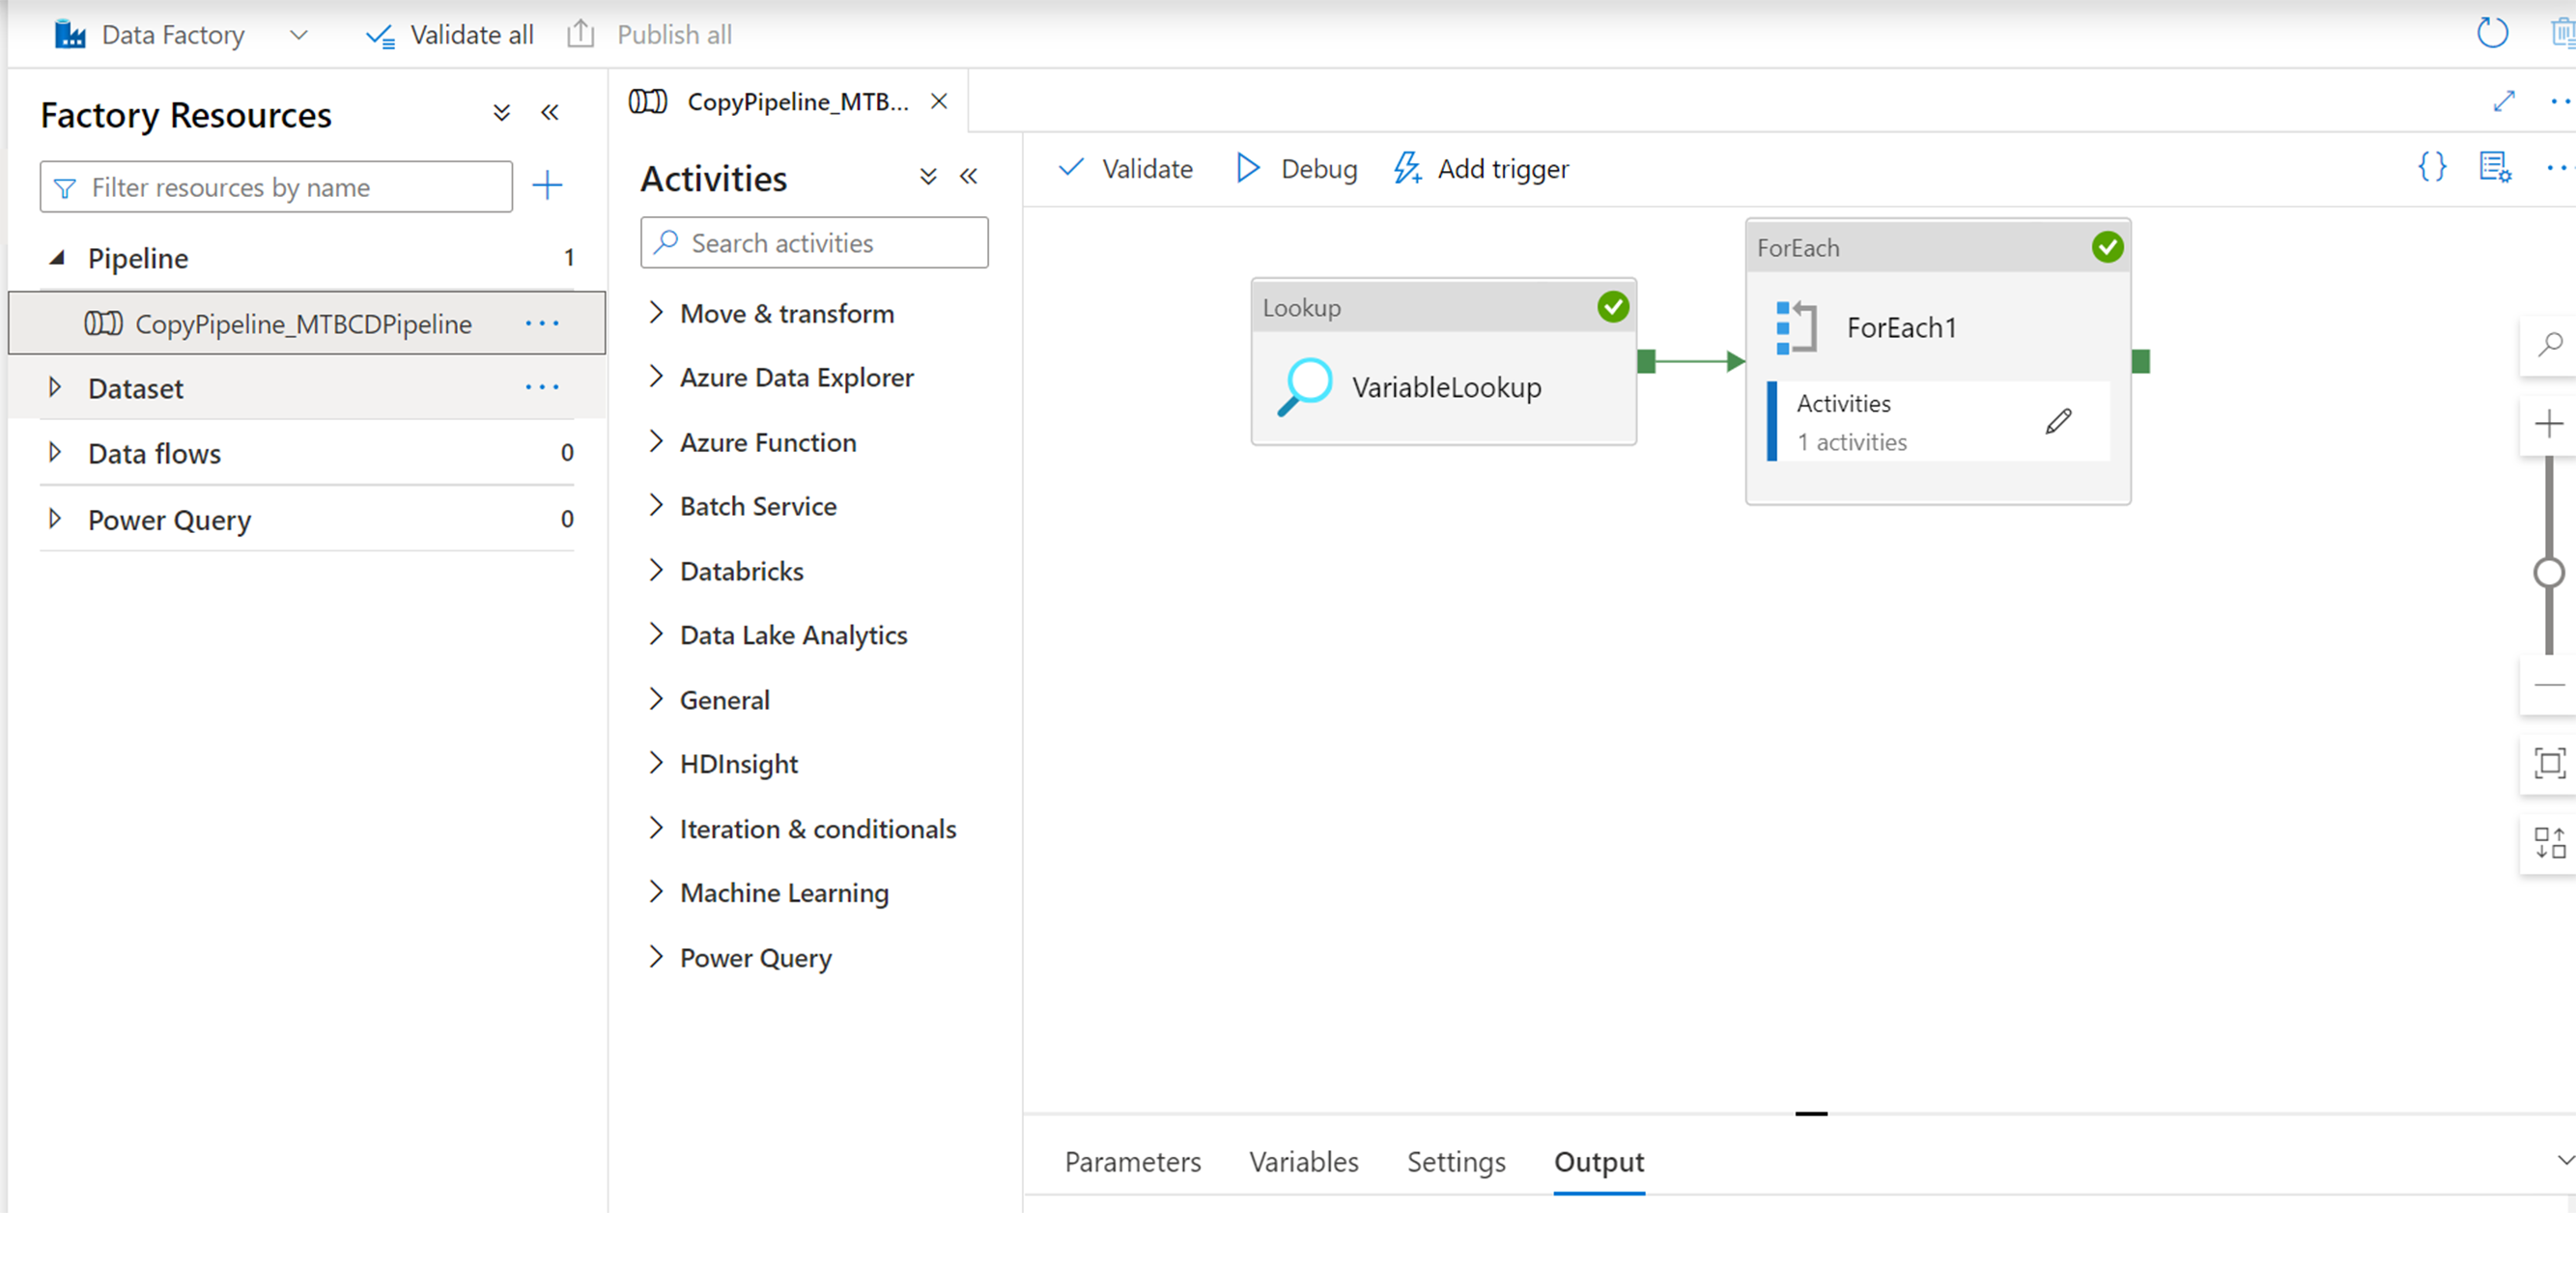
Select Debug. The following illustrates a successful execution of a debug operation.
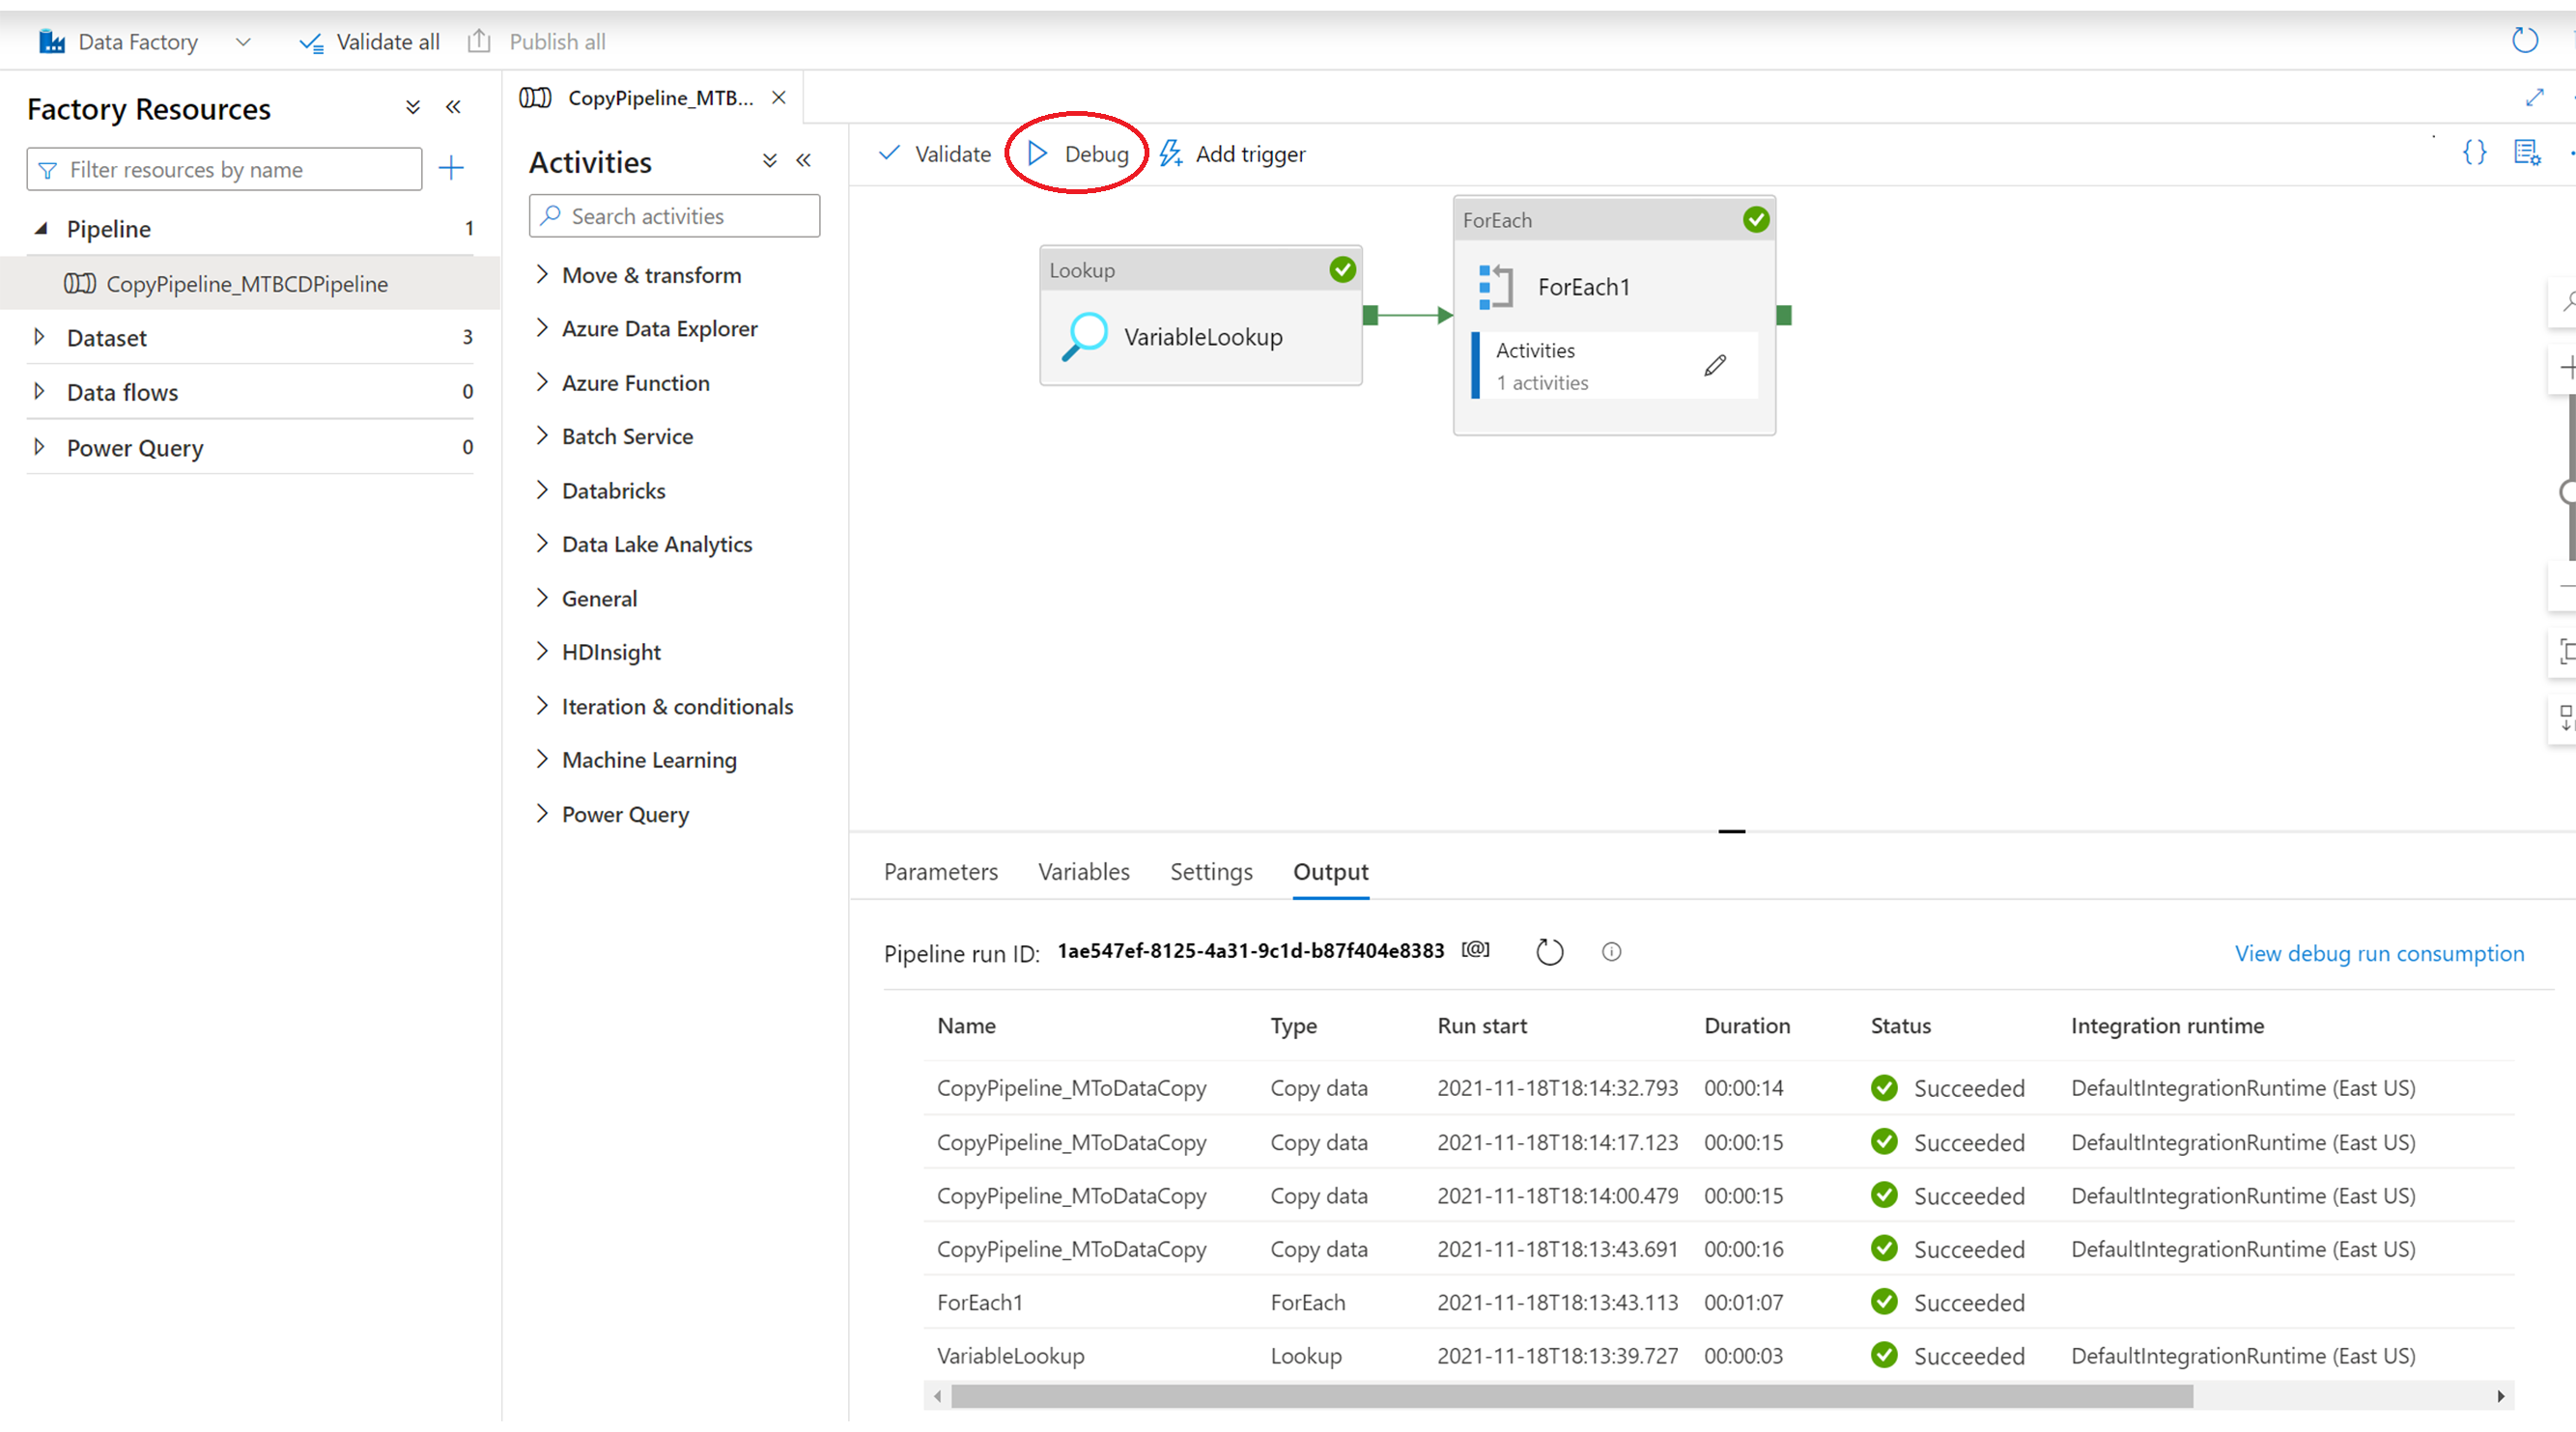
The output is available to view in the storage account in the container you created > rawdata1.

Visualize with PowerBi
Visualization with PowerBi can be implemented in many ways. PowerBi supports several data sources such as local storage, Azure blob storage, and OData sources.
The Business Continuity PBI report file can be used as an example of the following type:
- A file that can be downloaded from Viva Insights and modified to support multiple tenants as data sources.
To download the report, you can download the PBI template for the Business Continuity report you executed as part of the preconditions.
Once you have downloaded the report and the data sources have been modified, the report can show visualizations across the two tenants. See the following for some example screenshots.
Example 1
To obtain an insight into the look of the report by a tenant, perform the following steps:
- In the Settings screen, from the Select an organizational attribute to view the report by drop-down list, choose the Tenant identifier attribute.
- Select one of the Power BI report pages.
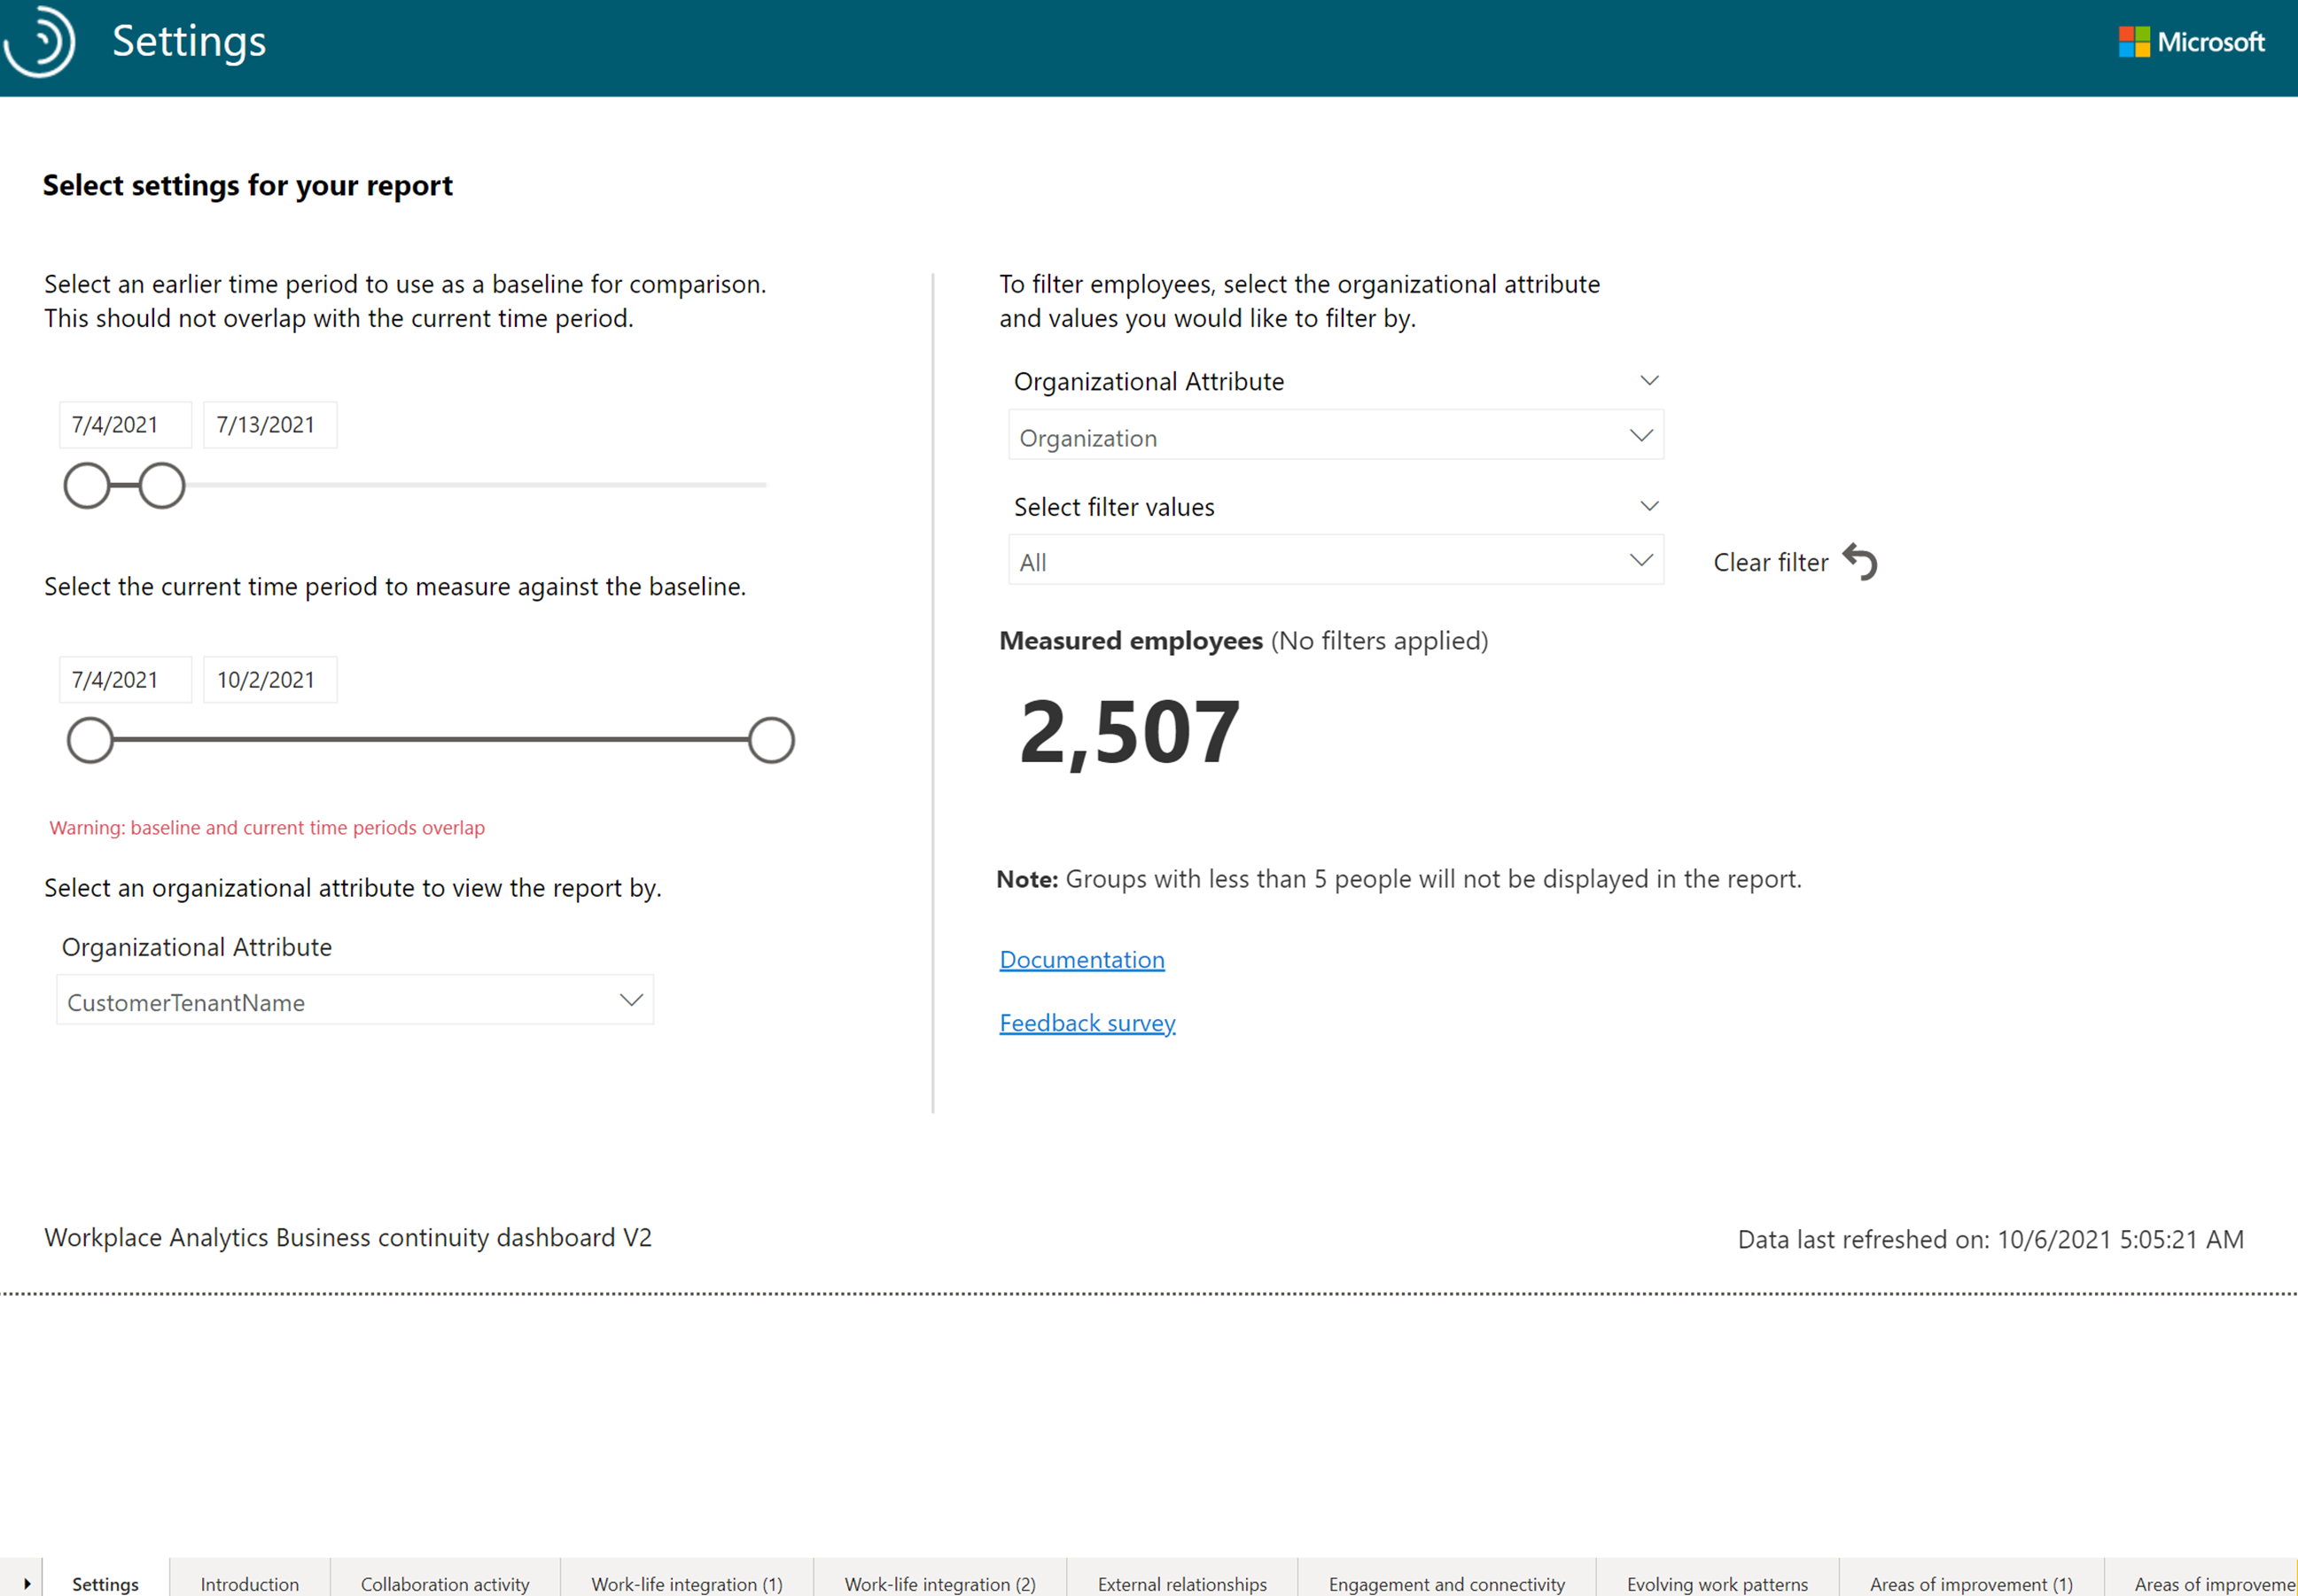
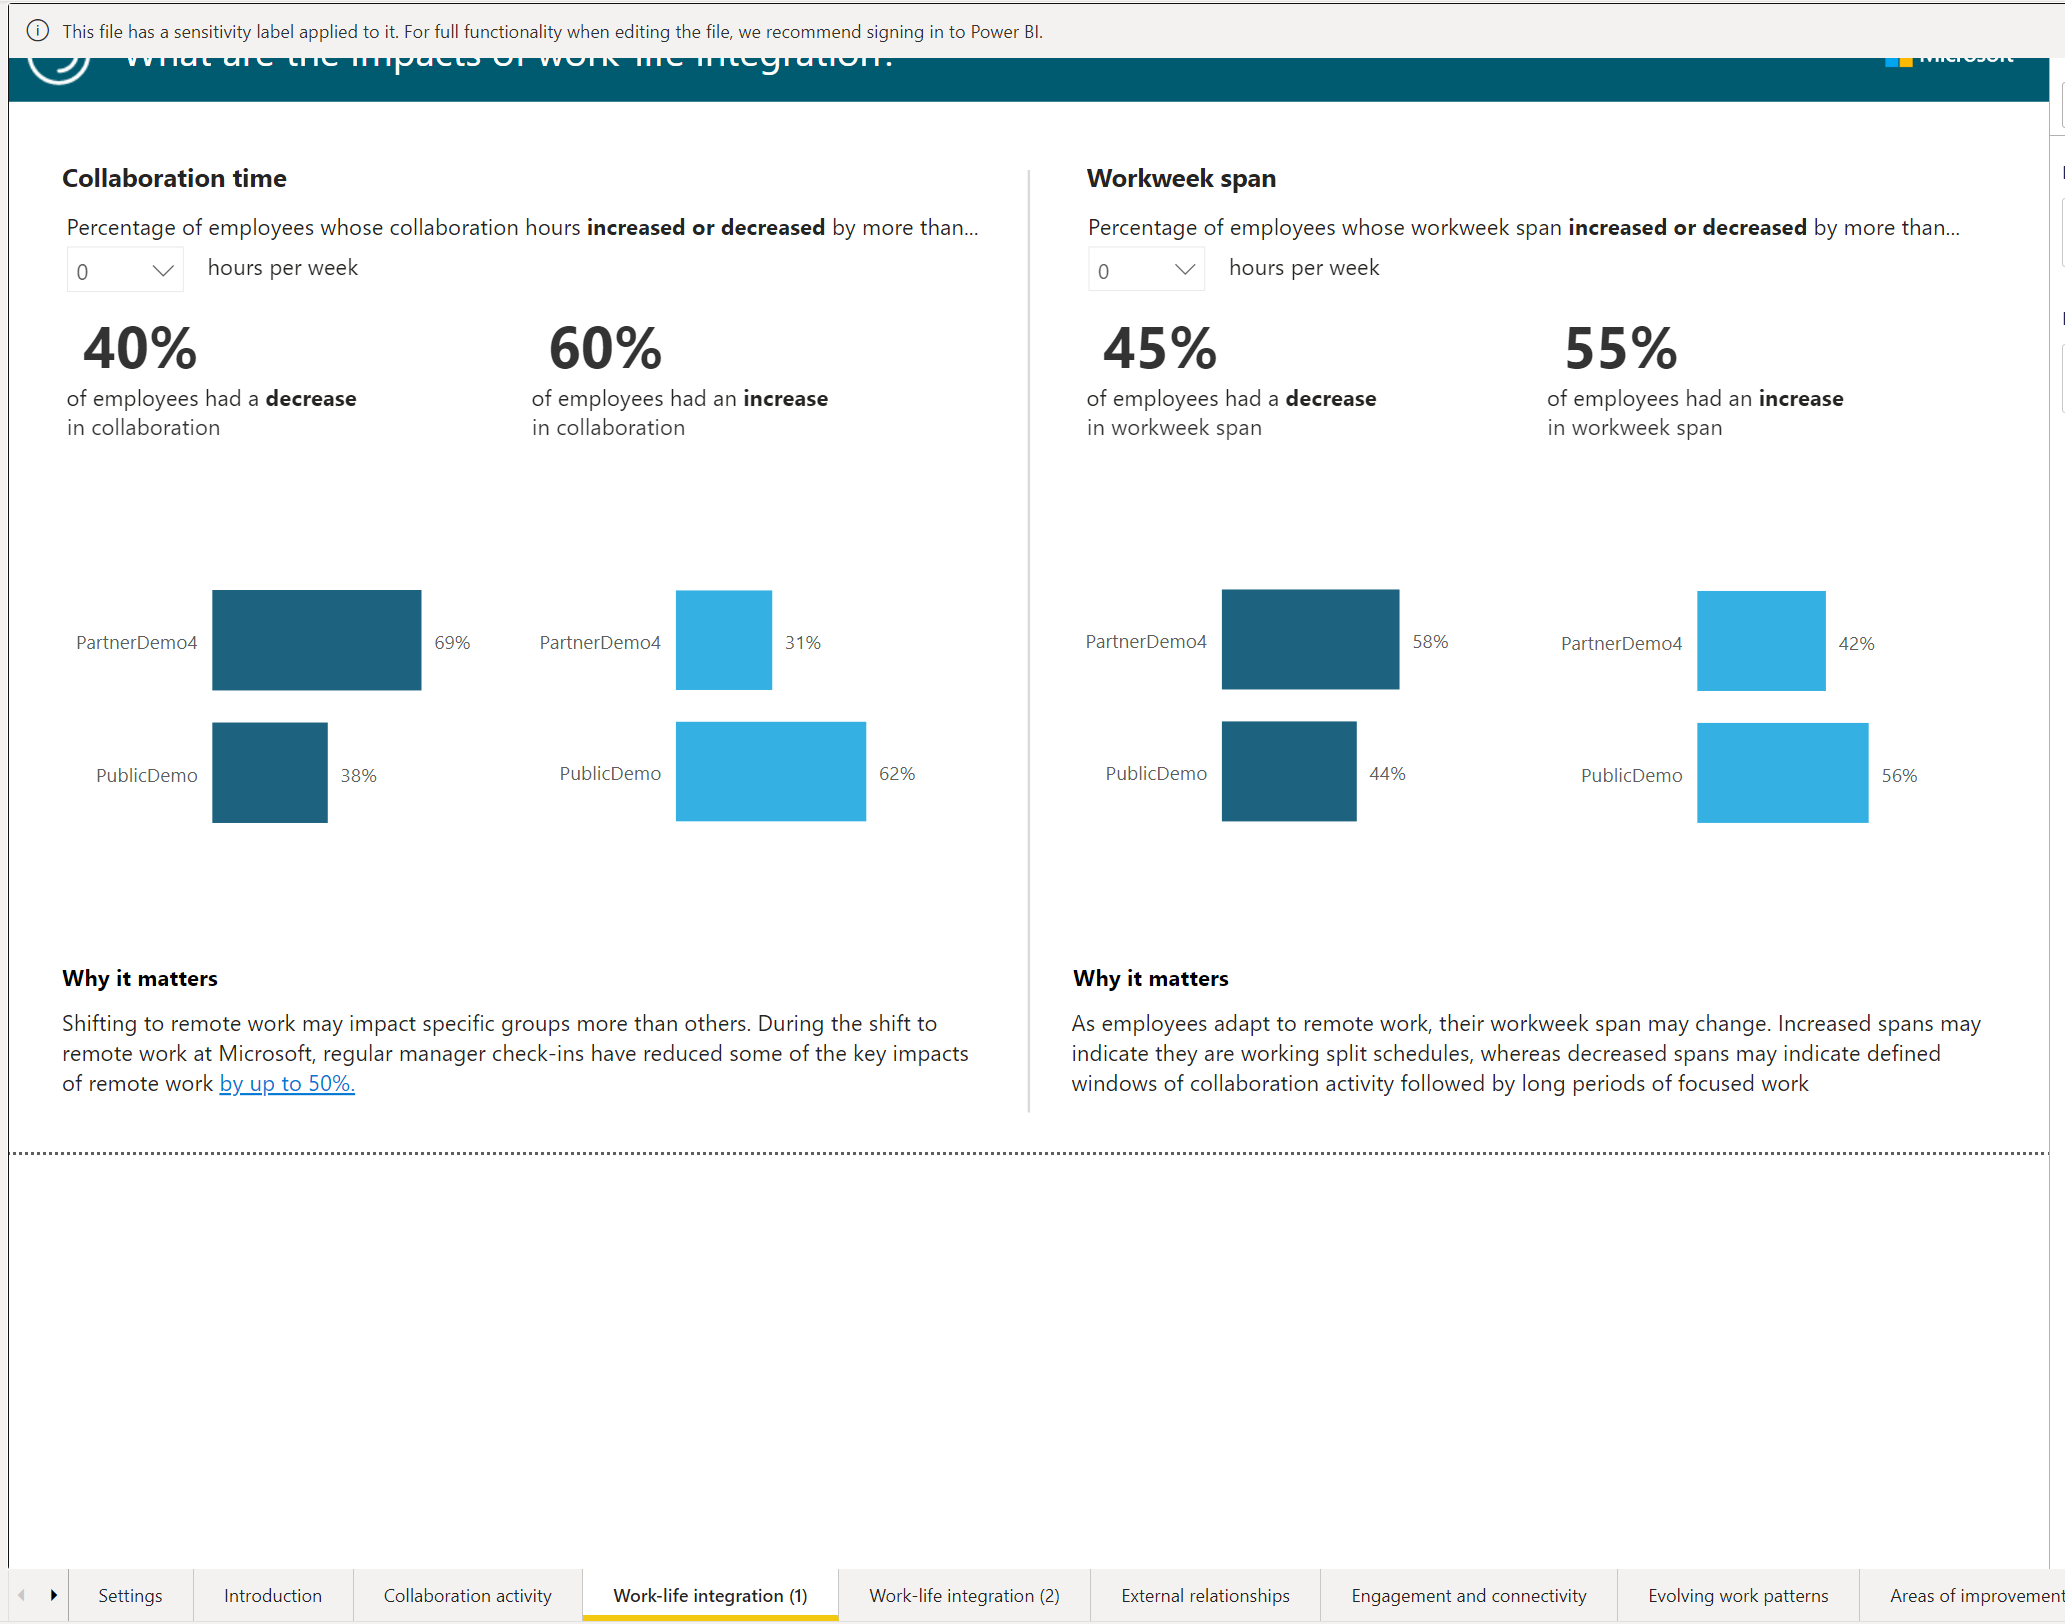
The following screenshot depicts one of the selected pages.
You can go with any number of settings combinations for different perspectives on the insights.
Example 2
To view the Tenant 1 organization insights, perform the following steps:
- In the Settings screen, from the Select an organizational attribute to view the report by drop-down list, choose Organization.
- Under the To filter employees, select the organizational attribute and values you would like to filter by pane, from the Organizational Attribute drop-down list, choose TenantInd.
- From the Select filter values drop-down list, choose one of the tenants.
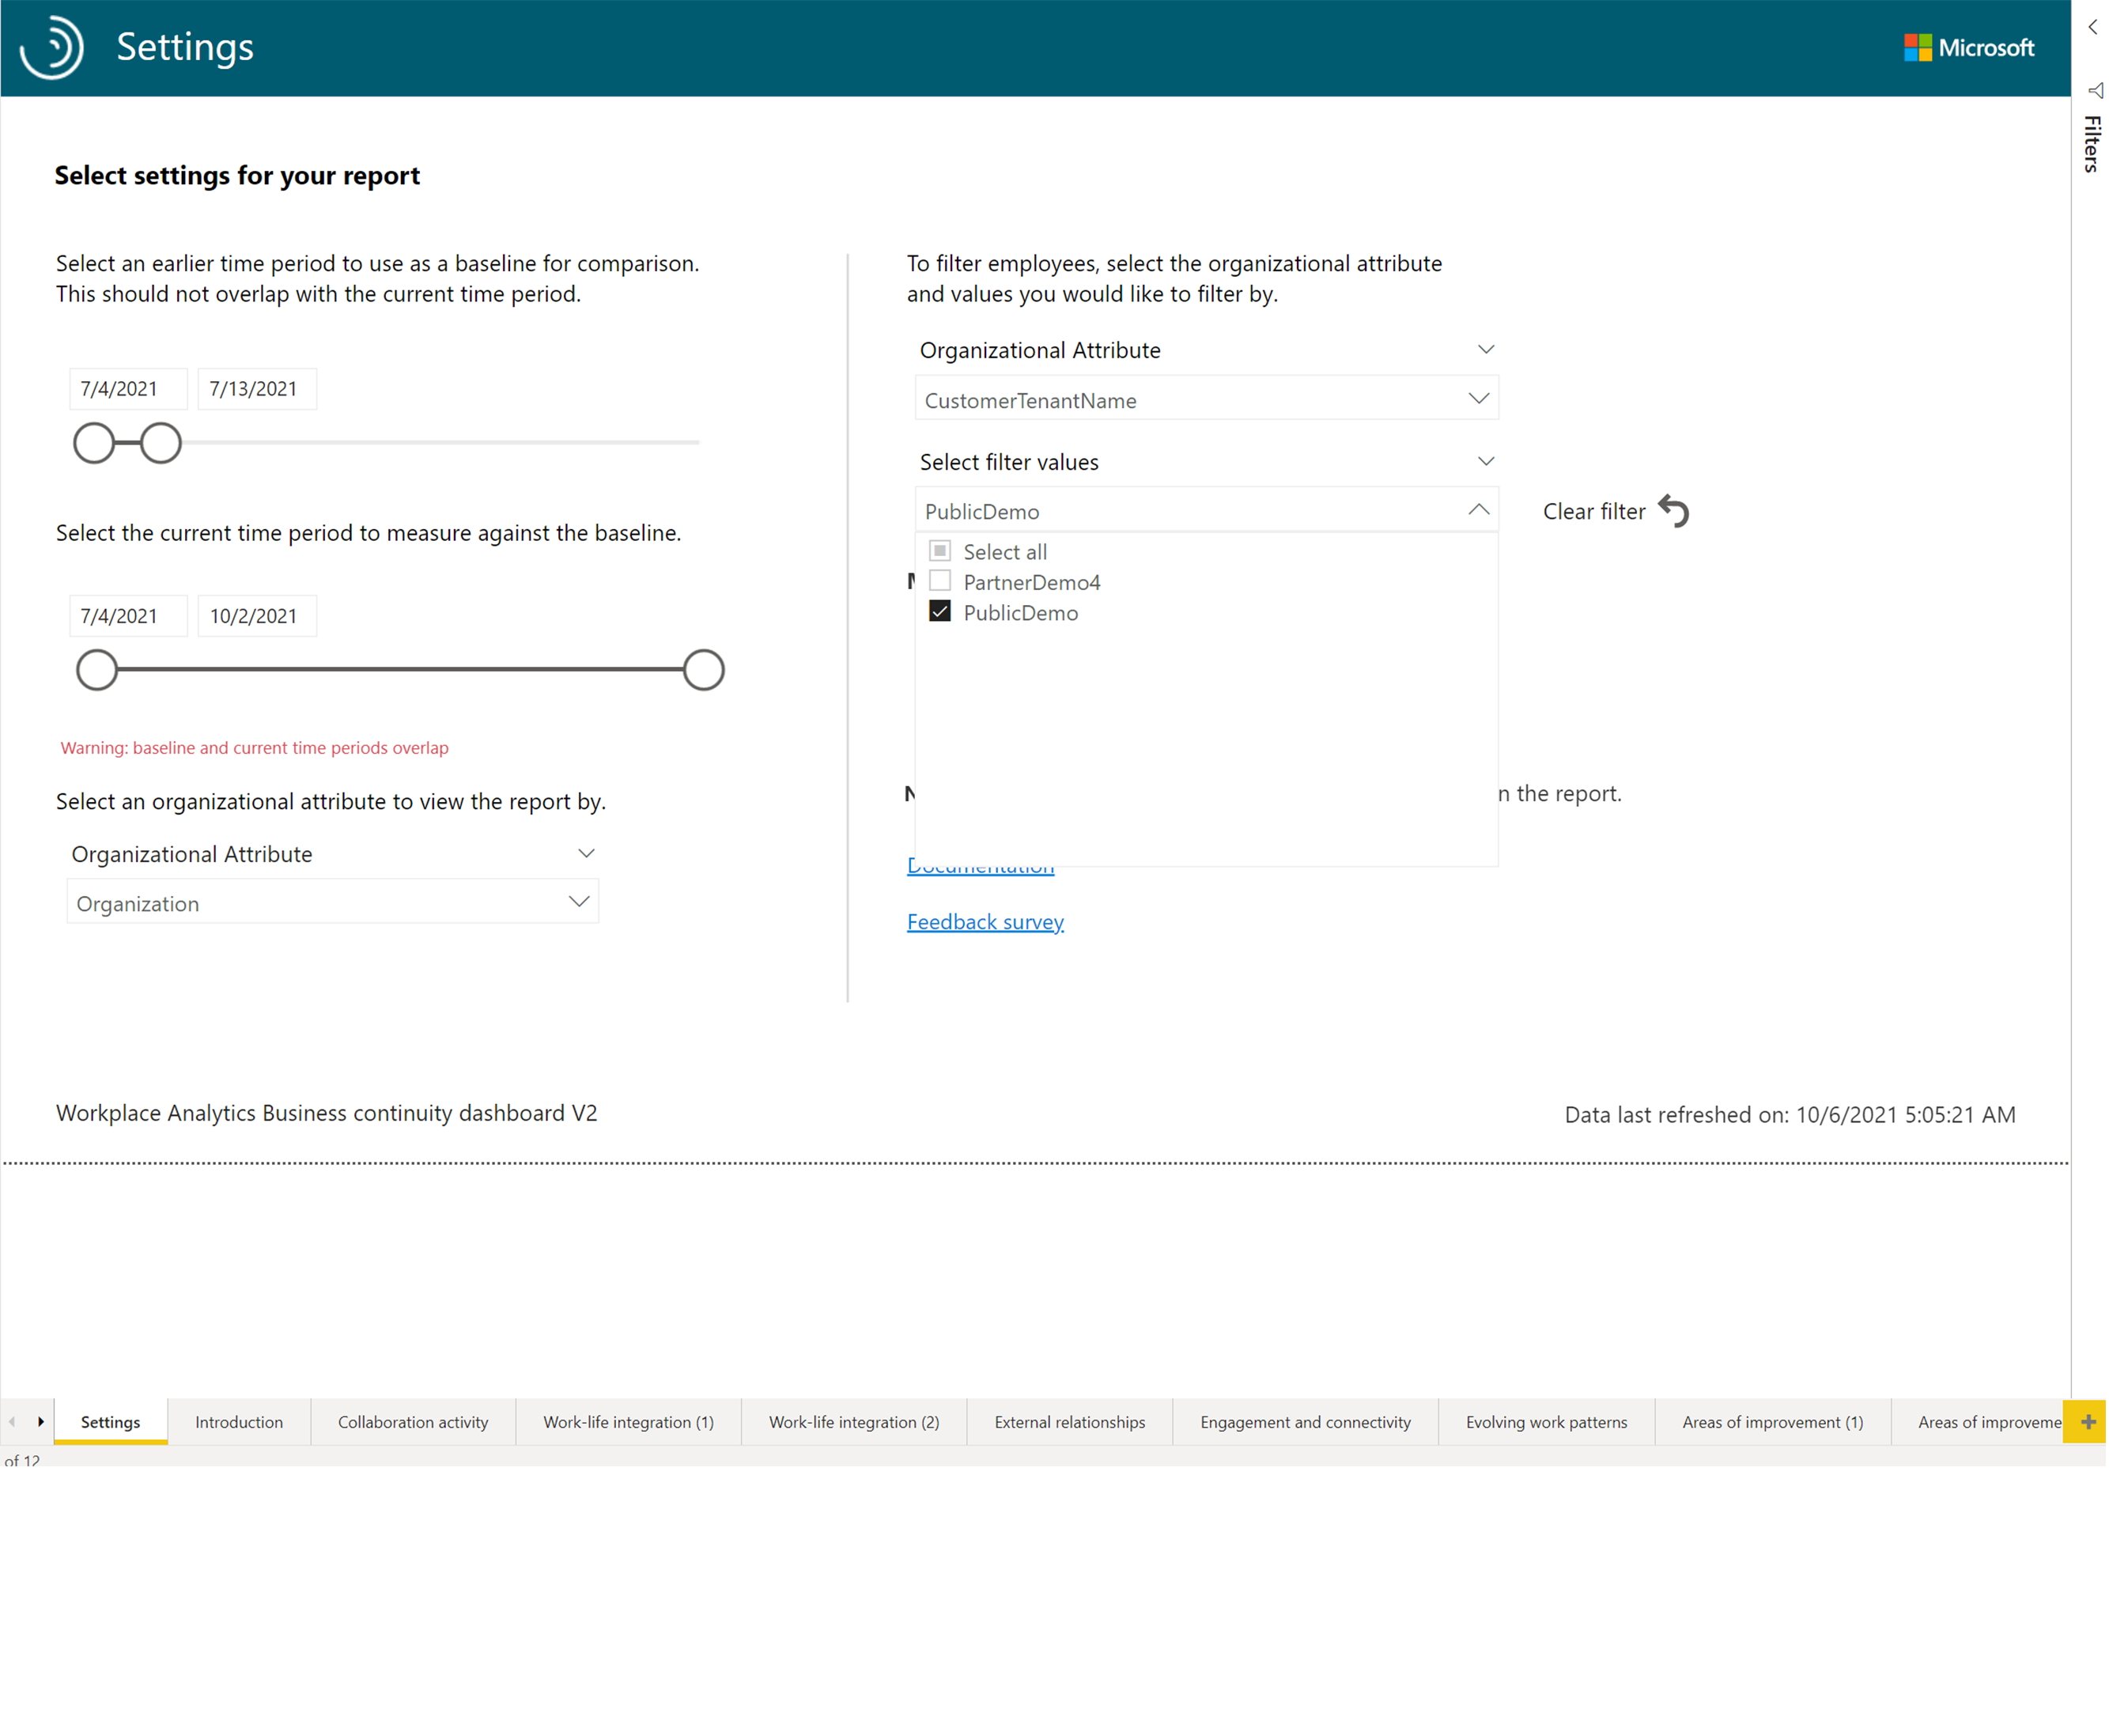
- Select one of the report pages.
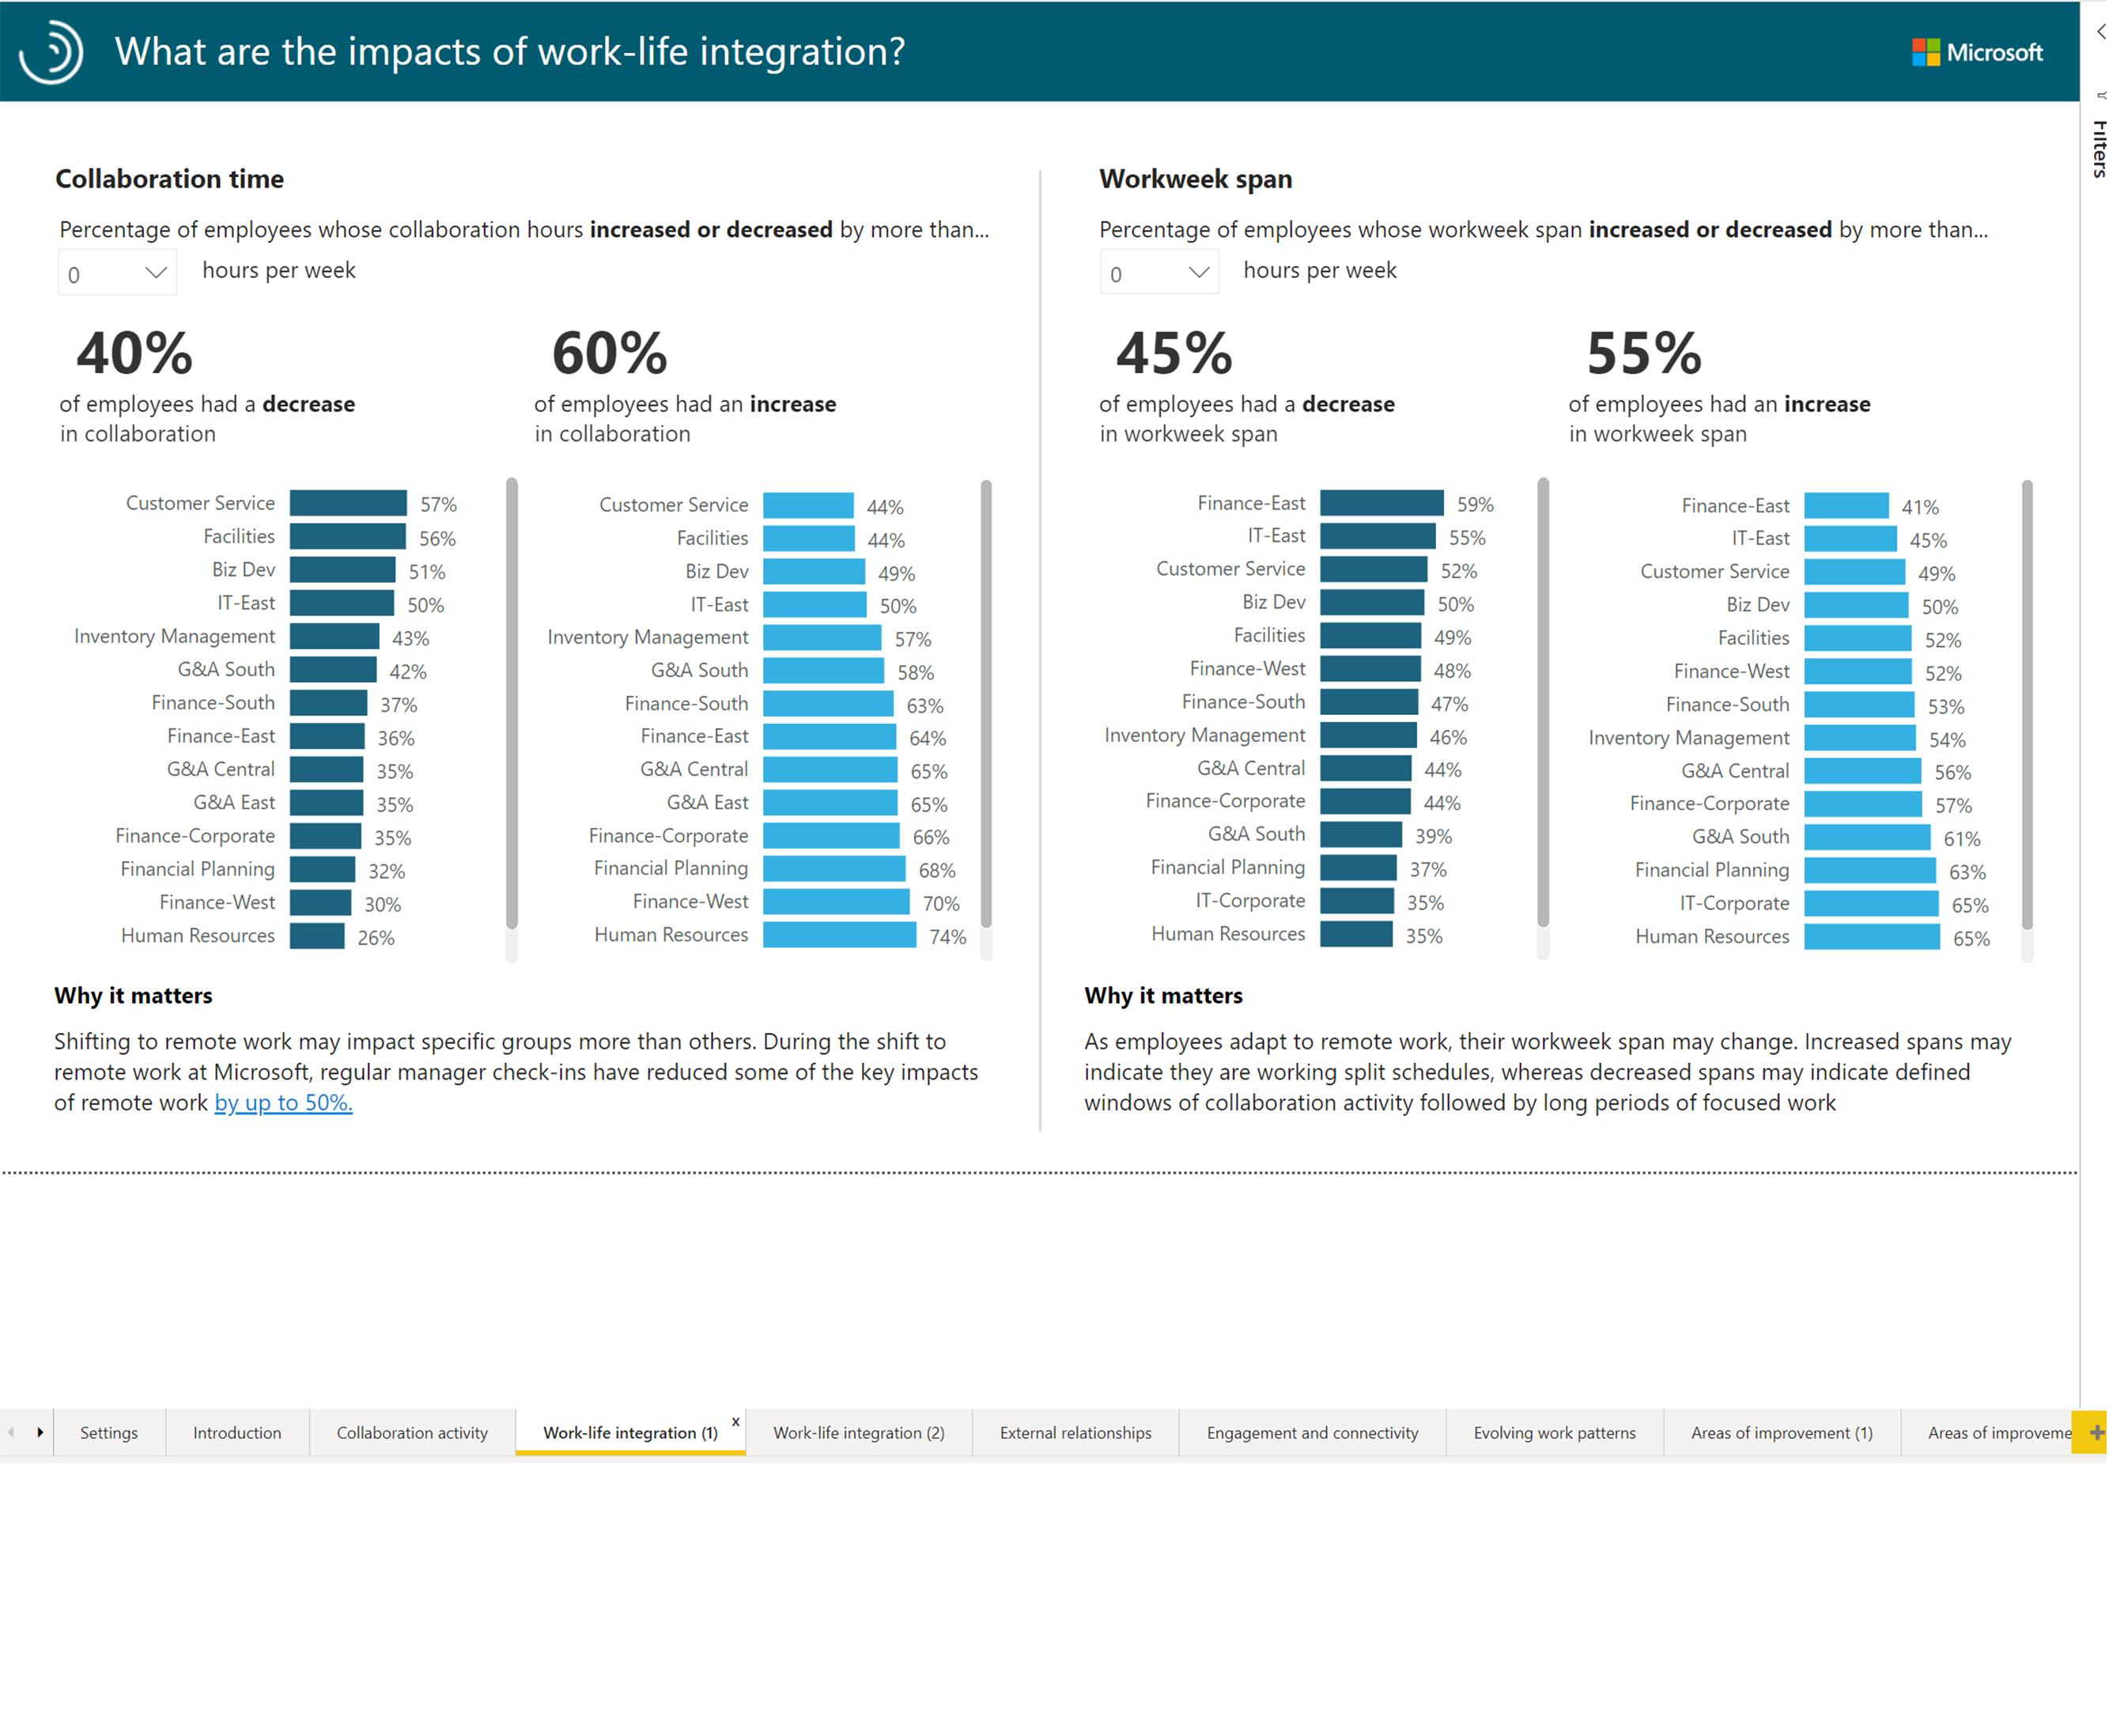
- From the Select filter values drop-down list, choose one of the tenants.