Note
Access to this page requires authorization. You can try signing in or changing directories.
Access to this page requires authorization. You can try changing directories.
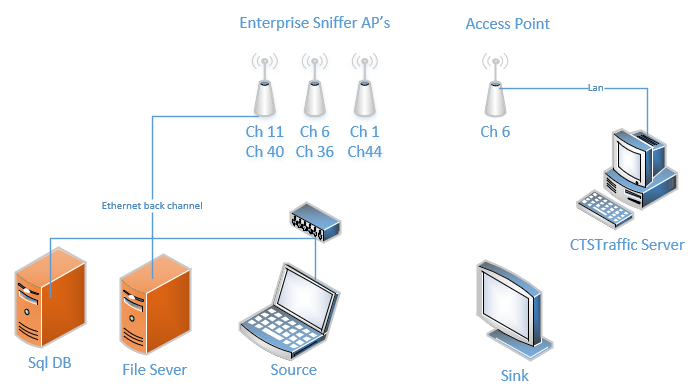
The full setup of the Windows Stress automation includes the elements shown in the diagram below:
In order to setup Widows Stress automation you will need the following devices and materials:
| Source (PC) machine | Identify the Windows PC to be used as the Source. You may use your own or pull from the IOP list provided in this document |
| The Wi-FiAndWirelessProjectionStress_x64.msi file | |
| Xperf - installed via the Windows Assesment and Deployment kit (ADK) | |
| Sink (Receiver) device | Use your own or pull from the IOP list |
| Sniffer devices | A Cisco 5500 wireless controller |
| 3 AIR-CAP3702E-A-K9 (configured for monitoring mode) | |
| Server Machine | A Windows 10 machine (client or server will work for this) |
| At least 2 additional hard drives (for storage of logs and over-the-air captures) | |
| Wireshark (for sniffer captures) | |
| 7zip (for zipping the sniffer captures) | |
| SqlDatabase | Any SQL database with the schema specified below. The SQL database is used to store the results of a test run. |
| Access Point | Any consumer Access Point will work |
Configuring the Source (PC)
Partners who have been onboarded to the Microsoft Collaborate partner portal can download the Miracast stress tool package at:
Client | UTIL | Miracast | Miracast stress test automation toolkit
https://partner.microsoft.com/dashboard/collaborate/packages/7576
This package contains Miracast stress test tools and scripts to automate client / sink Miracast connection testing to help identify reliability issues.
Make sure that Windows PC is running the latest published OS version and drivers by going to Settings / Updates and Security and selecting Check for Updates.
After setting up your Wireless Projection Receiver verify that the client can connect to it.
Run Wi-FiAndWirelessProjectionStress_x64.msi
a. Click Next on the welcome page.
b. Select Stress Client on the install type, and then click Next.
c. Select your optional settings:
- "Disable Wireless projection over Infrastructure." – This will add the necessary reg key to disable Wireless projection over Infrastructure.
- “Enable DriverVerifier” – This will enable driver verifier on the wifi adapter and the necessary support files. To get a list rules applied and files effected run verifier.exe /query from and elevated cmd prompt.
d. Select the folders you wish to have the files copied to, and then click Next
Note
Wi-Fi stress is included in this package as well. Having it on the machine will not effect how the Wireless Projection stress is run.
e. Confirm the installation by clicking Next.
f. Confirm the unknown publisher request.
g. During the install a cmd window will open to complete some additional tasks.
Enter in a new computer name if you wish to change it or click Enter to keep the current one.
Type y or n to reboot the machine - if you enabled driver verifier or changed the name of your machine you will need to reboot before these take effect.
h. Click Close to complete the installation
Install xperf via the Windows Assessment and Deployment kit (ADK). /windows-hardware/get-started/adk-install
Connect wirelessly to the Infrastructure Access Point saving the profile as Auto Connect.
Validate all the necessary files were copied down:
| File | Description |
|---|---|
| c:\stress\Analyze_Miracast.exe | Utility that parses the ETL result files from the stress run and produces a result XML |
| c:\stress\Bucketizer.exe | Utility that takes in the XML output from Analyze_Miracast.exe, packages the various log files and handles the upload of the results to the SQL database for reporting. |
| c:\stress\Ctstraffic.exe | Traffic generating tool |
| c:\stress\ExecuteMiracastStress.ps1 | Powershell execution script for running the stress |
| c:\stress\P2papplication.exe | Utility for starting/stopping/querying Miracast connections |
| c:\stress\wpt\Perfcore.dll | Support DLL for Analyze_Miracast.exe for parsing ETL files |
| c:\stress\wpt\Perf_nt.dll | Support DLL for Analyze_Miracast.exe for parsing ETL files |
| c:\stress\Microsoft.Windows.EventTracing.GenericEvents.dll | Support DLL for Analyze_Miracast.exe for parsing ETL files |
| c:\stress\Microsoft.Windows.EventTracing.Interop.dll | Support DLL for Analyze_Miracast.exe for parsing ETL files |
| c:\stress\Microsoft.Windows.EventTracing.Processing.dll | Support DLL for Analyze_Miracast.exe for parsing ETL files |
| c:\stress\newtonsoft.json.dll | Support DLL for Analyze_Miracast.exe for parsing ETL files |
| c:\stress\Ionic.zip.dll | Used to compress results |
| c:\stress\System.IO.Compression.dll | Support DLL for Analyze_Miracast.exe for parsing ETL files |
| c:\stress\System.IO.Compression.FileSystem.dll | Support DLL for Analyze_Miracast.exe for parsing ETL files |
| c:\stress\System.Net.Http.dll | Support DLL for Analyze_Miracast.exe for parsing ETL files |
| c:\stress\System.Security.Principal.Windows.dll | Support DLL for Analyze_Miracast.exe for parsing ETL files |
| c:\stress\System.ValueTuple.dll | System.ValueTuple.dll - Support DLL for Analyze_Miracast.exe for parsing ETL files |
| c:\stress\TraceProviders.txt | Minimum provider GUIDs for Miracast tracing |
| c:\stress\TraceProvidersReduced.txt | Full list of provider GUIDs for Miracast tracing |
Configuring the Sink (Receiver)
Verify that the receiver you are using is running the latest version of the firmware. If you need a recommendation on a specific receiver to use please refer to our IOP matrix.
Configuring the Sniffers
On the controller make sure each radio in each AP is set to monitor mode and should be sending the traffic to the server machine.
Make sure that you setup sniffing the following channels:
- The social channels in the 2.4GHz band: 1, 6, and 11
- The channel that the Access Point is on
- The channel that the receiver is on
In our example configuration we are using:
- AP1 2.4 GHz = 1 (social channel), 5 GHz = 36 (access point)
- AP2 2.4 GHz = 6 (social channel), 5 GHz = 40 (receiver)
- AP3 2.4 GHz = 11 (social channel), 5 GHz = 44
On the server machine verify you are receiving the sniffer traffic from the controller (for reference see Collecting a Wireless sniffer trace using the Cisco Lightweight AP in Sniffer mode).
Configuring the server
Install Wireshark (note the installation directory)
Install 7zip (note the installation directory)
Enable Powershell Remoting
i. From an elevated cmd prompt run:
 > powershell
 > set-netconnectionprofile -interfaceAlias \* -NetworkCategory Private
 > enable-PSRemoting -Force -SkipNetworkProfileCheck
 > set-Item wsman:\\localhost\\client\\trustedhosts \* -Force
 > restart-service WinRM
Create two network shares:
i. Logs - this is for copying the log files from the client ii. Captures - this is for storing the over the air captures that are collected on this server
Verify you can read/write to these shares from the client machine with credentials.
Note the username and password used to connect to these two shares and what the path to the shares is
SQL database:(optional)
Configure your SQL server with the specified schema
Once your SQL server is setup configure two tables with the schema's located in the DBSchema.txt file located in the zip under \ServerScripts
Make sure you can connect to your DB from the stress client as it will "sqlize" the results as the test runs
In order to sqlize the results you will need a dbconnectstring.txt file on your client in the stress directory. The following is an example of what should go in the dbconnectstring.txt file:
Data Source=\<serverName\>;Initial Catalog=\<DBName\>;User
id=\<userid with write access\>admin
Configure the Access Point
Configure the Access Point with the following settings:
a. SSID - <anything easy to find> b. Security Type: WPA2PSK AES c. Password: <something easy to remember>
Configure ctstraffic server
On the CtsTraffic server:
a. Copy ctstraffic.exe to this machine b. From an elevated cmd prompt run:
ctsTraffic.exe -Listen:\* -Pattern:pushpull -PushBytes:4096 -PullBytes:4194304 -consoleverbosity:1Plug this machine into the access point.
Configure Source side Sink Tracing (Optional)
If your sink supports debug output via a serial connection the stress script can collect this information and save it as part of the output
Install putty on the source (available on the web)
Connect the sink's debug output to the client
Validate output:
a. Launch putty b. Open a serial connection using the com port the sink is connect to c. Verify out see the debug output d. Close putty
Note the COM port and baud rate used to connect to the sink as this will be passed into the stress script via parameters