Note
Access to this page requires authorization. You can try signing in or changing directories.
Access to this page requires authorization. You can try changing directories.
![]()
Time Travel Debugging (TTD) allows users to record traces, which are recordings of the execution of a program. Timelines are a visual representation of events that happen during the execution. These events can be locations of breakpoints, memory read/writes, function calls and returns, and exceptions.
Use the Timelines window to view important events, understand their relative position, and easily jump to their location in your TTD trace file. Use multiple timelines to visually explore events in the time travel trace and discover event correlation.
The Timelines window appears when you open a TTD trace file. It shows key events without you having to manually create data model queries. At the same time, all the time travel objects are available to allow for more complex data queries.
For more information about how to create and work with time travel trace files, see Time Travel Debugging: Overview.
Types of timelines
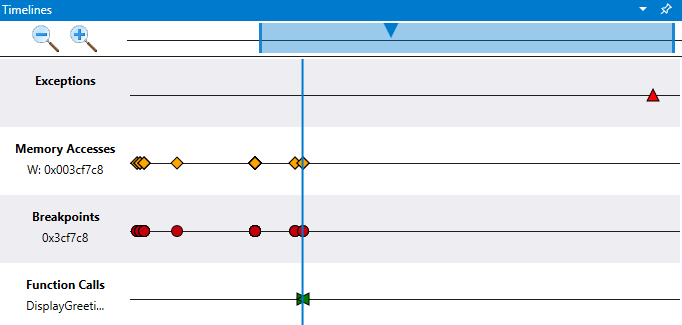
The Timelines window shows events in the following timelines:
- Exceptions: You can filter on a specific exception code.
- Breakpoints: You can see when breakpoints hit on a timeline.
- Memory Accesses: You can read, write, and execute between two memory addresses.
- Function Calls: You can search in the form of
module!function.
Hover over each event to get more information via tooltip. Selecting an event runs the query for the event and displays more information. Double-clicking an event jumps to that location in the TTD trace file.
Exceptions
When you load a trace file and the timeline is active, it displays any exceptions in the recording automatically.
When you hover over a breakpoint, information such as the exception type and the exception code appears.
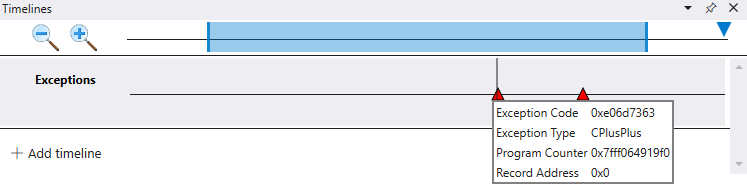
You can further filter on a specific exception code by using the optional Exception Code field.
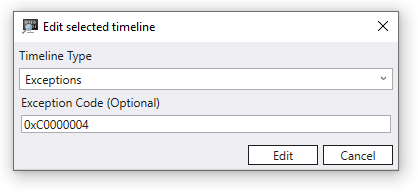
You can also add a new timeline for a specific exception type.
Breakpoints
After you add a breakpoint, the positions on the timeline show you when that breakpoint is hit. For example, you can use the bp Set Breakpoint command. When you hover over a breakpoint, the address and the instruction pointer associated with the breakpoint appear.

When the breakpoint is cleared, the associated breakpoint timeline is automatically removed.
Function calls
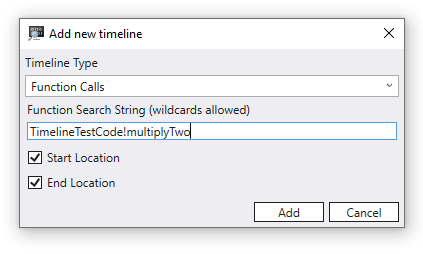
You can see the positions of function calls on the timeline. To do this step, provide the search in the form of module!function. An example is TimelineTestCode!multiplyTwo. You can also specify wildcards, for example, TimelineTestCode!m*.
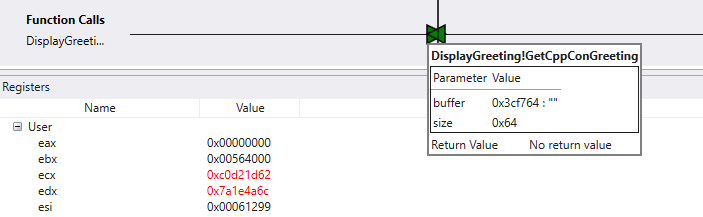
When you hover over a function call, the function name, input parameters, their values, and the return value appear. This example shows the buffer and size because they're the parameters for DisplayGreeting!GetCppConGreeting.
Memory access
Use the Memory Accesses timeline to see when a specific range of memory was read or written to, or where code execution took place. Start and stop addresses are used to define a range between two memory addresses.
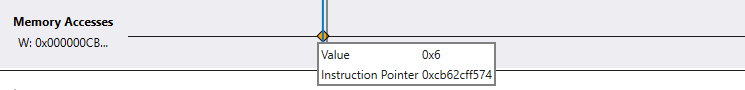
When you hover over a memory access item, the value and the instruction pointer appear.
Work with timelines
A vertical gray line follows the cursor when you hover over the timeline. The vertical blue line indicates the current position in the trace.
Select the magnifying glass icons to zoom in and out on the timeline.
In the top timeline control area, use the rectangle to pan the view of the timeline. Drag the outer delimiters of the rectangle to resize the current timeline view.
Mouse movements
To zoom in and out, select Ctrl and use the scroll wheel.
To pan from side to side, select Shift and use the scroll wheel.
Timeline debugging techniques
To demonstrate debugging timeline techniques, the Time Travel Debugging walkthrough is reused here. This demonstration assumes that you finished the first two steps to build the sample code and created the TTD recording by using the first two steps described there.
In this scenario, the first step is to find the exception in the time travel trace. Double-click the only exception that you see on the timeline.
In the Command window, you can see that the following command was issued when you selected the exception.
(2dcc.6600): Break instruction exception - code 80000003 (first/second chance not available)
Time Travel Position: CC:0
@$curprocess.TTD.Events.Where(t => t.Type == "Exception")[0x0].Position.SeekTo()
Select View > Registers to display the registers at this point in the timeline to begin your investigation.
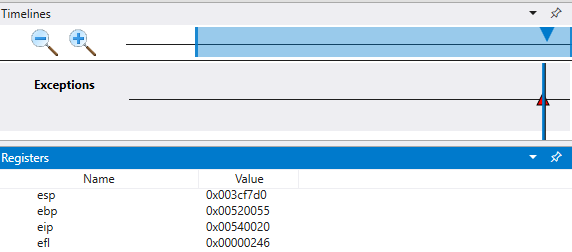
In the command output, the stack (esp) and base pointer (ebp) are pointing to different addresses. This discrepancy could indicate stack corruption. Possibly, a function returned and then corrupted the stack. To validate this issue, travel back to before the CPU state was corrupted and see if you can determine when the stack corruption occurred.
As you do that process, examine the values of local variables and the stack:
- Select View > Locals to display the local values.
- Select View > Stack to display the code execution stack.
At the point of failure, in trace it's common to end up a few steps after the true cause in error-handling code. With time travel, you can go back one instruction at a time to locate the true root cause.
On the Home ribbon, use the Step Into Back command to step back three instructions. As you do this process, continue to examine the Stack, Locals, and Registers windows.
The Command window displays the time travel position and the registers as you step back three instructions.
0:000> t-
Time Travel Position: CB:41
eax=00000000 ebx=00564000 ecx=c0d21d62 edx=7a1e4a6c esi=00061299 edi=00061299
eip=00540020 esp=003cf7d0 ebp=00520055 iopl=0         nv up ei pl zr na pe nc
cs=0023  ss=002b  ds=002b  es=002b  fs=0053  gs=002b             efl=00000246
00540020 ??              ???
0:000> t-
Time Travel Position: CB:40
eax=00000000 ebx=00564000 ecx=c0d21d62 edx=7a1e4a6c esi=00061299 edi=00061299
eip=00061767 esp=003cf7cc ebp=00520055 iopl=0         nv up ei pl zr na pe nc
cs=0023  ss=002b  ds=002b  es=002b  fs=0053  gs=002b             efl=00000246
DisplayGreeting!main+0x57:
00061767 c3              ret
0:000> t-
Time Travel Position: CB:3A
eax=0000004c ebx=00564000 ecx=c0d21d62 edx=7a1e4a6c esi=00061299 edi=00061299
eip=0006175f esp=003cf718 ebp=003cf7c8 iopl=0         nv up ei pl nz na pe nc
cs=0023  ss=002b  ds=002b  es=002b  fs=0053  gs=002b             efl=00000206
DisplayGreeting!main+0x4f:
0006175f 33c0            xor     eax,eax
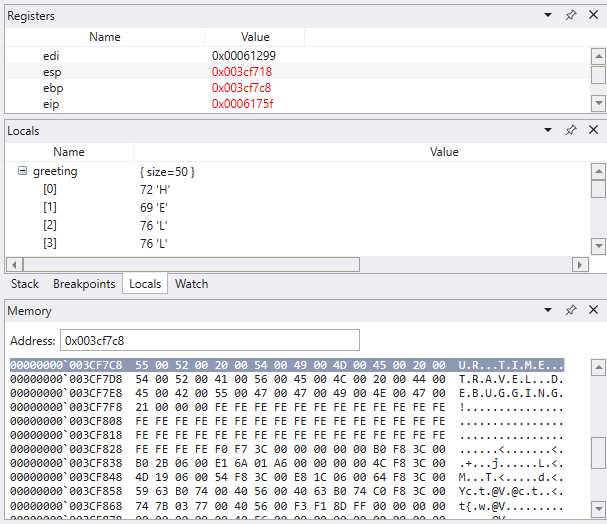
At this point in the trace, your stack and base pointer have values that make more sense. It appears that you're getting closer to the point in the code where the corruption occurred.
esp=003cf718 ebp=003cf7c8
The Locals window contains values from your target app. The Source code window highlights the line of code that's ready to be executed in your source code at this point in the trace.
To investigate further, open up a Memory window to view the contents near the stack pointer (esp) memory address. In this example, it has a value of 003cf7c8. Select Memory > Text > ASCII to display the ASCII text stored at that address.
Memory access timeline
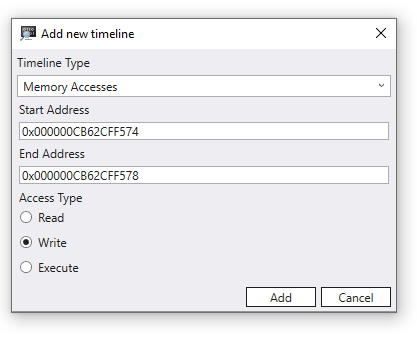
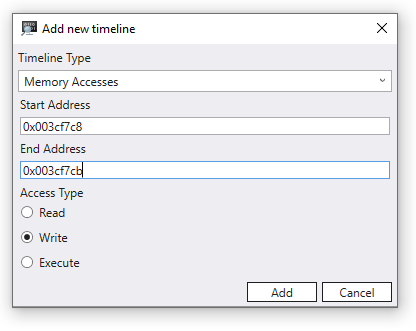
After a memory location of interest is identified, use that value to add a memory access timeline. Select + Add timeline and fill in the starting address. Look at 4 bytes so that when you add them to the Start Address value of 003cf7c8, you have an End Address value of 003cf7cb. The default is to look at all memory writes, but you can also look at only writes or code execution at that address.
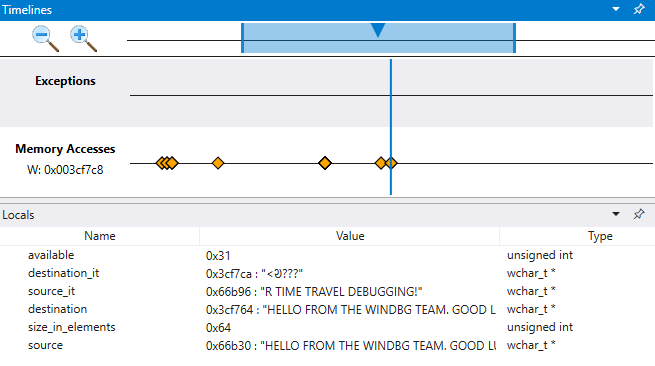
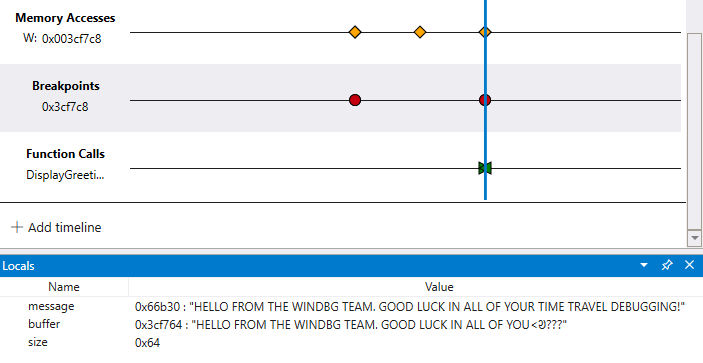
Now you can traverse the timeline in reverse to examine at what point in this time travel trace this memory location was written to see what you can find. When you select this position in the timeline, you can see that locals value different values for the string being copied. The destination value appears to be incomplete, as if the length of your string isn't correct.
Breakpoint timeline
Using breakpoints is a common approach to pause code execution at some event of interest. With TTD, you can set a breakpoint and travel back in time until that breakpoint is hit after the trace is recorded. The ability to examine the process state after an issue occurs, to determine the best location for a breakpoint, enables more debugging workflows unique to TTD.
To explore an alternative timeline debugging technique, select the exception in the timeline and once again travel three steps back by using the Step Into Back command on the Home ribbon.
In this small sample, it's easy to look in the code. If you have hundreds of lines of code and dozens of subroutines, use the techniques described here to decrease the time necessary to locate the issue.
As mentioned earlier, the base pointer (esp) points to your message text instead of pointing to an instruction.
Use the ba command to set a breakpoint on memory access. You set a w - write breakpoint to see when this area of memory is written to.
0:000> ba w4 003cf7c8
Although you use a simple memory access breakpoint, you can construct breakpoints to be more complex conditional statements. For more information, see bp, bu, bm (Set Breakpoint).
On the Home menu, select Go Back to travel back in time until the breakpoint is hit.
At this point, you can examine the program stack to see what code is active.
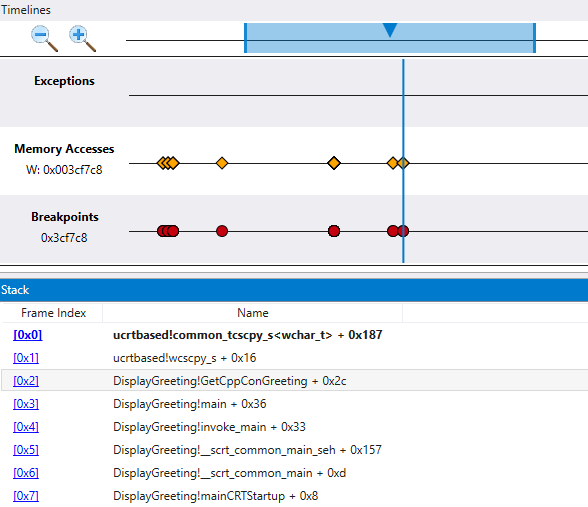
Because it's unlikely that the Microsoft-provided wscpy_s() function might have a code bug like this, look further in the stack. The stack shows that Greeting!main calls Greeting!GetCppConGreeting. In your small code sample, you could open the code at this point and likely find the error easily. But to illustrate the techniques that you can use with a larger, more complex program, you add a function call timeline.
Function call timeline
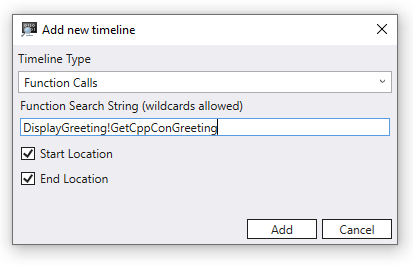
Select + Add timeline and fill in DisplayGreeting!GetCppConGreeting for the function search string.
The Start Location and End Location checkboxes indicate the start and end of a function call in the trace.
You can use the dx command to display the function call object to see the associated TimeStart and TimeEnd fields that correspond to the start location and end location of the function call.
dx @$cursession.TTD.Calls("DisplayGreeting!GetCppConGreeting")[0x0]
    EventType        : 0x0
    ThreadId         : 0x6600
    UniqueThreadId   : 0x2
    TimeStart        : 6D:BD [Time Travel]
    SystemTimeStart  : Thursday, October 31, 2019 23:36:05
    TimeEnd          : 6D:742 [Time Travel]
    SystemTimeEnd    : Thursday, October 31, 2019 23:36:05
    Function         : DisplayGreeting!GetCppConGreeting
    FunctionAddress  : 0x615a0
    ReturnAddress    : 0x61746
    Parameters
Either one of the Start Location or End Location checkboxes or both of the Start Location and End Location checkboxes must be selected.
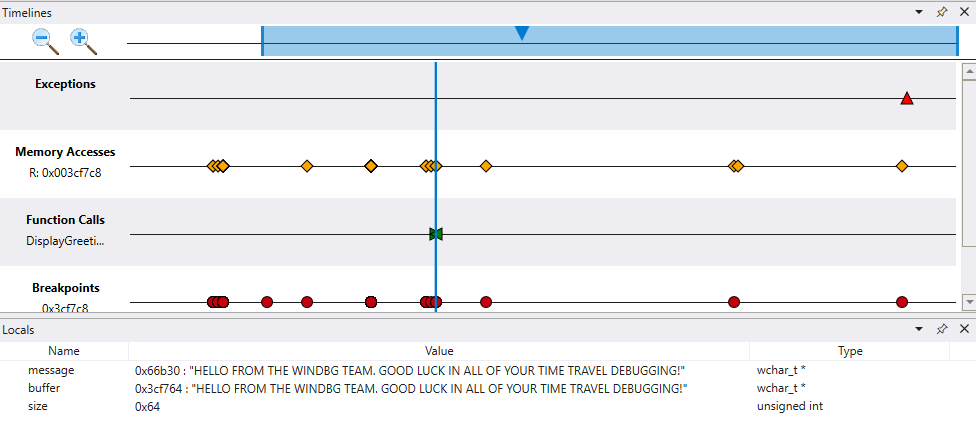
Your code isn't recursive or re-entrant, so it's easy to locate on the timeline when the GetCppConGreeting method is called. The call to GetCppConGreeting also occurs at the same time as your breakpoint and the memory access event that you defined. So it looks like you narrowed in on an area of code to look at carefully for the root cause of the application crash.
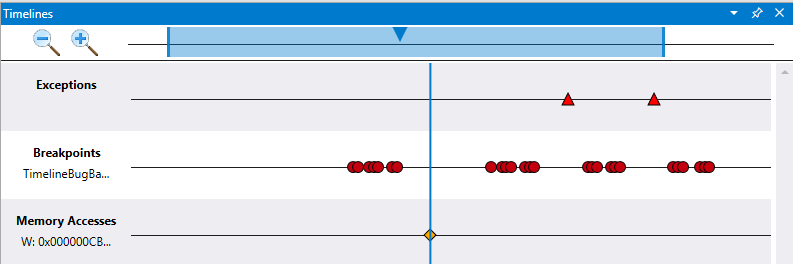
Explore code execution by viewing multiple timelines
Although our code sample is small, the technique of using multiple timelines allows for visual exploration of a time travel trace. You can look across the trace file to ask questions, such as, "When is an area of memory accessed before a breakpoint is hit?".
The ability to see more correlations and find unexpected things differentiates the timeline tool from interacting with the time travel trace by using command-line commands.
Timeline bookmarks
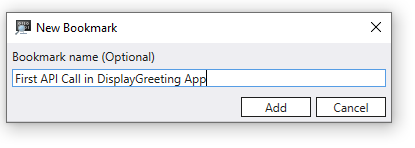
Bookmark important time travel positions in WinDbg instead of manually copy and pasting the position to Notepad. Bookmarks make it easier to view at a glance different positions in the trace relative to other events and to annotate them.
You can provide a descriptive name for bookmarks.
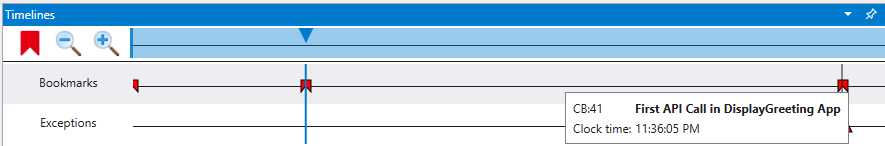
Select View > Timeline to open the Timelines window so that you can access the Bookmarks timeline. When you hover over a bookmark, the bookmark name appears.
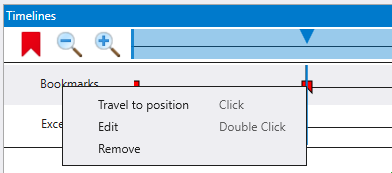
Right-click the bookmark to travel to the bookmark position, rename the bookmark, or delete it.
Note
The bookmark feature isn't available in version 1.2402.24001.0 of WinDbg.