WinDbg - View Menu
![]()
This section describes how work with the view menu in WinDbg.
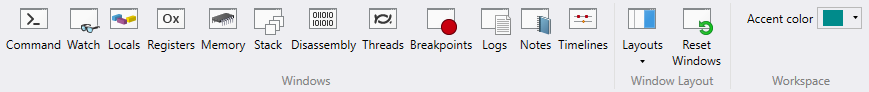
The view menu will open a new Window for each item, or bring focus to the existing Window, if one is already open.
Command
The command Window allows you to enter debugger commands. For more information about debugger commands, see Debugger Commands.
Watch
The watch Window allows you to watch local variables and registers.
The locals and watch windows are both based off of the data model that is used by the dx command. This means the locals and watch windows will benefit from any NatVis or JavaScript extensions you have loaded, and support full LINQ queries, just like the dx command. For more information about the data model, see WinDbg - Data Model.
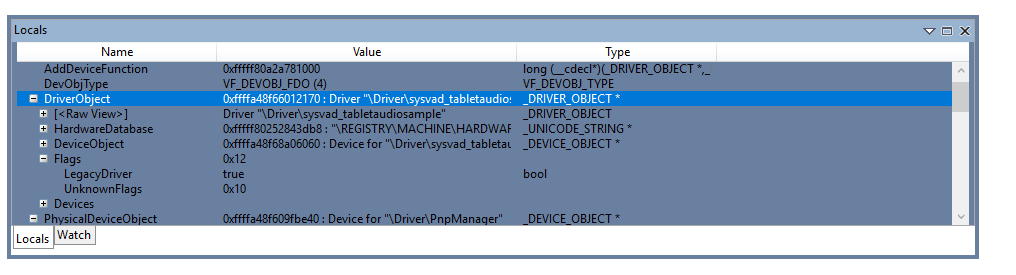
Locals
The locals window displays information about all of the local variables in the current scope. The locals window will highlight values that have changed during the previous code execution.
Registers
Registers displays the contents of the processors registers when they are available. For more information about registers, see Registers and Viewing and Editing Registers in WinDbg (Classic).
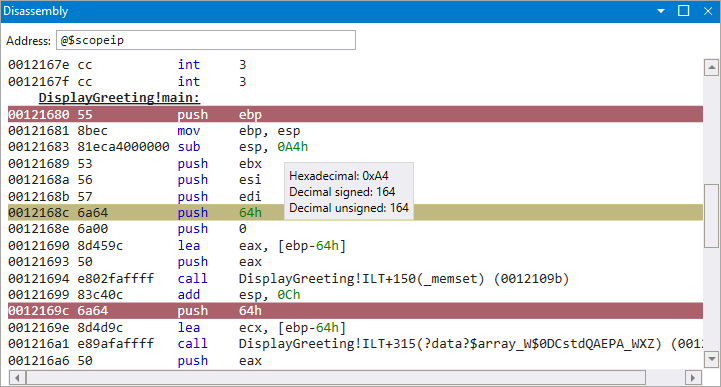
Memory
Use the memory window to display memory locations. In addition to providing a memory address, you can use the Pseudo-Register values such as $scopeip and $eventip to examine memory. Pre-append the @ symbol to use the pseudo-register values in the memory window, for example, @$scopeip. For more information, see Pseudo-Register Syntax
Stack
Use the stack Window to view the current call stack. The stack window provides basic highlighting of the current frame.
Disassembly
The disassembly window highlights the current instruction and retains that position when you scroll.
Threads
The threads window highlights the current thread.
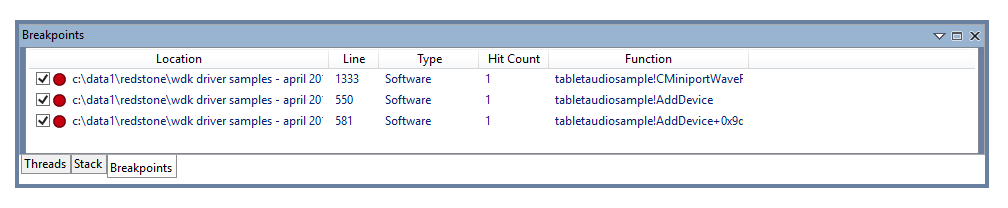
Breakpoints
Use the breakpoints window to view, enable and clear breakpoints.
Logs
This log is of the WinDbg internals. It can be viewed to monitor long running processes and for troubleshooting the debugger itself.
You can continue to create a traditional debugger command log, using the .logopen command. For more information on that, see Keeping a Log File in WinDbg.
Notes
Use the Notes option to open a note taking window.
Timelines
Use Timelines to open or bring focus to the timelines window. For more information on timelines, see WinDbg - Timelines.
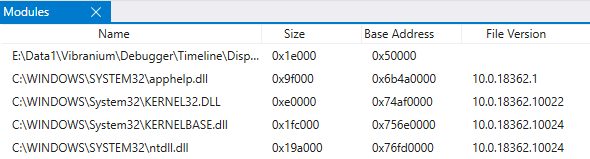
Modules
Use modules to display loaded modules and their related information. Modules displays the following:
- The name of the module including the path location
- The size in bytes of the loaded module
- The base address that the module is loaded at
- The file version
Layouts
Use the Layouts pull down menu to select from three window layouts.
Reset Windows
Use this function to reset the debugger windows to their default positions.
Accent Color
Use the pull down menu to set the accent color for the debugger.
See Also
Feedback
Coming soon: Throughout 2024 we will be phasing out GitHub Issues as the feedback mechanism for content and replacing it with a new feedback system. For more information see: https://aka.ms/ContentUserFeedback.
Submit and view feedback for