Note
Access to this page requires authorization. You can try signing in or changing directories.
Access to this page requires authorization. You can try changing directories.
![]()
This article describes how to start a remote, process server, or dump file session with WinDbg.
Remote debug server
Use this option to connect to a remote debugging server.
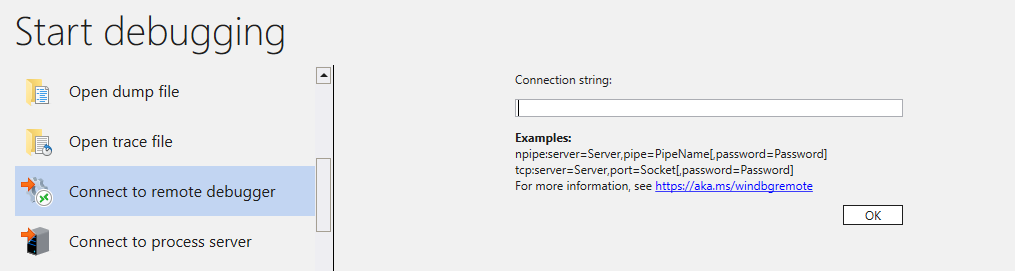
Remote debugging involves two debuggers running at two different locations. The debugger that performs the debugging is called the debugging server. The second debugger, called the debugging client, controls the debugging session from a remote location. To establish a remote session, you must set up the debugging server first and then connect to it with the debugging client.
For more information about remote sessions, see Remote WinDbg features.
Process debug server
Remote debugging through a process server involves running a small application called a process server on the server computer. Then a user-mode debugger is started on the client computer. This debugger is called the smart client because it does all the actual processing.
For more information about process server sessions, see Process servers (user mode).
Open a dump file
To open a dump file, browse to the file that you want in the provided file dialog and open it.
For more information about the different types of dump files, see Analyze crash dump files by using WinDbg.