Note
Access to this page requires authorization. You can try signing in or changing directories.
Access to this page requires authorization. You can try changing directories.
We are thrilled to introduce the latest version of the Windows Performance Toolkit (WPT), packed with several exciting new features detailed below. Download the Windows ADK Toolkit to use these new features.
Windows Performance Recorder
NPU profile: In the era where Artificial Intelligence (AI) and Machine Learning (ML) are not just buzzwords but essential drivers of innovation, the importance of specialized hardware like Neural Processing Units (NPU) cannot be overstated. Recognizing this, we're excited to unveil a Neural Processing profile within the Windows Performance Recorder (WPR.exe & WPRUI.exe) to record NPU usage and new table & graphs in Windows Performance Analyzer (WPA).
You can use the command line as follows to collect NPU trace event
wpr.exe -start NeuralProcessing -filemode
Note: its important to use the -filemode so that events are recorded in a file and not in the memory.
You can also use the WPRUI.exe to collect the trace using the UI interface. It is available under "Resource Analysis" section

Windows Performance Analyzer
For the first time in a decade, we are introducing a new welcome/launcher screen in Windows Performance Analyzer (WPA). This screen is an integral part of the WPA, designed to streamline the workflow for users by enabling pre-analysis configuration. The new WPA Launcher provides convenient access point for recently used files, settings configuration, plugin management, Getting Started documentation, and many other features.
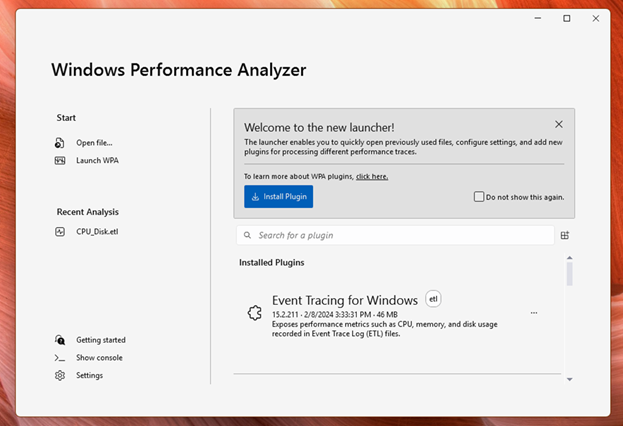
Launcher Features
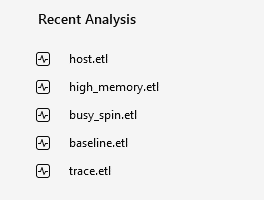
Quick Open of Recently Used Files: The launcher displays a list of recently used files, allowing users to resume work on their last performance traces effortlessly.
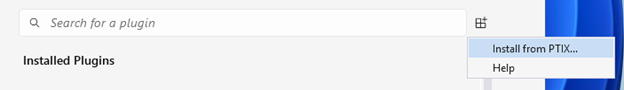
Plugin Management: The launcher provides a platform to install and manage plugins that enhance & extend the functionality of WPA.
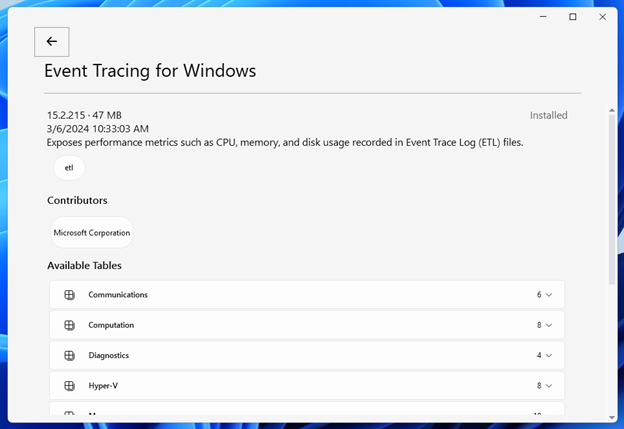
Once a plugin PTIX is installed, users can navigate to a screen to view information about its authors, tables, and supported filetypes.
Settings Configuration: For the first time, WPA has one location within the launcher to manage various settings across the application. The settings page includes ability for users to modify application text, toggle light or dark mode, and easily copy WPA about information for troubleshooting.

Trace grouping control: In some cases when multiple files are opened at the same time, there are multiple ways WPA can group the opened files together into analysis sessions. The launcher will detect these scenarios and prompt the user to configure how their selected traces should be processed.
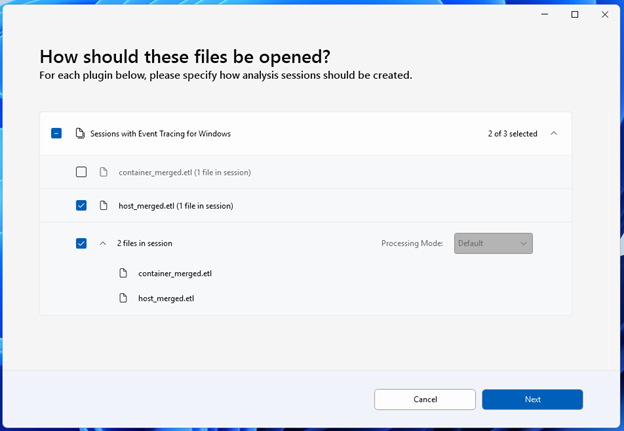
Table selection: To reduce the time it takes to process large trace files, the launcher allows the user to select which tables should be enabled for processing when files are opened.
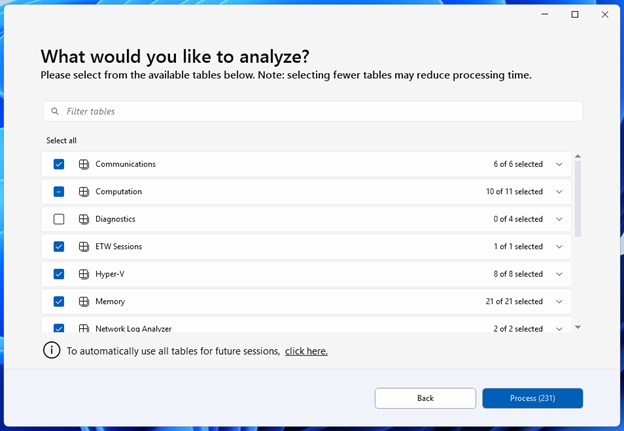
The user can configure both when this table selection screen appears and what its default selection is in the WPA settings page.

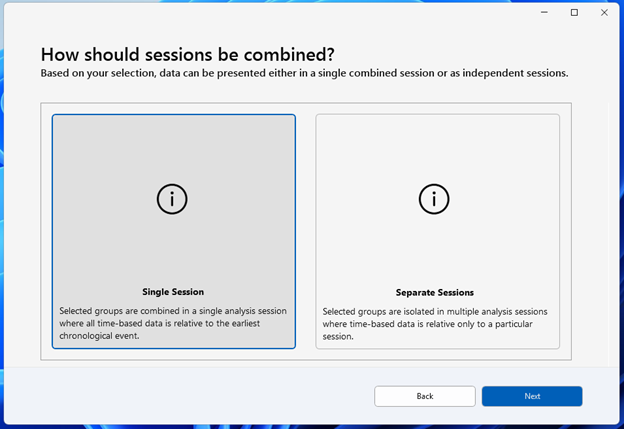
Analysis session combining: When multiple plugins process files at the same time, WPA can combine their results into a single analysis view, using what was previously referred to as a "unified" or "together" processing mode. The WPA launcher simplifies configuring this type of analysis by detecting when results can be combined and asking the user how they would like to open their sessions.
Other Features
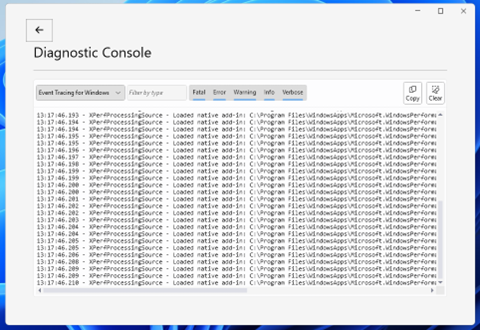
Refreshed diagnostic console: The Diagnostics console has been revamped with better grouping/filtering support. Diagnostics are now logged in respective "channels" based on which component logged a given message. The user can now filter logs based on the log level and logging type.
NPU Analysis:
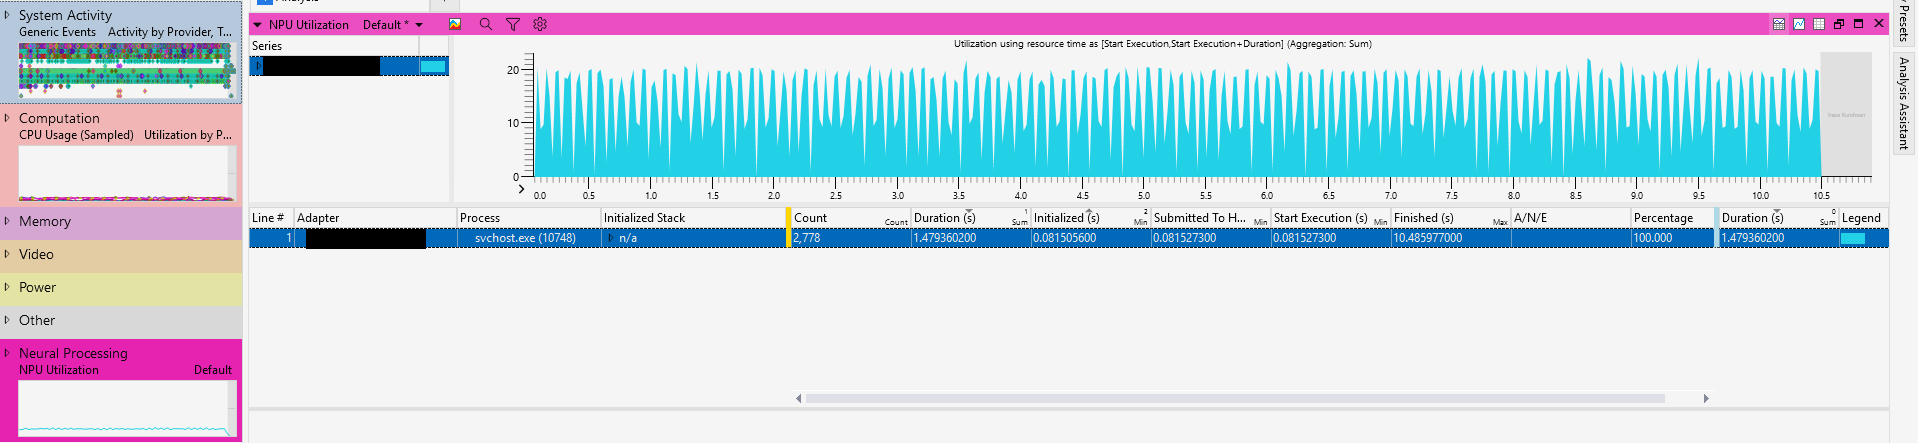
If you're delving into the Neural Processing Unit (NPU) trace analysis, then you'll be pleased to know that it now offers enhanced features for presenting Neural Processing Units (NPU) trace data. This addition is particularly useful for those who collect traces using WPR's new neural processing profile (see above). When you use this profile, WPA provides a newly introduced table and graph designed specifically to display NPU trace data. Here's what you can expect:
New Table: This table is a key addition, helping you quickly identify the relevant Adapter associated with the NPU unit. This simplifies the process of locating the specific hardware component being analyzed. From the table, you can drill down into more detailed aspects, such as the Initialized Stack. This feature is invaluable for deeper analysis and troubleshooting, providing insights into the operational specifics of the NPU during the trace.
Graphical Representation: Alongside the table, there's a new graph that visually represents the trace data. This graphical element makes it easier to comprehend the flow and interactions within the NPU during the trace period.
New Gantt chart modes: Timeline views were hard to visualize but with the new Gantt chart modes, users can visualize the timeline to help them understand the parent-child relationships. You can select the Grant chart mode by clicking on the button besides the chart preset dropdown. You have two modes "Combine as Grouped" and "Combine as Related"
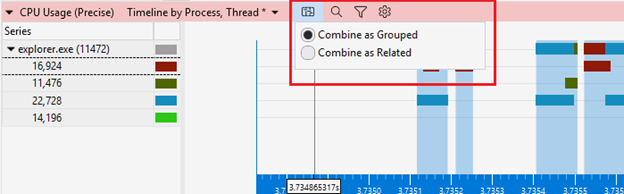
Combine as Grouped: This is the most common Gantt chart mode. The relationship is 1:1 with the group of the table. In the below graph, several new thread Id are grouped under Explorer.exe.
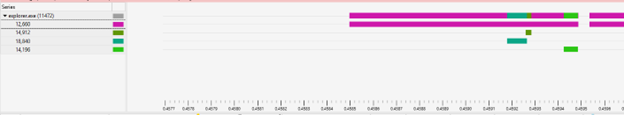
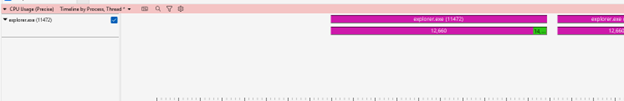
Combine as Related: This Gantt chart mode illustrates the timeline and interdependencies of various tasks within a collection & its grouped by their relationships to their parent group. In the below image, as we drill into Explorer.exe, we can see the data points converging, all linked to the parent group.
Known Issues
Missing tooltips for table column headers:
- Some tables do not display tooltips for their column headers.
Profile argument behavior:
- When using the
-profilecommand line argument to open WPA, the specified profile is applied to all future traces opened within that WPA session.
- When using the
Plugin loading crash with -addsearchdir:
- Loading a plugin with the
-addsearchdircommand line argument might cause WPA to crash with an exception: "Value cannot be null (parameter source)." This issue occurs if one of the loaded processing sources has an overriddenGetAboutInfomethod that returns aProcessingSourceInfoinstance with missing properties. Plugin developers must ensure theirProcessingSourceInfoinstance correctly sets all required properties to prevent this crash.
- Loading a plugin with the
Gantt chart snapping
- WPA may crash if you hold Shift while click dragging the mouse over a Gantt chart for time selection, and the mouse cursor moves past the right edge of the viewport.
We value your feedback and suggestions. Please use the Feedback Hub, accessible from the bottom of the Settings page, to share your thoughts and let us know how we're doing.