Note
Access to this page requires authorization. You can try signing in or changing directories.
Access to this page requires authorization. You can try changing directories.
Packet Monitor (Pktmon) is an in-box, cross-component network diagnostics tool for Windows. It can be used for packet capture, packet drop detection, packet filtering and counting. The tool is especially helpful in virtualization scenarios, like container networking and SDN, because it provides visibility within the networking stack. It's available in-box via the pktmon.exe command and via Windows Admin Center extensions.
Overview
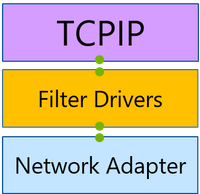
Any machine that communicates over the network has at least one network adapter. All the components between this adapter and an application form a networking stack: a set of networking components that process and move networking traffic. In traditional scenarios, the networking stack is small, and all the packet routing and switching happens in external devices.
However, with the advent of network virtualization, the size of the networking stack has multiplied. This extended networking stack now includes components like the Virtual Switch that handle packet processing and switching. Such a flexible environment allows for better resource utilization and security isolation, but it also leaves more room for configuration mistakes that can be hard to diagnose. Packet Monitor provides the enhanced visibility within the networking stack that is often needed to pinpoint these mistakes.
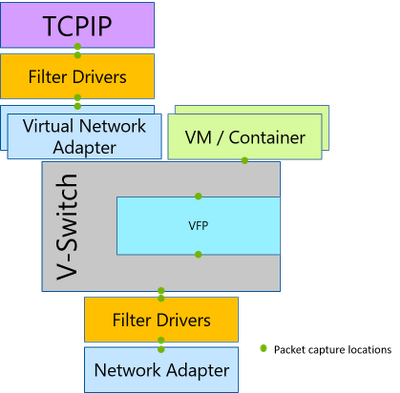
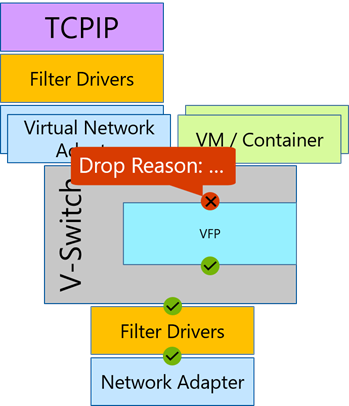
Packet Monitor intercepts packets at multiple locations throughout the networking stack, exposing the packet route. If a packet was dropped by a supported component in the networking stack, Packet Monitor reports that packet drop. This allows users to differentiate between a component that is the intended destination for a packet and a component that is interfering with a packet. Additionally, Packet Monitor reports drop reasons; for example, MTU Mismatch, or Filtered VLAN, etc. These drop reasons provide the root cause of the issue without the need to exhaust all the possibilities. Packet Monitor also provides packet counters for each intercept point, enabling a high-level packet flow examination without the need for time-consuming log analysis.
Best Practices
Use these best practices for streamlining your network analysis.
- Check command-line help for arguments and capabilities (
pktmon /?). - Configure packet filters matching your scenario (pktmon filter add).
- Check packet counters during the experiment for high level view (pktmon counters).
- Look into the log for detailed analysis (pktmon format pktmon.etl).
Functionality
Packet Monitor offers the following functionality:
- Packet monitoring and counting at multiple locations along the networking stack
- Packets drop detection at multiple stack locations
- Flexible runtime packet filtering with encapsulation support
- General logging and tracing support (ETW and WPP events)
- TXT log analysis based on TcpDump packet parsing
- Multiple logging modes: real-time, high volume in-memory, multi-file, circular
- Ethernet, Wi-Fi, and mobile broadband media type support
- PCAPNG format support
Get started with Packet Monitor
The following resources are available to help you get started using Packet Monitor.
Pktmon command syntax and formatting
Packet Monitor is available in-box via pktmon.exe command on Vibranium OS (build 19041).
Packet Monitoring Extension in Windows Admin Center
The Packet Monitoring extension allows you to operate and consume Packet Monitor through Windows Admin Center. The extension helps you diagnose your network by capturing and displaying network traffic through the networking stack in a log that is easy to follow and manipulate.
SDN Data Path Diagnostics extension in Windows Admin Center
SDN Data Path Diagnostics is a tool within the SDN monitoring extension of Windows Admin Center. The tool automates Packet Monitor-based packet captures according to various SDN scenarios, and presents the output in a single view that is easy to follow and manipulate.
Microsoft Network Monitor (Netmon) support
Packet Monitor generates logs in ETL format. These logs can be analyzed using Microsoft Network Monitor (Netmon) by using special parsers.
Wireshark (pcapng format) support
Packet Monitor can convert logs to pcapng format. These logs can be analyzed using Wireshark (or any pcapng analyzer).
Provide feedback to engineering team
Report any bugs or give feedback through the feedback hub using the following steps:
Launch Feedback Hub through the Start menu.
Select either the Report a problem button or the Suggest a feature button.
Provide meaningful feedback title in Summarize your issue box.
Provide details and steps to reproduce the issue in the Give us more detail box.
Select Network and Internet as the top category, then Packet Monitor (pktmon.exe) as the sub-category.
To help us identify and fix the bug faster, capture screenshots, attach pktmon’s output log, and/or recreate the problem.
Select Submit.