Common report configurations
Below are the most common report configurations in Yield Analytics:
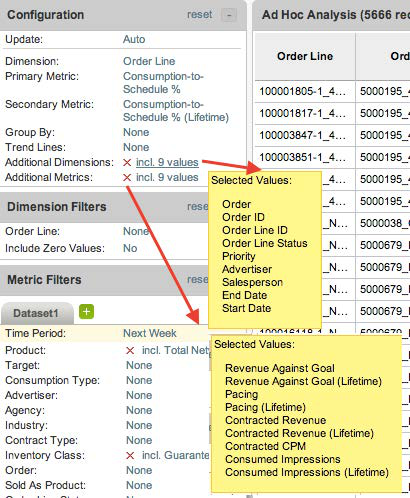
At risk report
Customers use this to understand which order lines are projected to underdeliver.
Configuration:
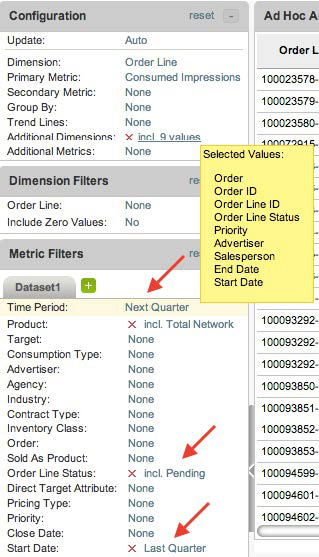
Zombie order line report
Customers use this report to understand if there are any order lines allocating inventory that are in a paused status and may need to be cancelled out.
Configuration:
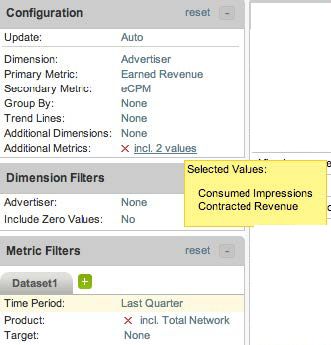
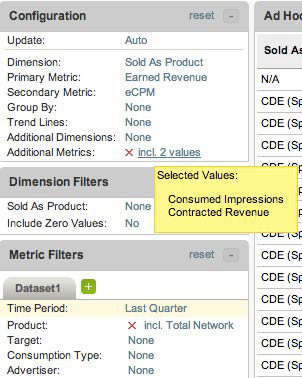
Advertiser scorecard
Customers use this report to track KPIs for their top advertiser accounts, such as revenue, yield, and consumption.
Configuration:
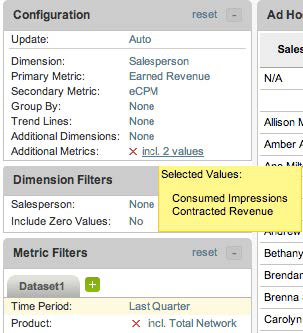
Sales scorecard
Customers use this report to track KPIs for their top sales reps, such as revenue, yield, and consumption.
Configuration:
Pricing dashboard
Customers use this report to quickly access historical pricing trends by product, based on the way they sell.
Configuration:
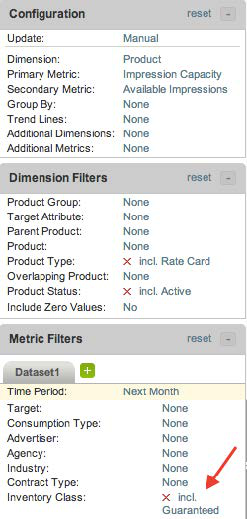
Availability dashboard
Customers use this report to quickly impression availability by product,- based on the way they traffic campaigns.
Configuration: