Exercise - Review water insights dashboards
In this exercise, you assume the role of Amber Rodriguez, sustainability specialist for Contoso Corp. Your task is to use the Water insights dashboards to gain insights.
Access the water insights dashboards
To access the water insights dashboards, follow these steps:
Important
Make sure that you've completed the previous exercise to ensure that the dashboards and reports show meaningful data.
In the left navigation pane, select Analytics > Water insights.
Review the dashboards in the following two tabs:
Water quantity (the default view)
Water quality
Water insights
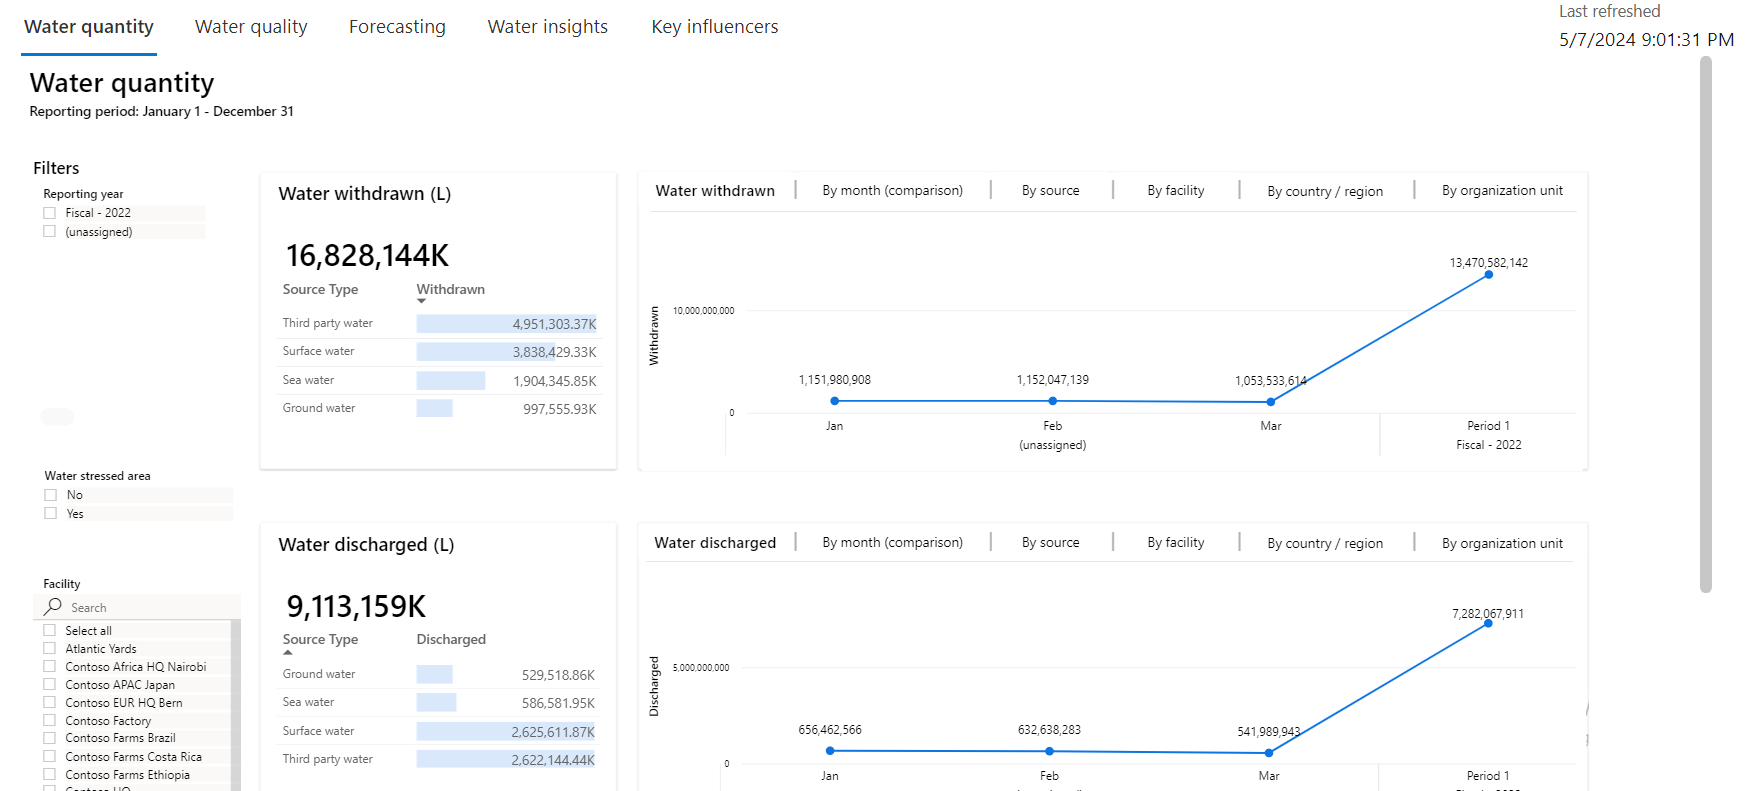

Review the Water quantity dashboard
You can view your organization’s water quantity transaction related data at a facility or organizational unit level for a reporting period. The water quantity transactions include water withdrawn, water discharged, water consumed, and water recycled.
To review the Water quantity dashboard, follow these steps:
Select the Water quantity tab.
The Water quantity tab opens by default.
To filter this dashboard, select a reporting period. The dashboard is divided into the following categories:
Water withdrawn
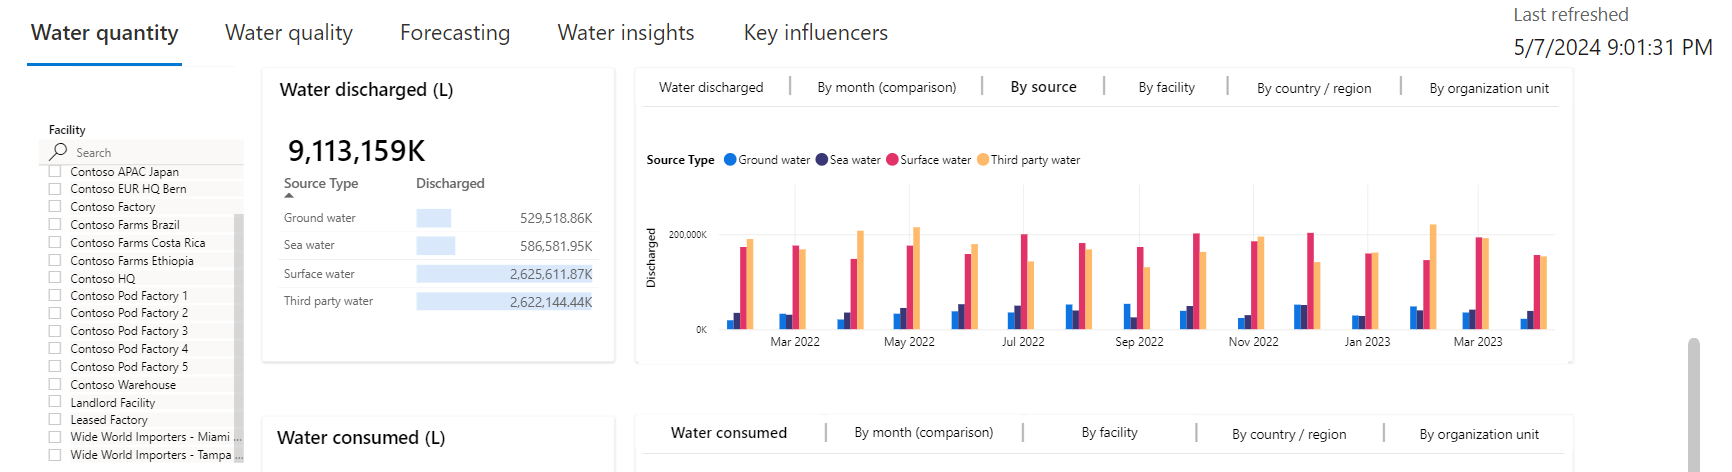
Water discharged
Water consumed
Water recycled
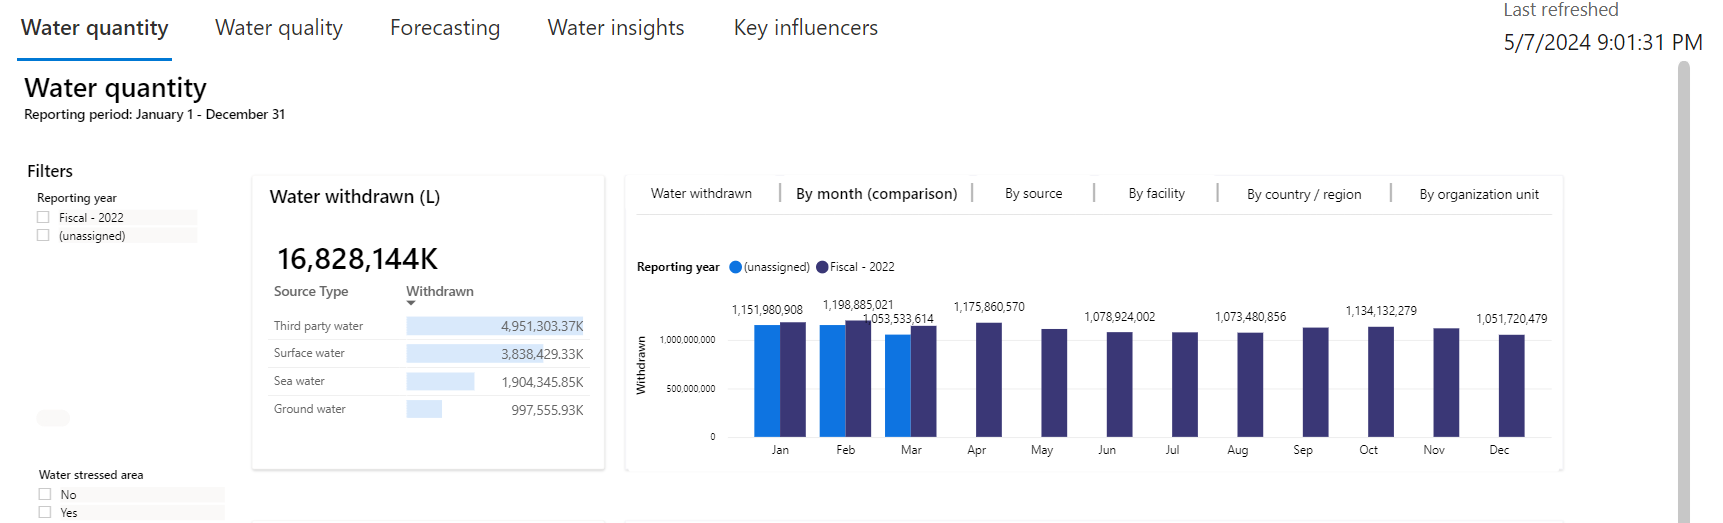
In the dashboard, the Water withdrawn and Water discharged tiles have five tabs:
By month (comparison)
By source
By facility
By country/region
By organizational unit
The Water consumed and Water recycled tiles have four tabs:
By month (comparison)
By facility
By country/region
By organizational unit
For the By month (comparison), By source, By facility, By country/region, and By organization unit tabs, when you select a specific option, data for the selected reporting period shows accordingly. When you select the water quantity transaction again, the details around each tab in the top tile are as follows:
- By month (comparison) - This tab shows the water quantity transaction breakdown by each month to compare.
- By source - This tab shows a breakdown of the water quantity transaction by source.
- By facility, By country/region, and By organization unit - These tabs show the water quantity transaction filtered by facility, country/region, and organization unit respectively.
Select the Wide World Importers - Miami Office and Wide World Importers - Tampa Office options.


The Water quantity report now shows water data analyzed with respect to all tabs that are available for each water quantity transaction.

Review the Water quality dashboard
You can view your organization’s water quality related data at a facility or organizational unit level by reporting period. The water quality transactions primarily consist of the quality information in waste water discharges from facilities.
Select the Water quality tab. You need to filter by reporting period. You can also filter by water quality characteristic, facility, or organizational hierarchy to view and analyze the data.

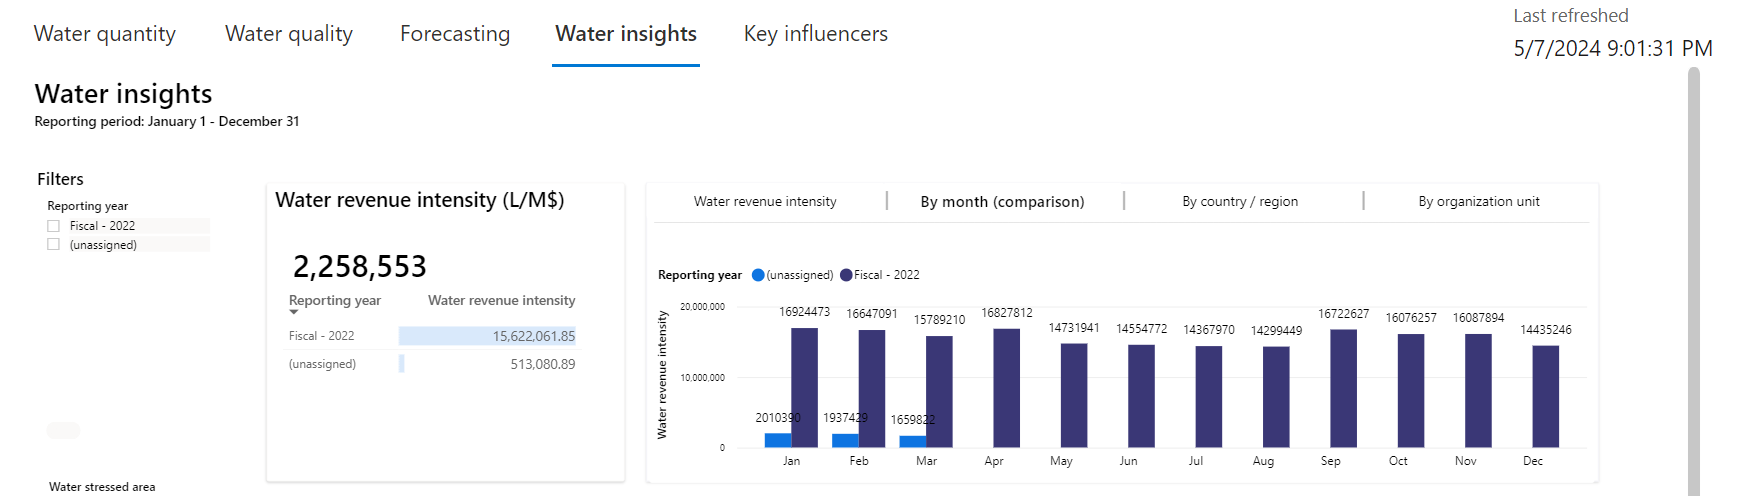
Review the Water insights dashboard
You can get a holistic view of your organization's water sustainability performance relative to the business. Based on the selected water transaction type, the tiles contain the following information about your organization:
Water revenue intensity
Water production intensity
To review the Water insights dashboard, follow these steps:
Select the Water insights tab.
To filter this dashboard, select a reporting period. You can also filter by water transaction type, water stressed area, or organizational hierarchy. The dashboard is divided into the following categories:
Water revenue intensity
Water production intensity
In the dashboard, the Water revenue intensity and Water production intensity tiles have four tabs:
By month (comparison)
By facility (only for water production intensity)
By country/region
By organization unit