Märkus.
Juurdepääs sellele lehele nõuab autoriseerimist. Võite proovida sisse logida või kausta vahetada.
Juurdepääs sellele lehele nõuab autoriseerimist. Võite proovida kausta vahetada.
Important
Azure Data Studio is retiring on February 28, 2026. We recommend that you use the MSSQL extension for Visual Studio Code. For more information about migrating to Visual Studio Code, visit What's happening to Azure Data Studio?
This tutorial demonstrates how to use your own insight queries to build custom insight widgets.
During this tutorial you learn how to:
- Run your own query and view it in a chart
- Build a custom insight widget from the chart
- Add the chart to a server or database dashboard
- Add details to your custom insight widget
Prerequisites
This tutorial requires the SQL Server or Azure SQL Database TutorialDB. To create the TutorialDB database, complete one of the following quickstarts:
- Connect and query SQL Server using Azure Data Studio
- Connect and query Azure SQL Database using Azure Data Studio
Run your own query and view the result in a chart view
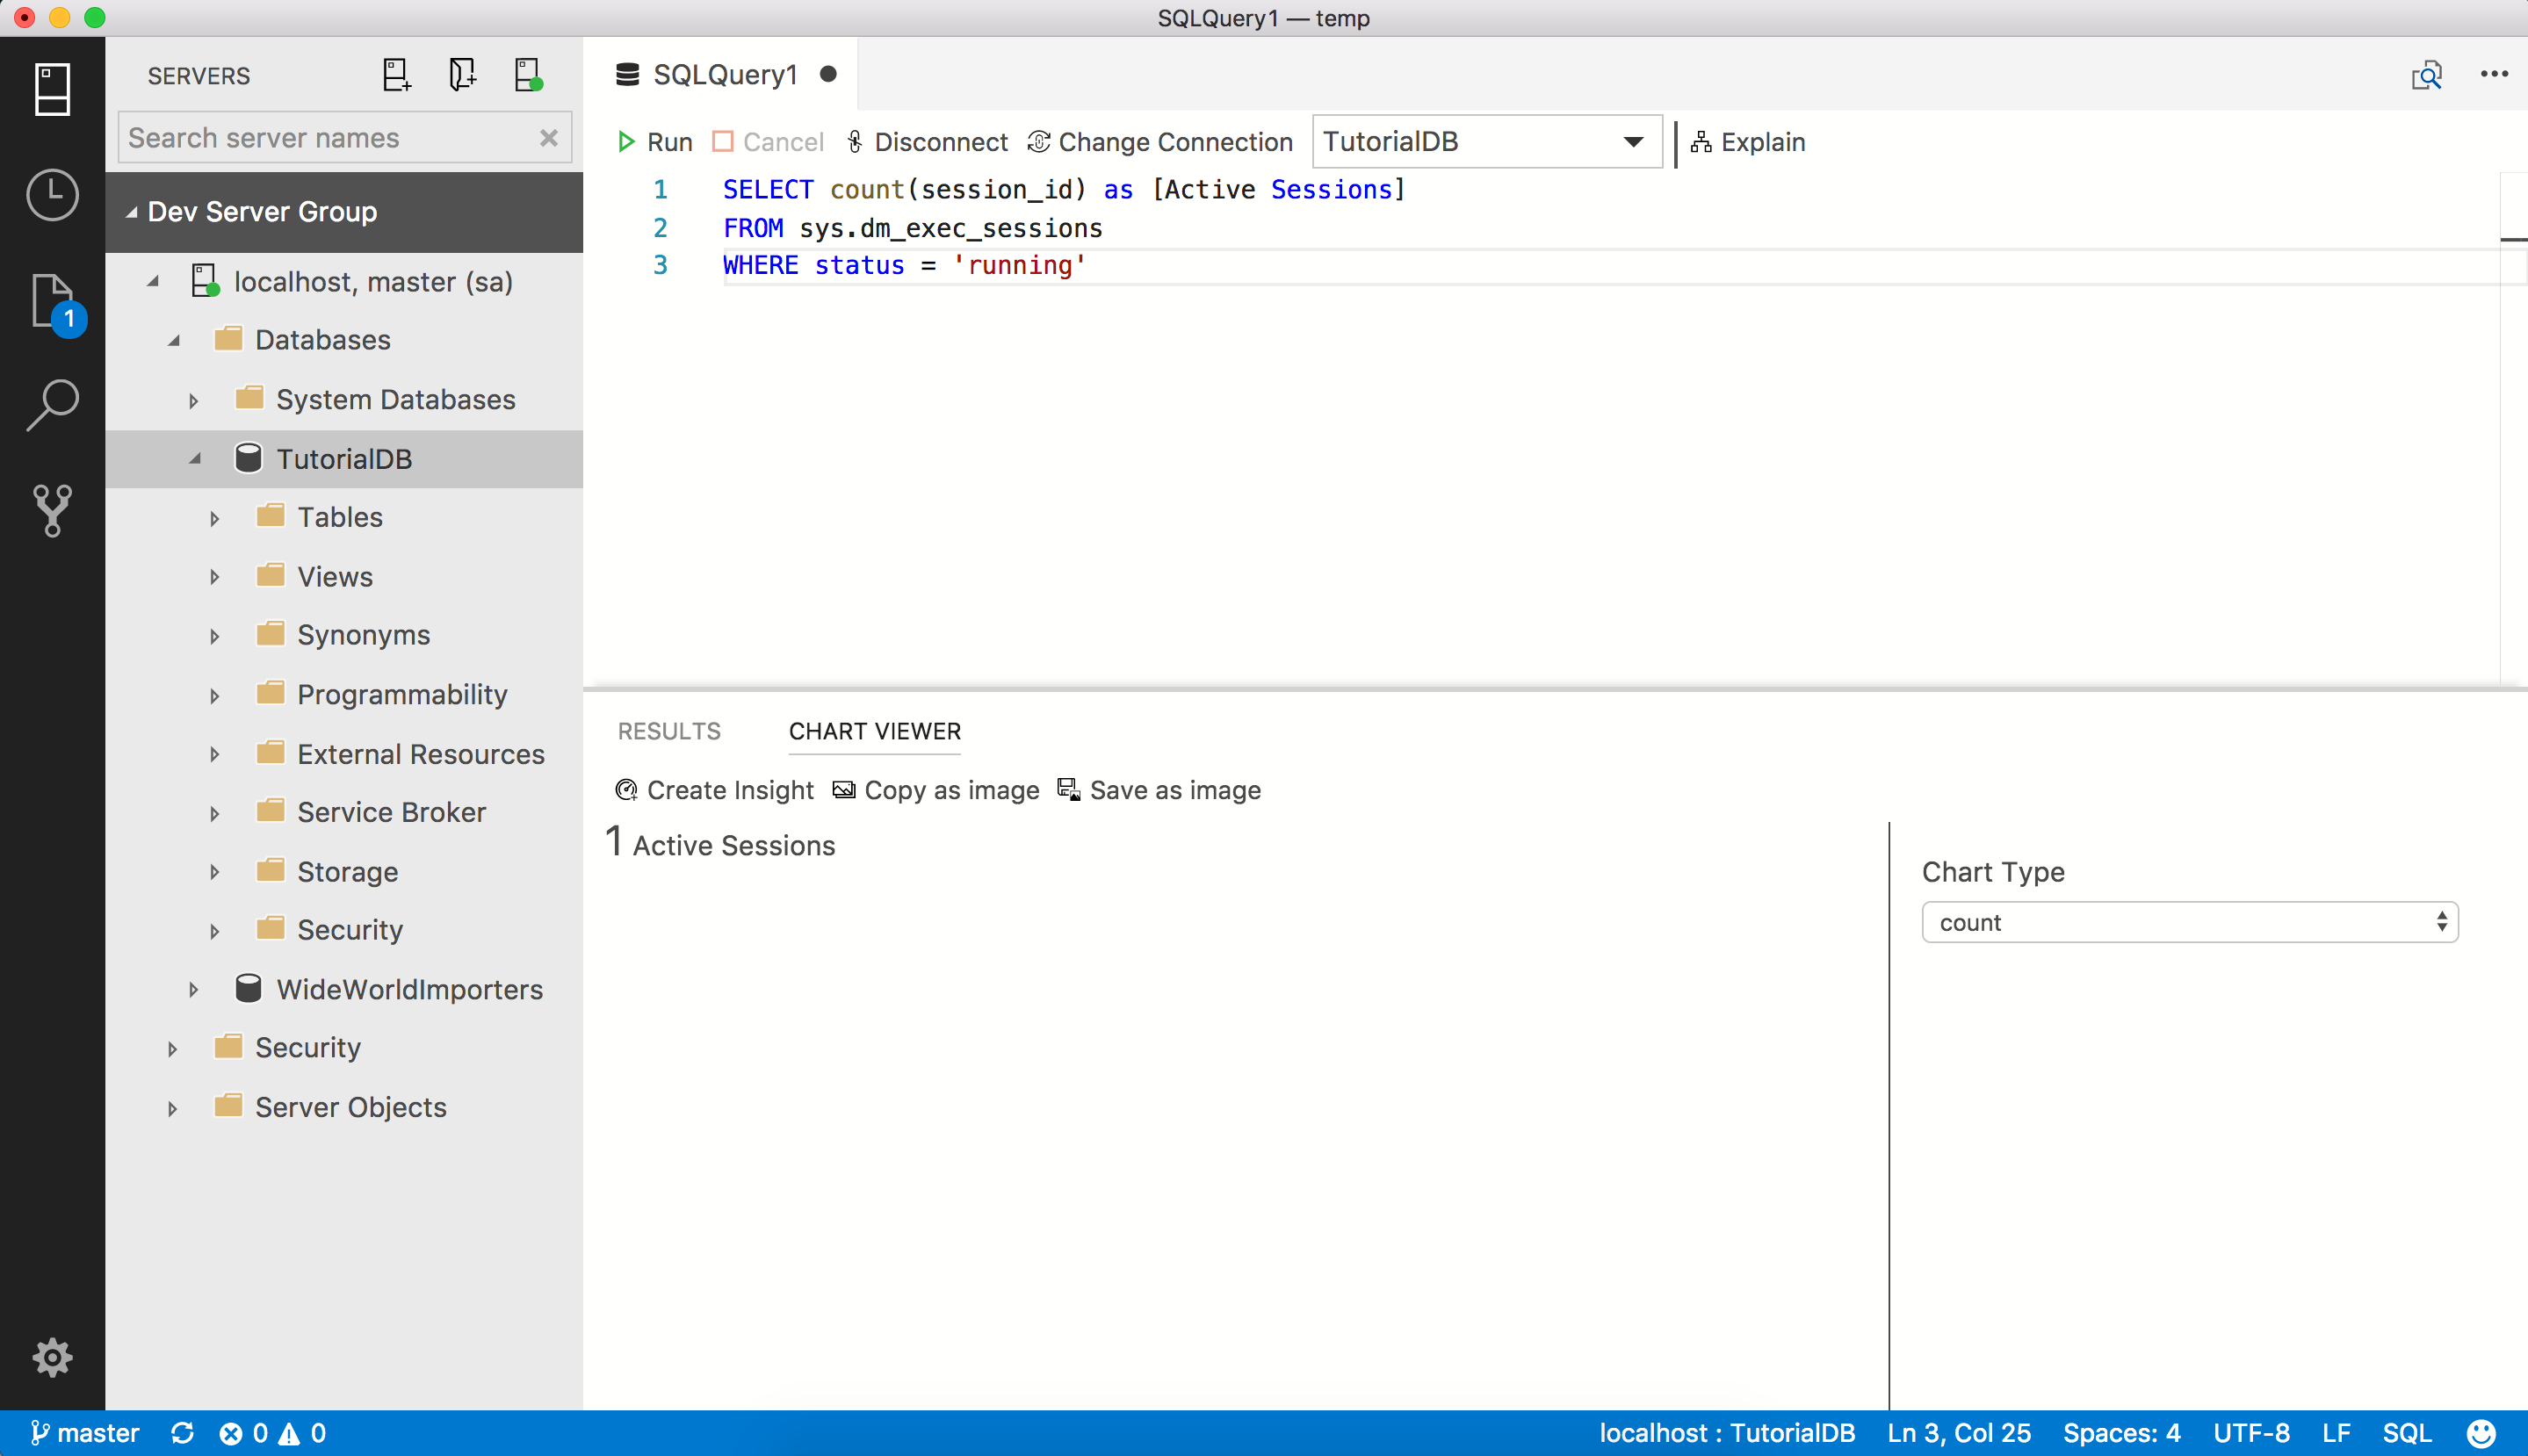
In this step, run a sql script to query the current active sessions.
To open a new editor, press Ctrl+N.
Change the connection context to TutorialDB.
Paste the following query into the query editor:
SELECT count(session_id) as [Active Sessions]
FROM sys.dm_exec_sessions
WHERE status = 'running'
Save the query in the editor to a *.sql file. For this tutorial, save the script as activeSession.sql.
To execute the query, press F5.
After the query results are displayed, click View as Chart, then click the Chart Viewer tab.
Change Chart Type to count. These settings render a count chart.
Add the custom insight to the database dashboard
To open the insight widget configuration, click Create Insight on Chart Viewer:

Copy the insight configuration (the JSON data).
Press Ctrl+Comma to open User Settings.
Type dashboard in Search Settings.
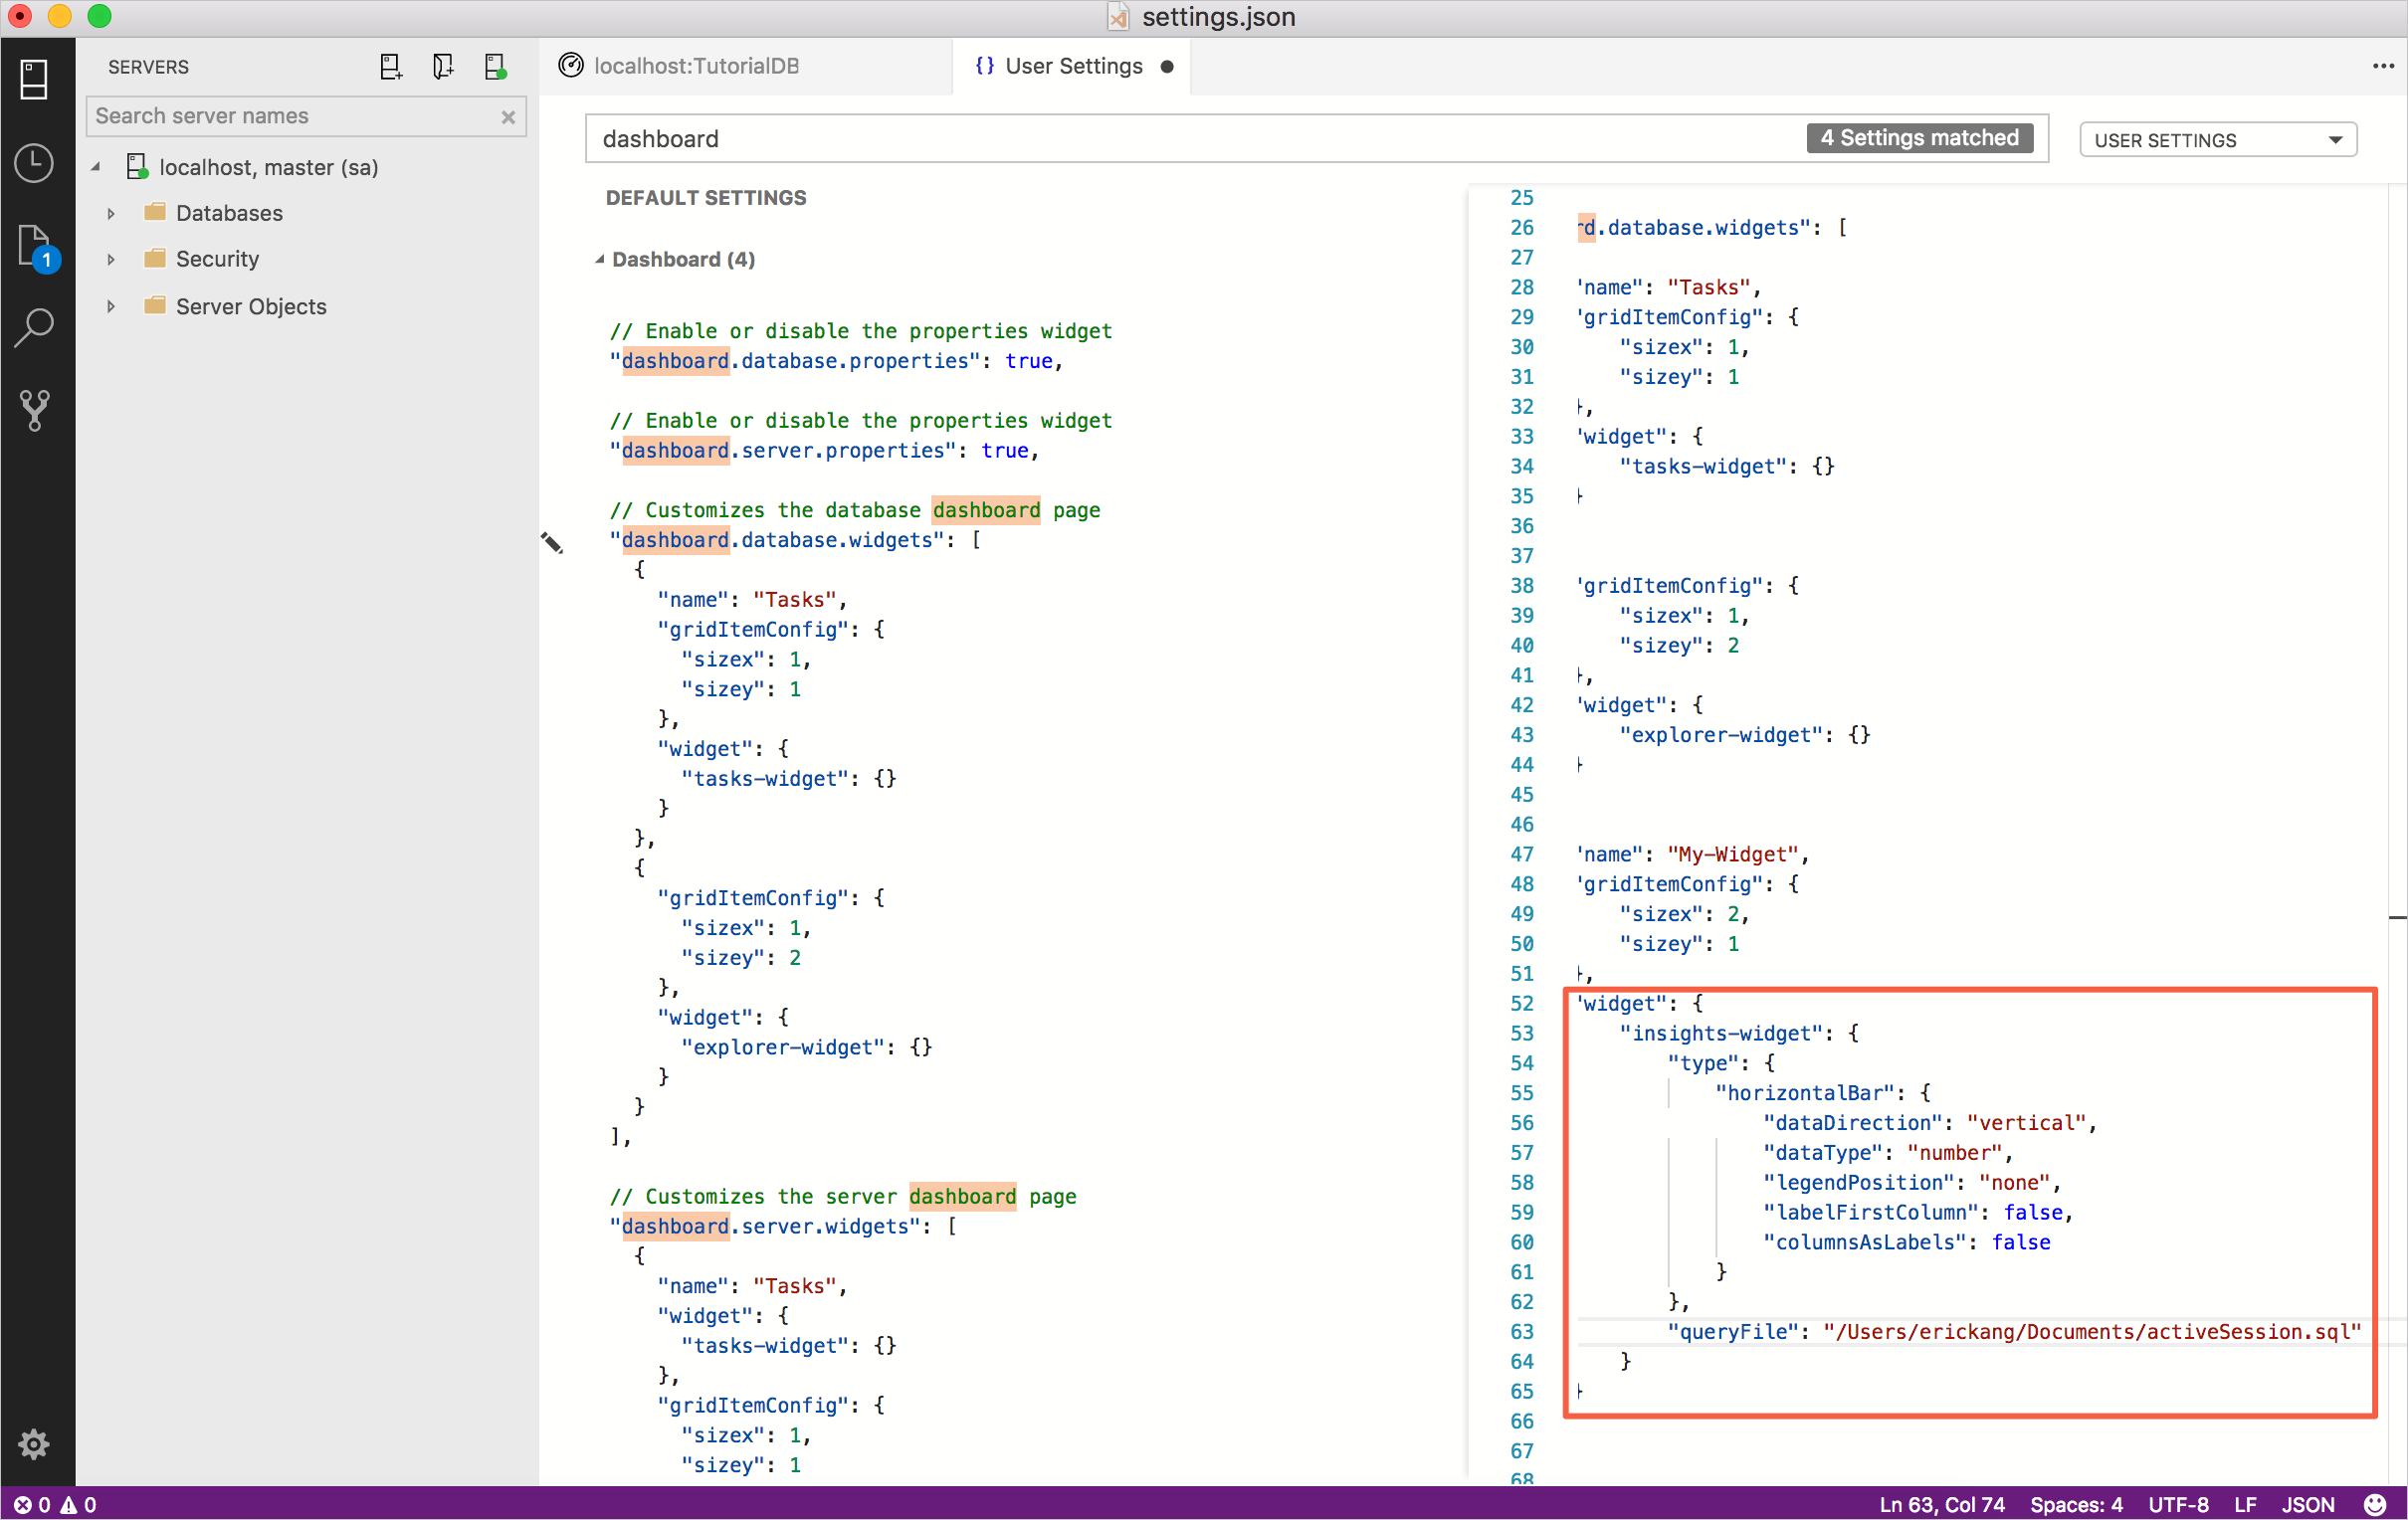
Click Edit for dashboard.database.widgets.

Paste the insight configuration JSON into dashboard.database.widgets. Database dashboard settings looks like the following:
 "dashboard.database.widgets": [
     {
         "name": "My-Widget",
         "gridItemConfig": {
             "sizex": 2,
             "sizey": 1
         },
         "widget": {
             "insights-widget": {
                 "type": {
                     "count": {
                         "dataDirection": "vertical",
                         "dataType": "number",
                         "legendPosition": "none",
                         "labelFirstColumn": false,
                         "columnsAsLabels": false
                     }
                 },
                 "queryFile": "{your file folder}/activeSession.sql"
             }
         }
     }
 ]
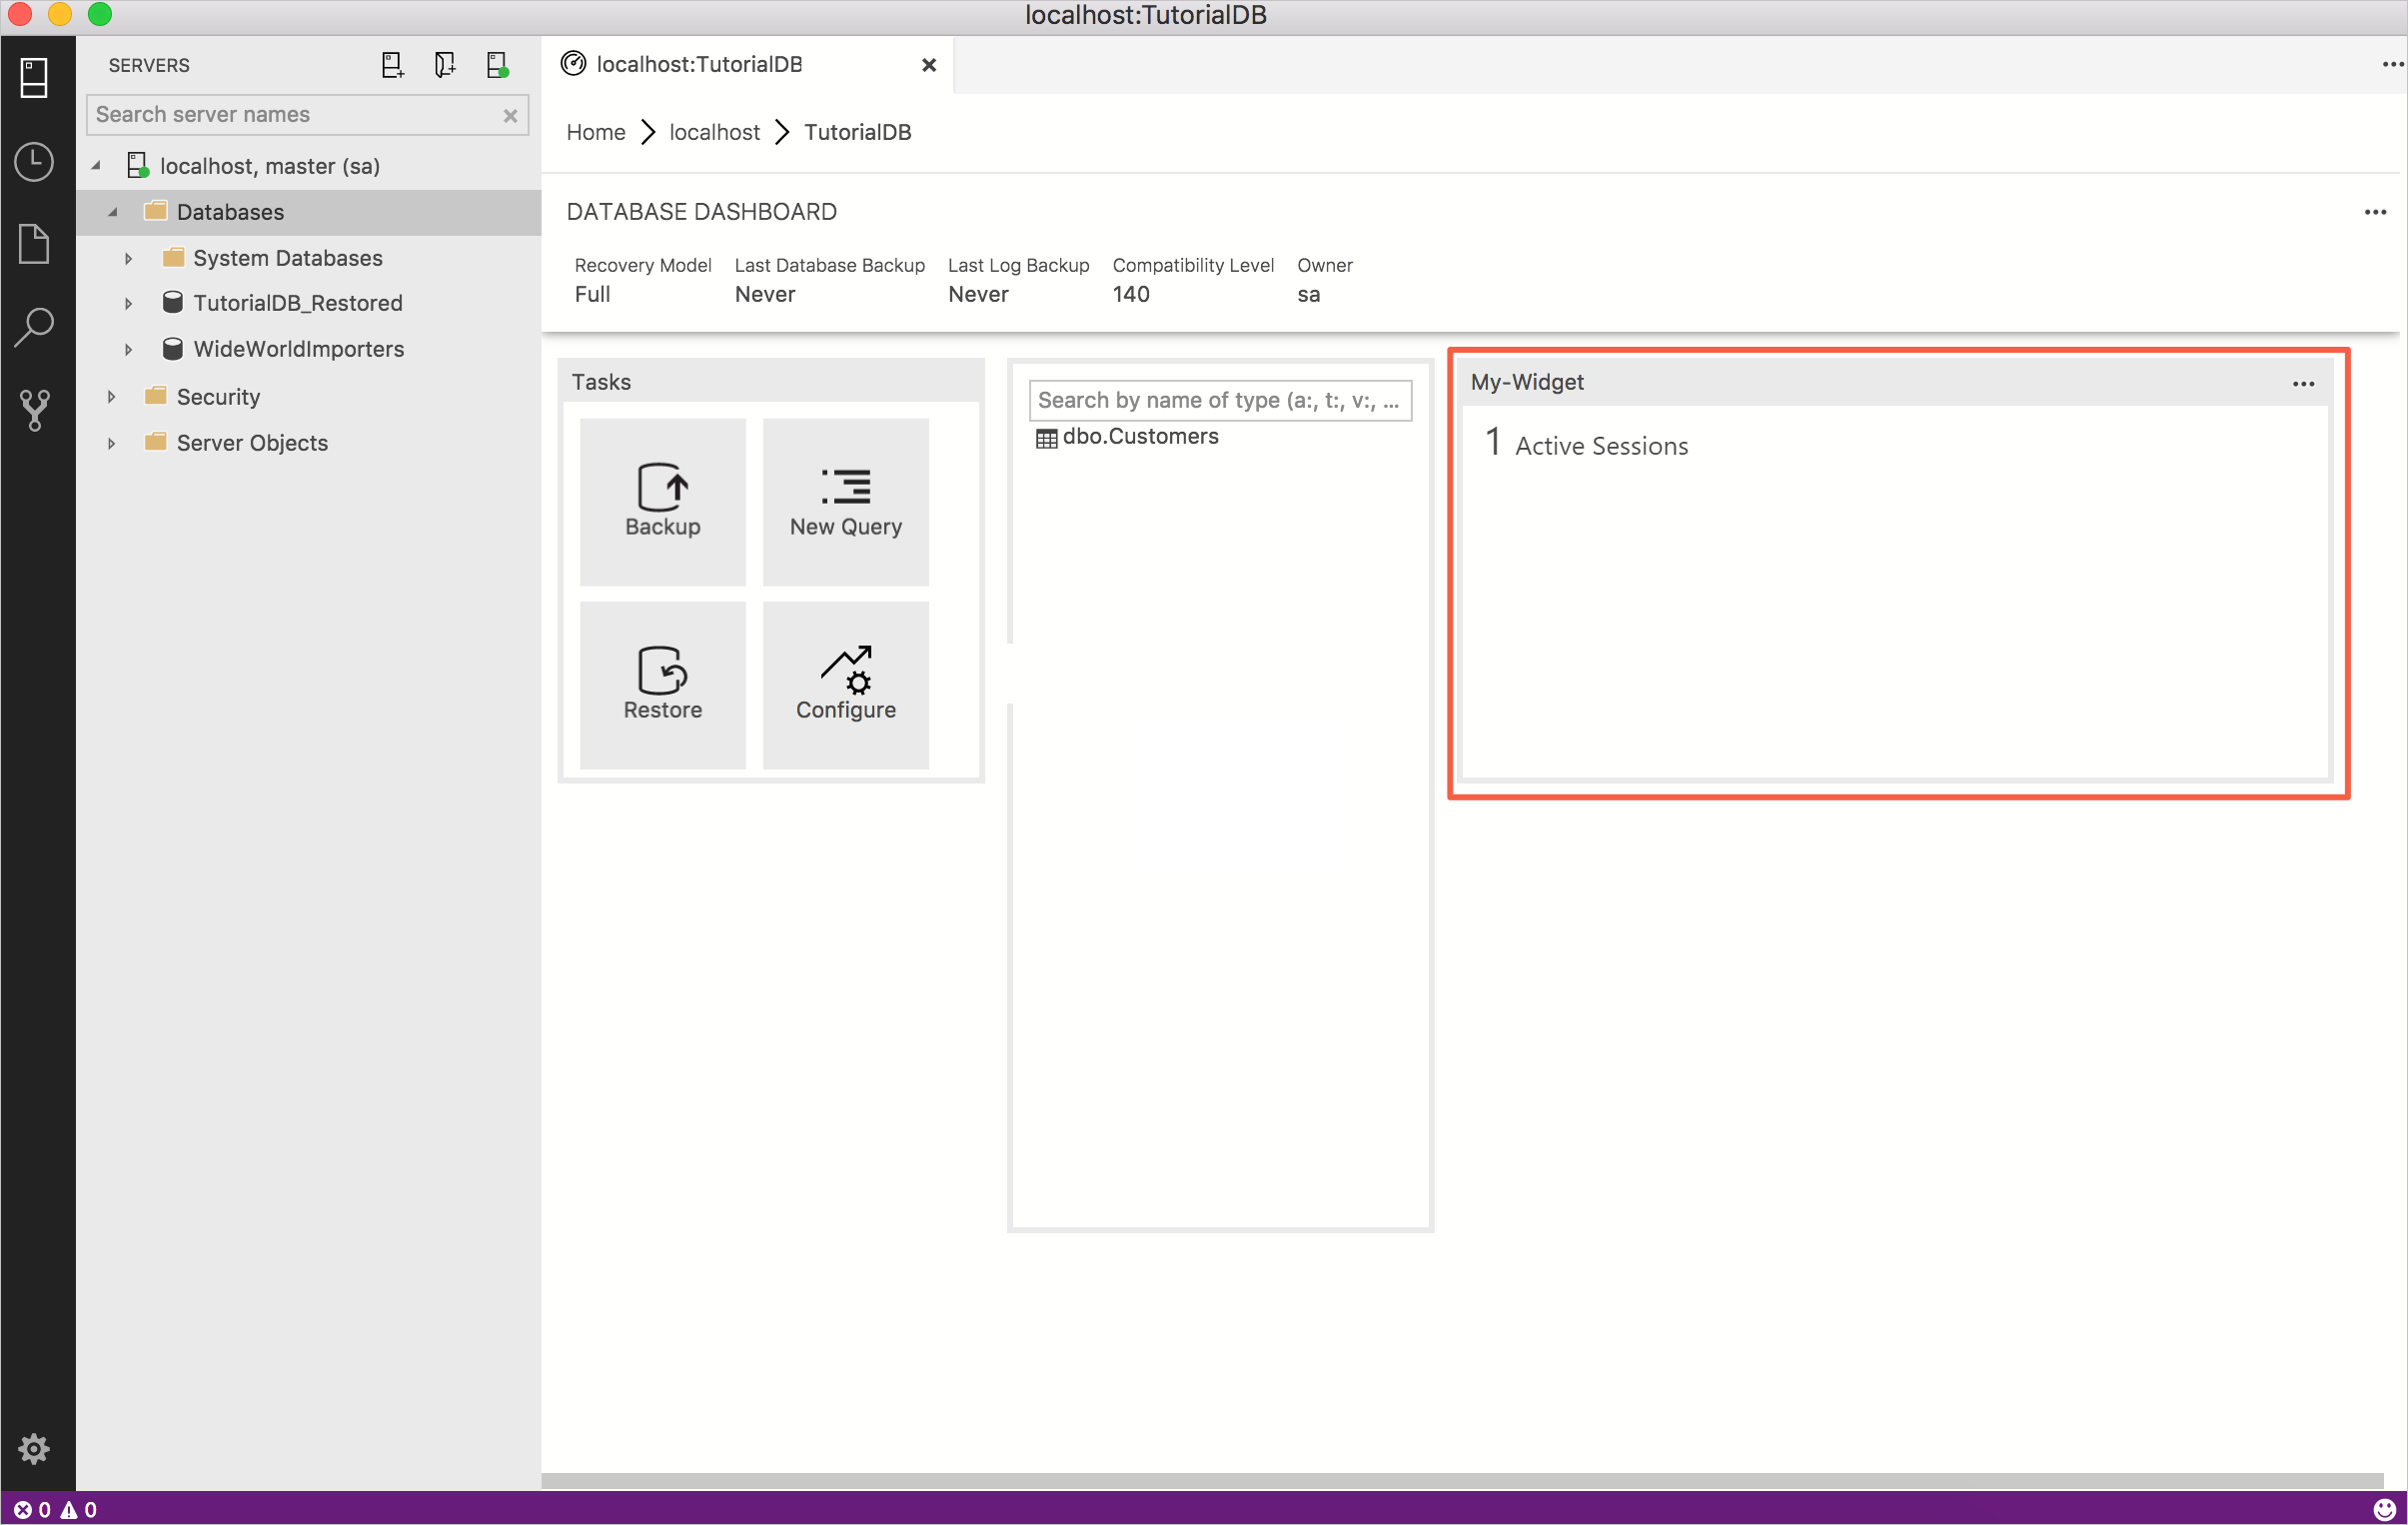
Save the User Settings file and open the TutorialDB database dashboard to see the active sessions widget:

Add details to custom insight
To open a new editor, press Ctrl+N.
Change the connection context to TutorialDB.
Paste the following query into the query editor:
 SELECT session_id AS [SID], login_time AS [Login Time], host_name AS [Host Name], program_name AS [Program Name], login_name AS [Login Name]
 FROM sys.dm_exec_sessions
 WHERE status = 'running'
Save the query in the editor to a *.sql file. For this tutorial, save the script as activeSessionDetail.sql.
Press Ctrl+Comma to open User Settings.
Edit the existing dashboard.database.widgets node in your settings file:
 "dashboard.database.widgets": [
     {
         "name": "My-Widget",
         "gridItemConfig": {
             "sizex": 2,
             "sizey": 1
         },
         "widget": {
             "insights-widget": {
                 "type": {
                     "count": {
                         "dataDirection": "vertical",
                         "dataType": "number",
                         "legendPosition": "none",
                         "labelFirstColumn": false,
                         "columnsAsLabels": false
                     }
                 },
                 "queryFile": "{your file folder}/activeSession.sql",
                 "details": {
                     "queryFile": "{your file folder}/activeSessionDetail.sql",
                     "label": "SID",
                     "value": "Login Name"
                 }
             }
         }
     }
 ]
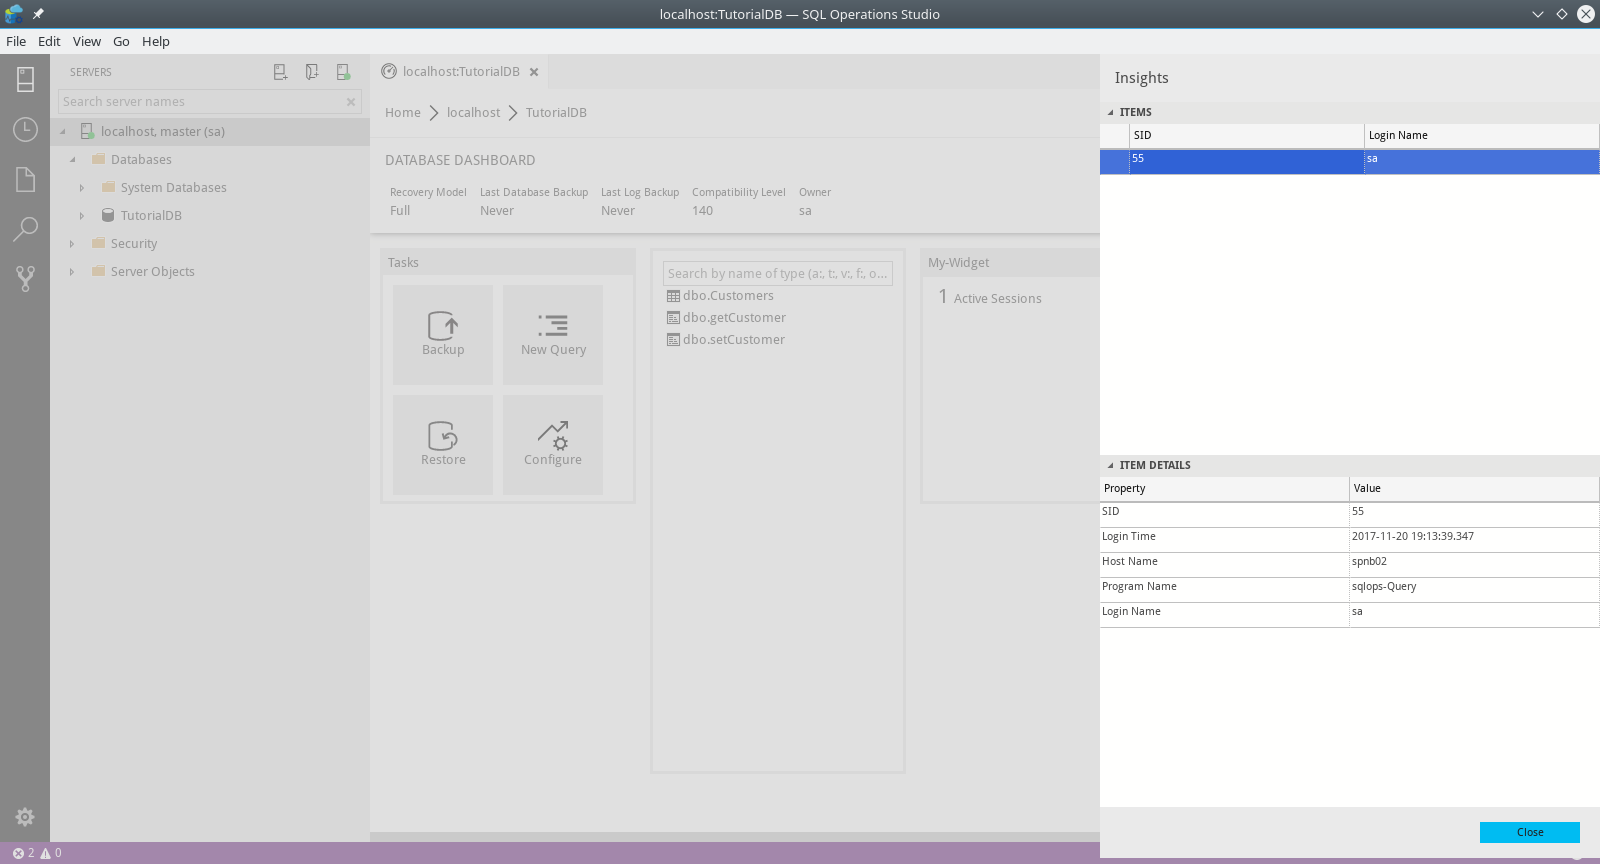
Save the User Settings file and open the TutorialDB database dashboard. Click the ellipsis (...) button next to My-Widget to show the details:

Next steps
In this tutorial, you learned how to:
- Run your own query and view it in a chart
- Build a custom insight widget from the chart
- Add the chart to a server or database dashboard
- Add details to your custom insight widget
To learn how to backup and restore databases, complete the next tutorial: