Add an expand or collapse action to a Report Builder paginated report
Applies to: ![]() Microsoft Report Builder (SSRS) ❌ Power BI Report Builder
Microsoft Report Builder (SSRS) ❌ Power BI Report Builder ![]() Report Designer in SQL Server Data Tools
Report Designer in SQL Server Data Tools
You can let users interactively expand or collapse items in a paginated report or expand or collapse rows and columns associated with a group for a table or matrix. To allow users to expand or collapse an item, you set the visibility properties for that item. Setting visibility works in an HTML report viewer, sometimes called a drilldown action.
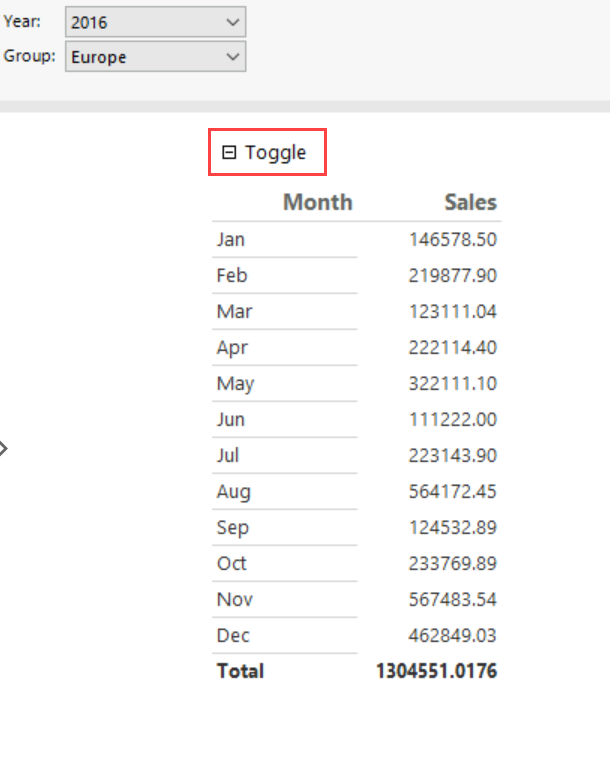
In Design view, you specify the name of the text box where you want to display the expand and collapse toggle icons. In the rendered report, the text box displays a plus (+) or minus (-) sign in addition to its contents. When the user selects the toggle, the report display refreshes to show or hide the report item based on the current visibility settings for items in the report.
Typically, the expand and collapse action is used to initially display only summary data and to let the user select the plus sign to show detail data. For example, you can initially hide a table that displays values for a chart, or hide child groups for a table with nested row or column groups, like in a drilldown report.
Note
You can create and modify paginated report definition (.rdl) files in Microsoft Report Builder, Power BI Report Builder, and in Report Designer in SQL Server Data Tools.
Add an expand and collapse action to a group
In Design view, select your table or matrix. The Grouping pane displays the row and column groups.
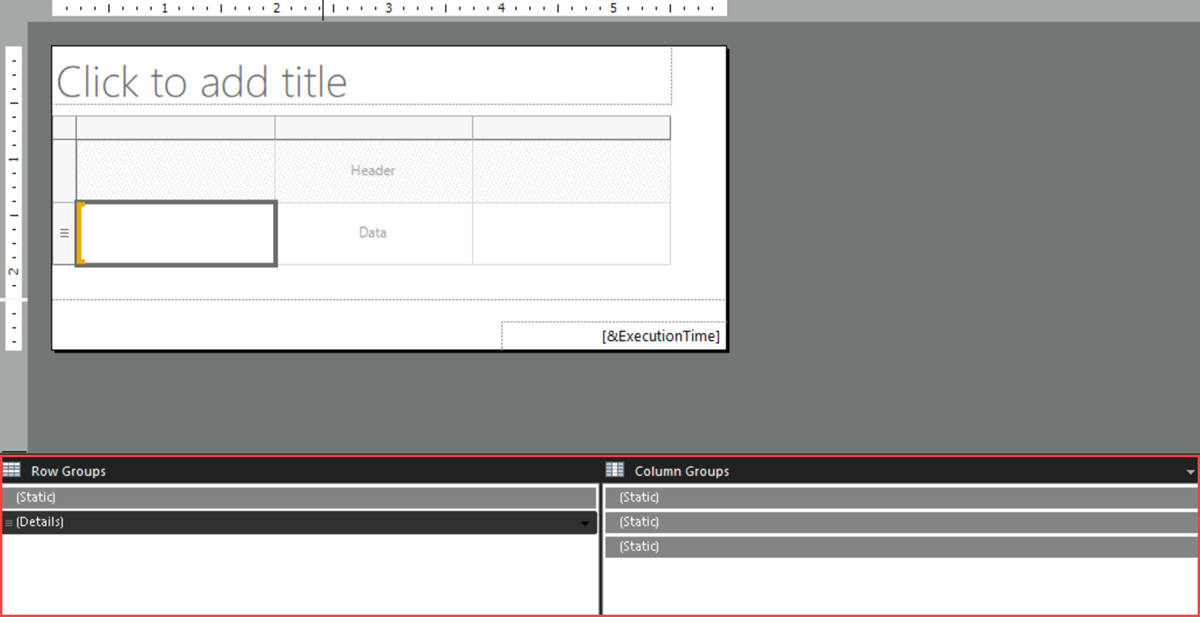
If the Grouping pane doesn't appear, select the View menu, and then choose Grouping.
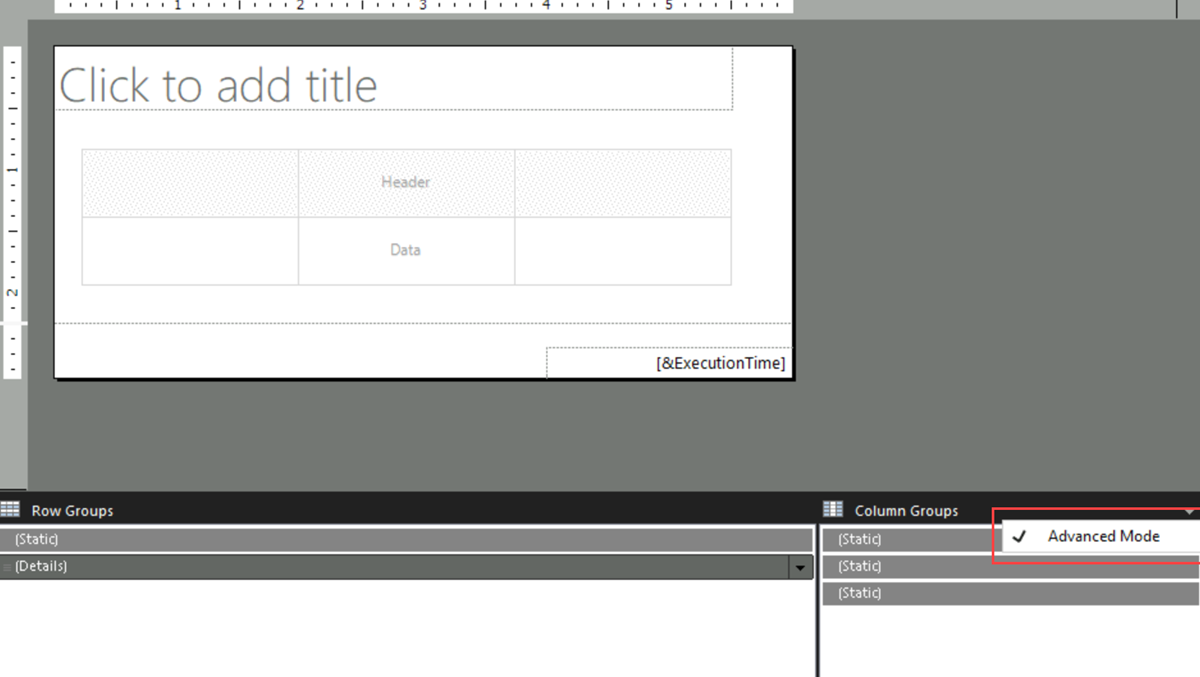
Select the options menu in the corner of the title bar, and then select Advanced. The Grouping pane toggles to show the underlying display structure for rows and columns on the design surface.
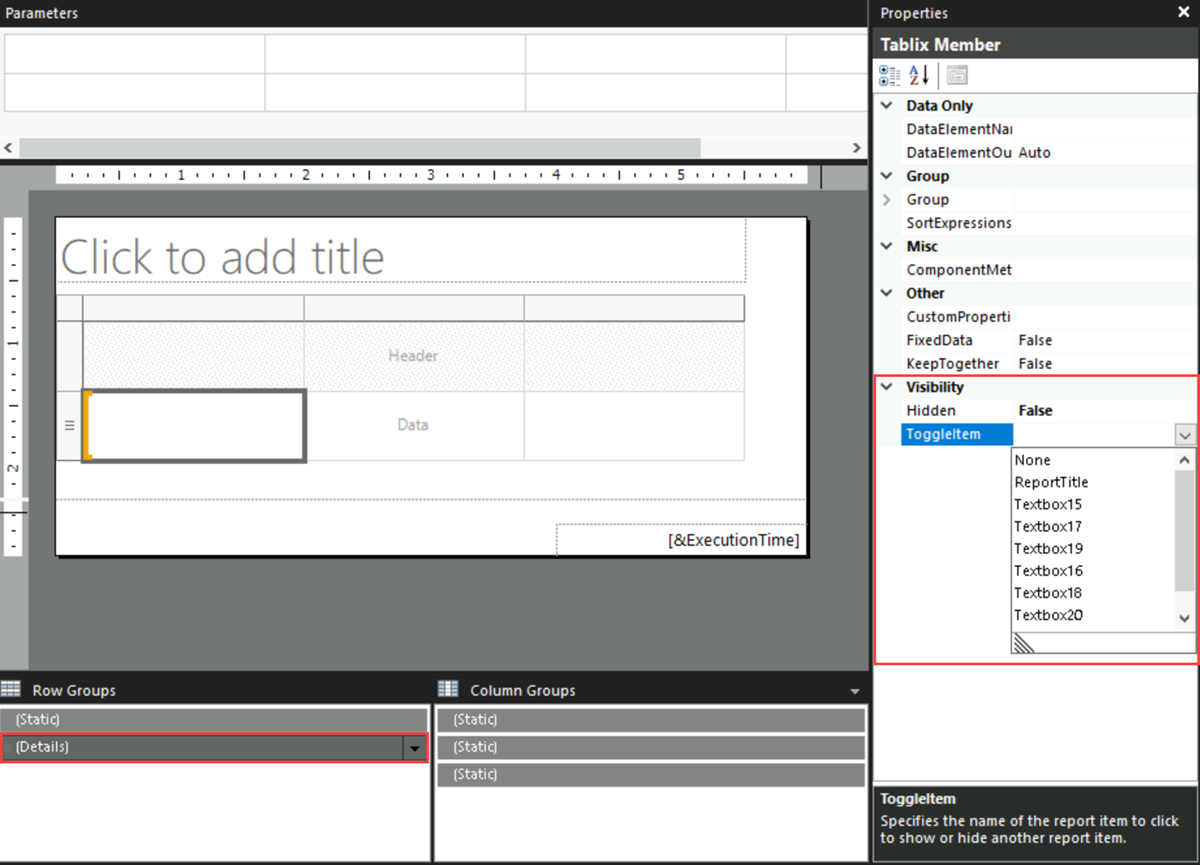
Select the name of the row group or column group where you want to hide rows or columns. The Properties pane shows the Tablix Member properties.
Note
If you don't see the Properties pane, select View on the Ribbon and then choose Properties.
In Visibility > Hidden, select one of the following options from the dropdown to set the visibility of the report item the first time you run a report:
Select False to display the report item.
Select True to hide the report item.
Select <Expression> to open the Expression dialog box. Create an expression evaluated at run time to determine the visibility.
In ToggleItem, from the dropdown list, select the name of a text box to which you want to add a toggle.
In the following image, the Details row group is configured to let users expand and collapse associated rows:
Note
The text box with the toggle image can't be the row or column group you want to hide the associated rows or columns. It must be in the same group as the item being hidden or in an ancestor group. For example, to toggle visibility of rows associated with a child group, select a text box in a row associated with the parent group.
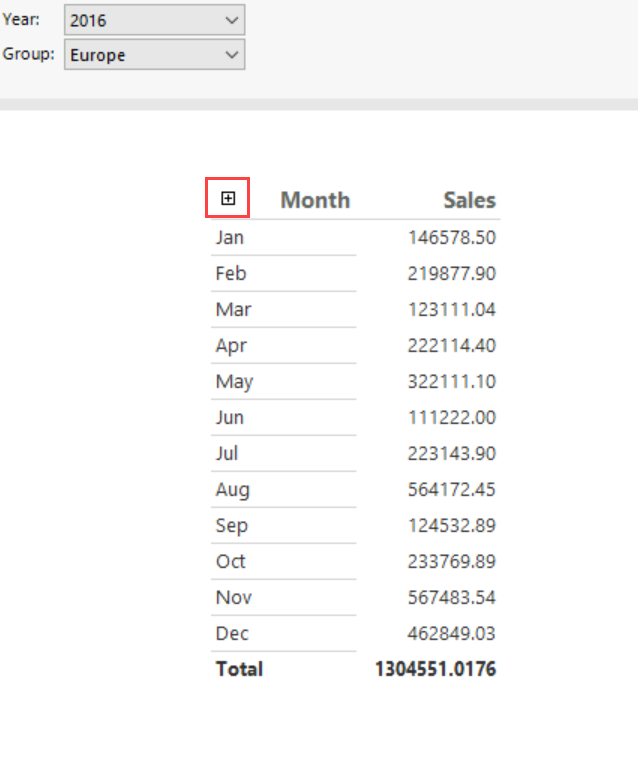
To test the toggle, run the report and select the text box with toggle. The report display refreshes to show row groups and column groups with their toggled visibility.
Add an expand and collapse action to a report item
In Design view, right-click the report item to show or hide, and then select
<report item>Properties. The<report item>Properties dialog for the report item opens.Select Visibility.
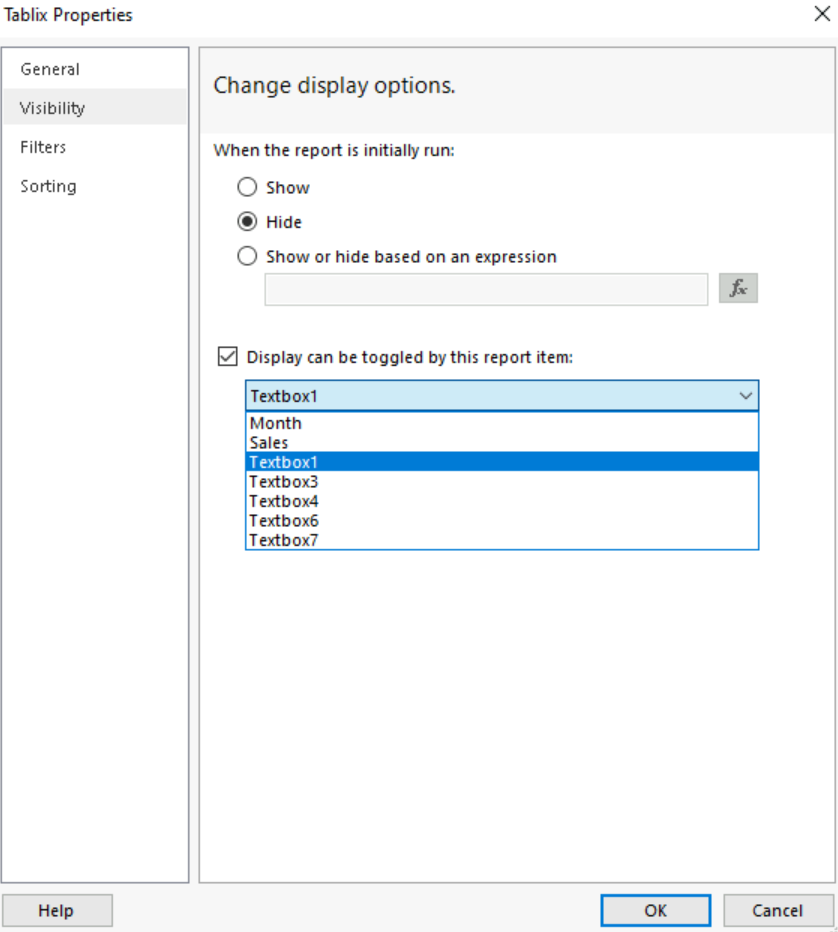
In When the report is initially run, choose one of the following options to set the visibility of this report item the first time you run a report:
Select Show to display the report item.
Select Hide to hide the report item.
Select Show or hide based on an expression to use an expression evaluated at run time to determine the visibility. Select (fx) to open the Expression dialog to create an expression.
Note
When you specify an expression for visibility, you set the Hidden property of the report item. The expression evaluates to a Boolean value of TRUE to hide the item and FALSE to show the item.
In Display can be toggled by this report item, from the list, enter or select the name of a text box in the report in which to display a toggle image.
In the following image, the table is configured to enable users to expand and collapse it. The display of the table is toggled by the Textbox1 text box.
Note
The text box that you choose must be in the current or containing scope for this report item, up to and including the report body. To toggle visibility of a chart, select a text box in the same containing scope as the chart. For example, select the report body or a rectangle. The text box must be in the same container hierarchy or higher.
To test the toggle, run the report and select the text box with the toggle image. The report display refreshes to show report items with their toggled visibility.
Related content
Tagasiside
Varsti tulekul: 2024. aasta jooksul tühistame GitHubi probleemide funktsiooni sisutagasiside mehhanismina ja asendame selle uue tagasisidesüsteemiga. Lisateabe saamiseks vt https://aka.ms/ContentUserFeedback.
Esita ja vaata tagasisidet