Use SparkR
SparkR is an R package that provides a light-weight frontend to use Apache Spark from R. SparkR provides a distributed data frame implementation that supports operations like selection, filtering, aggregation etc. SparkR also supports distributed machine learning using MLlib.
Use SparkR through Spark batch job definitions or with interactive Microsoft Fabric notebooks.
R support is only available in Spark3.1 or above. R in Spark 2.4 is not supported.
Prerequisites
Get a Microsoft Fabric subscription. Or, sign up for a free Microsoft Fabric trial.
Sign in to Microsoft Fabric.
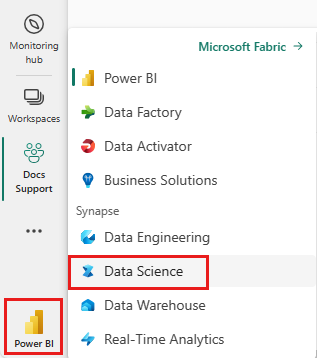
Use the experience switcher on the left side of your home page to switch to the Synapse Data Science experience.
Open or create a notebook. To learn how, see How to use Microsoft Fabric notebooks.
Set the language option to SparkR (R) to change the primary language.
Attach your notebook to a lakehouse. On the left side, select Add to add an existing lakehouse or to create a lakehouse.
Read and write SparkR DataFrames
Read a SparkR DataFrame from a local R data.frame
The simplest way to create a DataFrame is to convert a local R data.frame into a Spark DataFrame.
# load SparkR pacakge
library(SparkR)

# read a SparkR DataFrame from a local R data.frame
df <- createDataFrame(faithful)

# displays the content of the DataFrame
display(df)
Read and write SparkR DataFrame from Lakehouse
Data can be stored on the local filesystem of cluster nodes. The general methods to read and write a SparkR DataFrame from Lakehouse is read.df and write.df. These methods take the path for the file to load and the type of data source. SparkR supports reading CSV, JSON, text, and Parquet files natively.
To read and write to a Lakehouse, first add it to your session. On the left side of the notebook, select Add to add an existing Lakehouse or create a Lakehouse.
Note
To access Lakehouse files using Spark packages, such as read.df or write.df, use its ADFS path or relative path for Spark. In the Lakehouse explorer, right click on the files or folder you want to access and copy its ADFS path or relative path for Spark from the contextual menu.
# write data in CSV using relative path for Spark
temp_csv_spark<-"Files/data/faithful.csv"
write.df(df, temp_csv_spark ,source="csv", mode = "overwrite", header = "true")

# read data in CSV using relative path for Spark
faithfulDF_csv <- read.df(temp_csv_spark, source= "csv", header = "true", inferSchema = "true")

# displays the content of the DataFrame
display(faithfulDF_csv)
# write data in parquet using ADFS path
temp_parquet_spark<-"abfss://xxx/xxx/data/faithful.parquet"
write.df(df, temp_parquet_spark ,source="parquet", mode = "overwrite", header = "true")

# read data in parquet uxing ADFS path
faithfulDF_pq <- read.df(temp_parquet_spark, source= "parquet", header = "true", inferSchema = "true")

# displays the content of the DataFrame
display(faithfulDF_pq)
Microsoft Fabric has tidyverse preinstalled. You can access Lakehouse files in your familiar R packages, such as reading and writing Lakehouse files using readr::read_csv() and readr::write_csv().
Note
To access Lakehouse files using R packages, you need to use the File API path. In the Lakehouse explorer, right click on the file or folder that you want to access and copy its File API path from the contextual menu.
# read data in CSV using API path
# To find the path, navigate to the csv file, right click, and  Copy File API path.
temp_csv_api<-'/lakehouse/default/Files/data/faithful.csv/part-00000-d8e09a34-bd63-41bd-8cf8-f4ed2ef90e6c-c000.csv'
faithfulDF_API <- readr::read_csv(temp_csv_api)

# display the content of the R data.frame
head(faithfulDF_API)
You can also read a SparkR Dataframe on your Lakehouse using SparkSQL queries.
# Regsiter ealier df as temp view
createOrReplaceTempView(df, "eruptions")

# Create a df using a SparkSQL query
waiting <- sql("SELECT * FROM eruptions")

head(waiting)
Read and write SQL tables through RODBC
Use RODBC to connect to SQL based databases through an ODBC interface. For example, you can connect to a Synapse dedicated SQL pool as shown in the following example code. Substitute your own connection details for <database>, <uid>, <password>, and <table>.
# load RODBC package
library(RODBC)


# config connection string

DriverVersion <- substr(system("apt list --installed *msodbc*", intern=TRUE, ignore.stderr=TRUE)[2],10,11)
ServerName <- "your-server-name"
DatabaseName <- "your-database-name"
Uid <- "your-user-id-list"
Password <- "your-password"

ConnectionString = sprintf("Driver={ODBC Driver %s for SQL Server};
Server=%s;
Database=%s;
Uid=%s;
Pwd=%s;
Encrypt=yes;
TrustServerCertificate=yes;
Connection Timeout=30;",DriverVersion,ServerName,DatabaseName,Uid,Password)
print(ConnectionString)


# connect to driver
channel <-odbcDriverConnect(ConnectionString)

# query from existing tables
Rdf <- sqlQuery(channel, "select * from <table>")
class(Rdf)

# use SparkR::as.DataFrame to convert R data.frame to SparkR DataFrame.
spark_df <- as.DataFrame(Rdf)
class(spark_df)
head(spark_df)
DataFrame operations
SparkR DataFrames support many functions to do structured data processing. Here are some basic examples. A complete list can be found in the SparkR API docs.
Select rows and columns
# Select only the "waiting" column
head(select(df,df$waiting))
# Pass in column name as strings
head(select(df, "waiting"))
# Filter to only retain rows with waiting times longer than 70 mins
head(filter(df, df$waiting > 70))
Grouping and aggregation
SparkR data frames support many commonly used functions to aggregate data after grouping. For example, we can compute a histogram of the waiting time in the faithful dataset as shown below
# we use the `n` operator to count the number of times each waiting time appears
head(summarize(groupBy(df, df$waiting), count = n(df$waiting)))
# we can also sort the output from the aggregation to get the most common waiting times
waiting_counts <- summarize(groupBy(df, df$waiting), count = n(df$waiting))
head(arrange(waiting_counts, desc(waiting_counts$count)))
Column operations
SparkR provides many functions that can be directly applied to columns for data processing and aggregation. The following example shows the use of basic arithmetic functions.
# convert waiting time from hours to seconds.
# you can assign this to a new column in the same DataFrame
df$waiting_secs <- df$waiting * 60
head(df)
Apply user-defined function
SparkR supports several kinds of user-defined functions:
Run a function on a large dataset with dapply or dapplyCollect
dapply
Apply a function to each partition of a SparkDataFrame. The function to be applied to each partition of the SparkDataFrame and should have only one parameter, to which a data.frame corresponds to each partition will be passed. The output of function should be a data.frame. Schema specifies the row format of the resulting a SparkDataFrame. It must match to data types of returned value.
# convert waiting time from hours to seconds
df <- createDataFrame(faithful)
schema <- structType(structField("eruptions", "double"), structField("waiting", "double"),
                     structField("waiting_secs", "double"))

# apply UDF to DataFrame
df1 <- dapply(df, function(x) { x <- cbind(x, x$waiting * 60) }, schema)
head(collect(df1))
dapplyCollect
Like dapply, apply a function to each partition of a SparkDataFrame and collect the result back. The output of the function should be a data.frame. But, this time, schema isn't required to be passed. Note that dapplyCollect can fail if the outputs of the function run on all the partition can't be pulled to the driver and fit in driver memory.
# convert waiting time from hours to seconds
# apply UDF to DataFrame and return a R's data.frame
ldf <- dapplyCollect(
         df,
         function(x) {
           x <- cbind(x, "waiting_secs" = x$waiting * 60)
         })
head(ldf, 3)
Run a function on a large dataset grouping by input column(s) with gapply or gapplyCollect
gapply
Apply a function to each group of a SparkDataFrame. The function is to be applied to each group of the SparkDataFrame and should have only two parameters: grouping key and R data.frame corresponding to that key. The groups are chosen from SparkDataFrames column(s). The output of the function should be a data.frame. Schema specifies the row format of the resulting SparkDataFrame. It must represent R function’s output schema from Spark data types. The column names of the returned data.frame are set by user.
# determine six waiting times with the largest eruption time in minutes.
schema <- structType(structField("waiting", "double"), structField("max_eruption", "double"))
result <- gapply(
    df,
    "waiting",
    function(key, x) {
        y <- data.frame(key, max(x$eruptions))
    },
    schema)
head(collect(arrange(result, "max_eruption", decreasing = TRUE)))
gapplyCollect
Like gapply, applies a function to each group of a SparkDataFrame and collect the result back to R data.frame. The output of the function should be a data.frame. But, the schema isn't required to be passed. Note that gapplyCollect can fail if the outputs of the function run on all the partition can't be pulled to the driver and fit in driver memory.
# determine six waiting times with the largest eruption time in minutes.
result <- gapplyCollect(
    df,
    "waiting",
    function(key, x) {
        y <- data.frame(key, max(x$eruptions))
        colnames(y) <- c("waiting", "max_eruption")
        y
    })
head(result[order(result$max_eruption, decreasing = TRUE), ])
Run local R functions distributed with spark.lapply
spark.lapply
Similar to lapply in native R, spark.lapply runs a function over a list of elements and distributes the computations with Spark. Applies a function in a manner that is similar to doParallel or lapply to elements of a list. The results of all the computations should fit in a single machine. If that is not the case, they can do something like df <- createDataFrame(list) and then use dapply.
# perform distributed training of multiple models with spark.lapply. Here, we pass
# a read-only list of arguments which specifies family the generalized linear model should be.
families <- c("gaussian", "poisson")
train <- function(family) {
  model <- glm(Sepal.Length ~ Sepal.Width + Species, iris, family = family)
  summary(model)
}
# return a list of model's summaries
model.summaries <- spark.lapply(families, train)

# print the summary of each model
print(model.summaries)
Run SQL queries from SparkR
A SparkR DataFrame can also be registered as a temporary view that allows you to run SQL queries over its data. The sql function enables applications to run SQL queries programmatically and returns the result as a SparkR DataFrame.
# Register earlier df as temp view
createOrReplaceTempView(df, "eruptions")

# Create a df using a SparkSQL query
waiting <- sql("SELECT waiting FROM eruptions where waiting>70 ")

head(waiting)
Machine learning
SparkR exposes most of MLLib algorithms. Under the hood, SparkR uses MLlib to train the model.
The following example shows how to build a Gaussian GLM model using SparkR. To run linear regression, set family to "gaussian". To run logistic regression, set family to "binomial". When using SparkML GLM SparkR automatically performs one-hot encoding of categorical features so that it doesn't need to be done manually. Beyond String and Double type features, it's also possible to fit over MLlib Vector features, for compatibility with other MLlib components.
To learn more about which machine learning algorithms are supported, you can visit the documentation for SparkR and MLlib.
# create the DataFrame
cars <- cbind(model = rownames(mtcars), mtcars)
carsDF <- createDataFrame(cars)

# fit a linear model over the dataset.
model <- spark.glm(carsDF, mpg ~ wt + cyl, family = "gaussian")

# model coefficients are returned in a similar format to R's native glm().
summary(model)
Related content
Feedback
Coming soon: Throughout 2024 we will be phasing out GitHub Issues as the feedback mechanism for content and replacing it with a new feedback system. For more information see: https://aka.ms/ContentUserFeedback.
Submit and view feedback for