Dependency tracking in Application Insights
Note
The following documentation relies on the Application Insights classic API. The long-term plan for Application Insights is to collect data using OpenTelemetry. For more information, see Enable Azure Monitor OpenTelemetry for .NET, Node.js, Python and Java applications and our OpenTelemetry Roadmap. Migration guidance is available for .NET, Node.js, and Python.
A dependency is a component that's called by your application. It's typically a service called by using HTTP, a database, or a file system. Application Insights measures the duration of dependency calls and whether it's failing or not, along with information like the name of the dependency. You can investigate specific dependency calls and correlate them to requests and exceptions.
Automatically tracked dependencies
Application Insights SDKs for .NET and .NET Core ship with DependencyTrackingTelemetryModule, which is a telemetry module that automatically collects dependencies. This dependency collection is enabled automatically for ASP.NET and ASP.NET Core applications when configured according to the linked official docs. The module DependencyTrackingTelemetryModule is shipped as the Microsoft.ApplicationInsights.DependencyCollector NuGet package and brought automatically when you use either the Microsoft.ApplicationInsights.Web NuGet package or the Microsoft.ApplicationInsights.AspNetCore NuGet package.
Currently, DependencyTrackingTelemetryModule tracks the following dependencies automatically:
| Dependencies | Details |
|---|---|
| HTTP/HTTPS | Local or remote HTTP/HTTPS calls. |
| WCF calls | Only tracked automatically if HTTP-based bindings are used. |
| SQL | Calls made with SqlClient. See the section Advanced SQL tracking to get full SQL query for capturing SQL queries. |
| Azure Blob Storage, Table Storage, or Queue Storage | Calls made with the Azure Storage client. |
| Azure Event Hubs client SDK | Use the latest package: https://nuget.org/packages/Azure.Messaging.EventHubs. |
| Azure Service Bus client SDK | Use the latest package: https://nuget.org/packages/Azure.Messaging.ServiceBus. |
| Azure Cosmos DB | Tracked automatically if HTTP/HTTPS is used. Tracing for operations in direct mode with TCP are captured automatically using preview package >= 3.33.0-preview. For more details, visit the documentation. |
If you're missing a dependency or using a different SDK, make sure it's in the list of autocollected dependencies. If the dependency isn't autocollected, you can track it manually with a track dependency call.
Set up automatic dependency tracking in console apps
To automatically track dependencies from .NET console apps, install the NuGet package Microsoft.ApplicationInsights.DependencyCollector and initialize DependencyTrackingTelemetryModule:
    DependencyTrackingTelemetryModule depModule = new DependencyTrackingTelemetryModule();
    depModule.Initialize(TelemetryConfiguration.Active);
For .NET Core console apps, TelemetryConfiguration.Active is obsolete. See the guidance in the Worker service documentation and the ASP.NET Core monitoring documentation.
How does automatic dependency monitoring work?
Dependencies are automatically collected by using one of the following techniques:
- Using byte code instrumentation around select methods. Use
InstrumentationEngineeither fromStatusMonitoror an Azure App Service Web Apps extension. EventSourcecallbacks.DiagnosticSourcecallbacks in the latest .NET or .NET Core SDKs.
Manually tracking dependencies
The following examples of dependencies, which aren't automatically collected, require manual tracking:
- Azure Cosmos DB is tracked automatically only if HTTP/HTTPS is used. TCP mode won't be automatically captured by Application Insights for SDK versions older than
2.22.0-Beta1. - Redis
For those dependencies not automatically collected by SDK, you can track them manually by using the TrackDependency API that's used by the standard autocollection modules.
Example
If you build your code with an assembly that you didn't write yourself, you could time all the calls to it. This scenario would allow you to find out what contribution it makes to your response times.
To have this data displayed in the dependency charts in Application Insights, send it by using TrackDependency:
    var startTime = DateTime.UtcNow;
    var timer = System.Diagnostics.Stopwatch.StartNew();
    try
    {
        // making dependency call
        success = dependency.Call();
    }
    finally
    {
        timer.Stop();
        telemetryClient.TrackDependency("myDependencyType", "myDependencyCall", "myDependencyData",  startTime, timer.Elapsed, success);
    }
Alternatively, TelemetryClient provides the extension methods StartOperation and StopOperation, which can be used to manually track dependencies as shown in Outgoing dependencies tracking.
If you want to switch off the standard dependency tracking module, remove the reference to DependencyTrackingTelemetryModule in ApplicationInsights.config for ASP.NET applications. For ASP.NET Core applications, follow the instructions in Application Insights for ASP.NET Core applications.
Track AJAX calls from webpages
For webpages, the Application Insights JavaScript SDK automatically collects AJAX calls as dependencies.
Advanced SQL tracking to get full SQL query
Note
Azure Functions requires separate settings to enable SQL text collection. For more information, see Enable SQL query collection.
For SQL calls, the name of the server and database is always collected and stored as the name of the collected DependencyTelemetry. Another field, called data, can contain the full SQL query text.
For ASP.NET Core applications, It's now required to opt in to SQL Text collection by using:
services.ConfigureTelemetryModule<DependencyTrackingTelemetryModule>((module, o) => { module. EnableSqlCommandTextInstrumentation = true; });
For ASP.NET applications, the full SQL query text is collected with the help of byte code instrumentation, which requires using the instrumentation engine or by using the Microsoft.Data.SqlClient NuGet package instead of the System.Data.SqlClient library. Platform-specific steps to enable full SQL Query collection are described in the following table.
| Platform | Steps needed to get full SQL query |
|---|---|
| Web Apps in Azure App Service | In your web app control panel, open the Application Insights pane and enable SQL Commands under .NET. |
| IIS Server (Azure Virtual Machines, on-premises, and so on) | Either use the Microsoft.Data.SqlClient NuGet package or use the Application Insights Agent PowerShell Module to install the instrumentation engine and restart IIS. |
| Azure Cloud Services | Add a startup task to install StatusMonitor. Your app should be onboarded to the ApplicationInsights SDK at build time by installing NuGet packages for ASP.NET or ASP.NET Core applications. |
| IIS Express | Use the Microsoft.Data.SqlClient NuGet package. |
| WebJobs in Azure App Service | Use the Microsoft.Data.SqlClient NuGet package. |
In addition to the preceding platform-specific steps, you must also explicitly opt in to enable SQL command collection by modifying the applicationInsights.config file with the following code:
<TelemetryModules>
  <Add Type="Microsoft.ApplicationInsights.DependencyCollector.DependencyTrackingTelemetryModule, Microsoft.AI.DependencyCollector">
    <EnableSqlCommandTextInstrumentation>true</EnableSqlCommandTextInstrumentation>
  </Add>
In the preceding cases, the proper way of validating that the instrumentation engine is correctly installed is by validating that the SDK version of collected DependencyTelemetry is rddp. Use of rdddsd or rddf indicates dependencies are collected via DiagnosticSource or EventSource callbacks, so the full SQL query won't be captured.
Where to find dependency data
- Application Map visualizes dependencies between your app and neighboring components.
- Transaction Diagnostics shows unified, correlated server data.
- Browsers tab shows AJAX calls from your users' browsers.
- Select from slow or failed requests to check their dependency calls.
- Analytics can be used to query dependency data.
Diagnose slow requests
Each request event is associated with the dependency calls, exceptions, and other events tracked while processing the request. So, if some requests are doing badly, you can find out whether it's because of slow responses from a dependency.
Tracing from requests to dependencies
Select the left-hand Performance tab and select the Dependencies tab at the top.
Select a Dependency Name under Overall. After you select a dependency, it shows a graph of that dependency's distribution of durations.
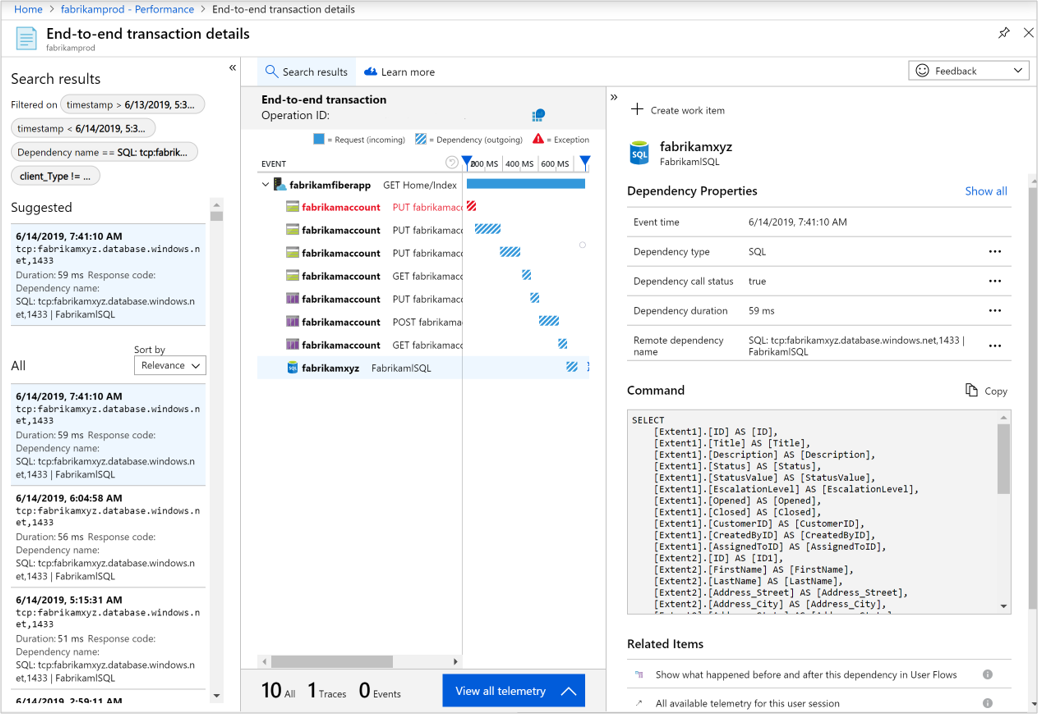
Select the Samples button at the bottom right. Then select a sample to see the end-to-end transaction details.
Profile your live site
The Application Insights profiler traces HTTP calls to your live site and shows you the functions in your code that took the longest time.
Failed requests
Failed requests might also be associated with failed calls to dependencies.
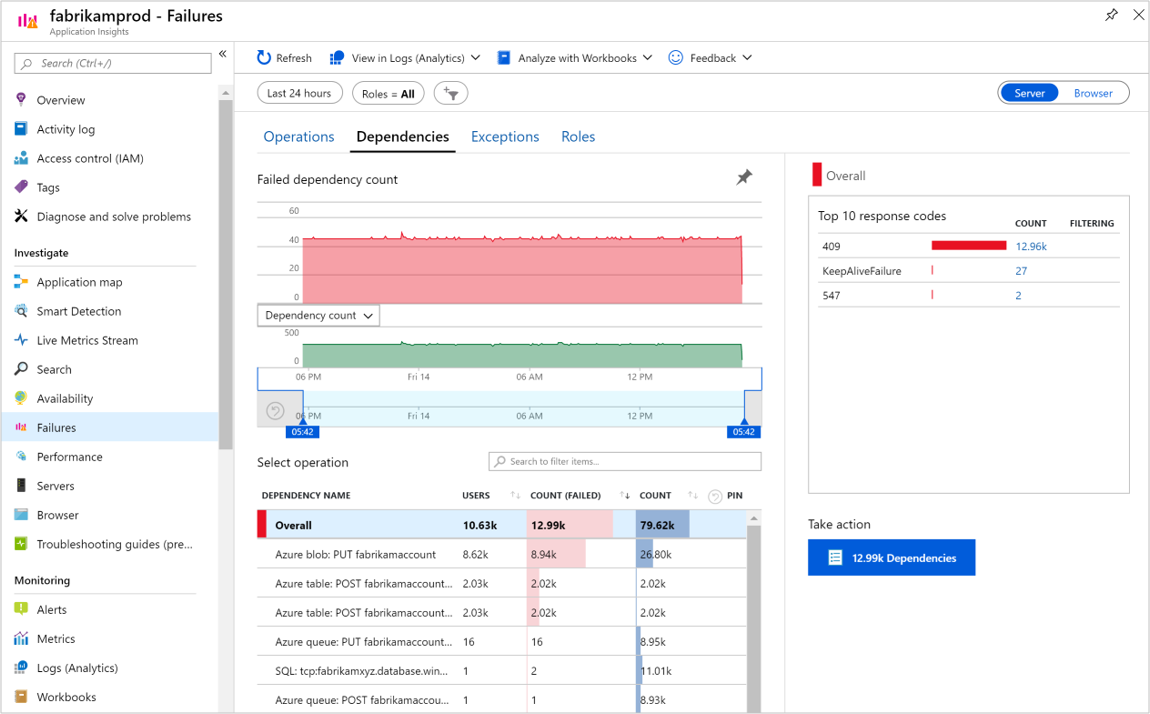
Select the left-hand Failures tab and then select the Dependencies tab at the top.
Here you see the failed dependency count. To get more information about a failed occurrence, select a Dependency Name in the bottom table. Select the Dependencies button at the bottom right to see the end-to-end transaction details.
Logs (Analytics)
You can track dependencies in the Kusto query language. Here are some examples.
Find any failed dependency calls:
dependencies | where success != "True" | take 10Find AJAX calls:
dependencies | where client_Type == "Browser" | take 10Find dependency calls associated with requests:
    dependencies
    | where timestamp > ago(1d) and  client_Type != "Browser"
    | join (requests | where timestamp > ago(1d))
      on operation_Id
Find AJAX calls associated with page views:
    dependencies
    | where timestamp > ago(1d) and  client_Type == "Browser"
    | join (browserTimings | where timestamp > ago(1d))
      on operation_Id
Frequently asked questions
This section provides answers to common questions.
How does the automatic dependency collector report failed calls to dependencies?
Failed dependency calls have the success field set to False. The module DependencyTrackingTelemetryModule doesn't report ExceptionTelemetry. The full data model for dependency is described in Application Insights telemetry data model.
How do I calculate ingestion latency for my dependency telemetry?
Use this code:
dependencies
| extend E2EIngestionLatency = ingestion_time() - timestamp
| extend TimeIngested = ingestion_time()
How do I determine the time the dependency call was initiated?
In the Log Analytics query view, timestamp represents the moment the TrackDependency() call was initiated, which occurs immediately after the dependency call response is received. To calculate the time when the dependency call began, you would take timestamp and subtract the recorded duration of the dependency call.
Does dependency tracking in Application Insights include logging response bodies?
Dependency tracking in Application Insights doesn't include logging response bodies as it would generate too much telemetry for most applications.
Open-source SDK
Like every Application Insights SDK, the dependency collection module is also open source. Read and contribute to the code or report issues at the official GitHub repo.
Dependency autocollection
Below is the currently supported list of dependency calls that are automatically detected as dependencies without requiring any additional modification to your application's code. These dependencies are visualized in the Application Insights Application map and Transaction diagnostics views. If your dependency isn't on the list, you can still track it manually with a track dependency call.
.NET
| App frameworks | Versions |
|---|---|
| ASP.NET Webforms | 4.5+ |
| ASP.NET MVC | 4+ |
| ASP.NET WebAPI | 4.5+ |
| ASP.NET Core | 1.1+ |
| Communication libraries | |
| HttpClient | 4.5+, .NET Core 1.1+ |
| SqlClient | .NET Core 1.0+, NuGet 4.3.0 |
| Microsoft.Data.SqlClient | 1.1.0 - latest stable release. (See the following Note.) |
| Event Hubs Client SDK | 1.1.0 |
| ServiceBus Client SDK | 7.0.0 |
| Storage clients | |
| ADO.NET | 4.5+ |
Note
There is a known issue with older versions of Microsoft.Data.SqlClient. We recommend using 1.1.0 or later to mitigate this issue. Entity Framework Core does not necessarily ship with the latest stable release of Microsoft.Data.SqlClient so we advise confirming that you are on at least 1.1.0 to avoid this issue.
Java
See the list of Application Insights Java's autocollected dependencies.
Node.js
A list of the latest currently supported modules is maintained here.
JavaScript
| Communication libraries | Versions |
|---|---|
| XMLHttpRequest | All |
Next steps
- Exceptions
- User and page data
- Availability
- Set up custom dependency tracking for Java.
- Set up custom dependency tracking for OpenCensus Python.
- Write custom dependency telemetry
- See data model for Application Insights types and data model.
- Check out platforms supported by Application Insights.


