View Code Optimizations results (Preview)
Now that you set up and configured Code Optimizations on your app, access and view any insights you received directly via the Azure portal.
You can also access Code Optimizations through any of your Application Insights resources from Performance pane and select Code Optimizations (preview) button from the top menu.

Interpret estimated Memory and CPU percentages
The estimated CPU and Memory are determined based on the amount of activity in your application. In addition to the Memory and CPU percentages, Code Optimizations also includes:
- The actual allocation sizes (in bytes)
- A breakdown of the allocated types made within the call
Memory
For Memory, the number is just a percentage of all allocations made within the trace. For example, if an issue takes 24% memory, you spent 24% of all your allocations within that call.
CPU
For CPU, the percentage is based on the number of CPUs in your machine (four core, eight core, etc.) and the trace time. For example, let's say your trace is 10 seconds long and you have 4 CPUs: you have a total of 40 seconds of CPU time. If the insight says the line of code is using 5% of the CPU, it’s using 5% of 40 seconds, or 2 seconds.
Filter and sort results
On the Code Optimizations page, you can filter the results by:
- Using the search bar to filter by field.
- Setting the time range via the Time Range drop-down menu.
- Selecting the corresponding role from the Role drop-down menu.
You can also sort columns in the insights results based on:
- Type (memory or CPU).
- Issue frequency within a specific time period (count).
- Corresponding role, if your service has multiple roles (role).

View insights
After sorting and filtering the Code Optimizations results, you can then select each insight to view the following details in a pane:
- Detailed description of the performance bug insight.
- The full call stack.
- Recommendations on how to fix the performance issue.

Note
If you don't see any insights, it's likely that the Code Optimizations service hasn't noticed any performance bottlenecks in your code. Continue to check back to see if any insights pop up.
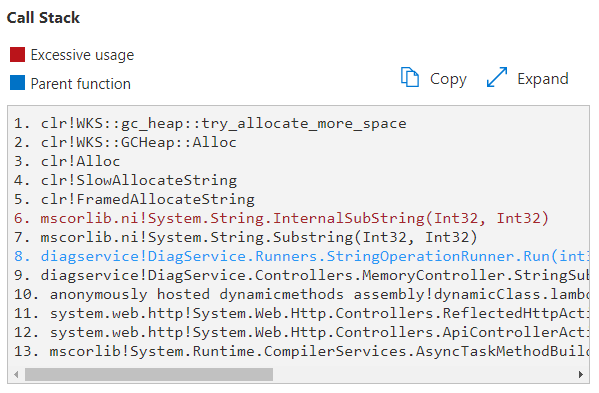
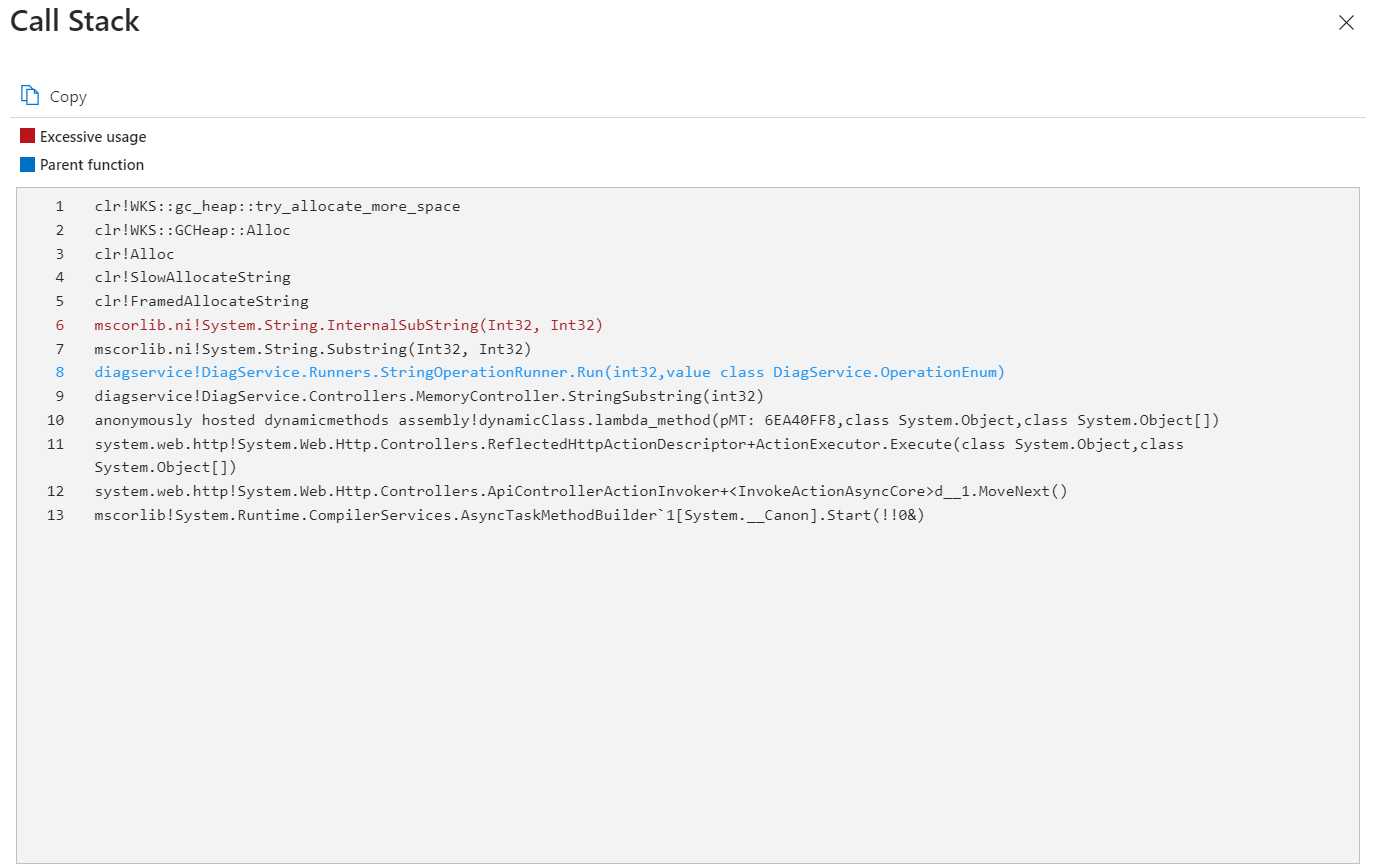
Call stack
In the insights details pane, under the Call Stack heading, you can:
- Select Expand to view the full call stack surrounding the performance issue
- Select Copy to copy the call stack.
Trend impact
You can also view a graph depicting a specific performance issue's impact and threshold. The trend impact results vary depending on the filters you set. For example, a CPU String.SubString() performance issue's insights seen over a seven day time frame may look like:
