Get started with log queries in Azure Monitor
Note
If you're collecting data from at least one virtual machine, you can work through this exercise in your own environment. For other scenarios, use our demo environment, which includes plenty of sample data.
If you already know how to query in Kusto Query Language (KQL) but need to quickly create useful queries based on resource types, see the saved example queries pane in Use queries in Azure Monitor Log Analytics.
In this tutorial, you learn to write log queries in Azure Monitor. The article shows you how to:
- Understand query structure.
- Sort query results.
- Filter query results.
- Specify a time range.
- Select which fields to include in the results.
- Define and use custom fields.
- Aggregate and group results.
For a tutorial on using Log Analytics in the Azure portal, see Get started with Azure Monitor Log Analytics.
For more information about log queries in Azure Monitor, see Overview of log queries in Azure Monitor.
Here's a video version of this tutorial:
Permissions required
You must have Microsoft.OperationalInsights/workspaces/query/*/read permissions to the Log Analytics workspaces you query, as provided by the Log Analytics Reader built-in role, for example.
Write a new query
Queries can start with either a table name or the search command. It's a good idea to start with a table name because it defines a clear scope for the query. It also improves query performance and the relevance of the results.
Note
KQL, which is used by Azure Monitor, is case sensitive. Language keywords are usually written in lowercase. When you use names of tables or columns in a query, be sure to use the correct case, as shown on the schema pane.
Table-based queries
Azure Monitor organizes log data in tables, each composed of multiple columns. All tables and columns are shown on the schema pane in Log Analytics in the Analytics portal. Identify a table that you're interested in, and then take a look at a bit of data:
SecurityEvent
| take 10
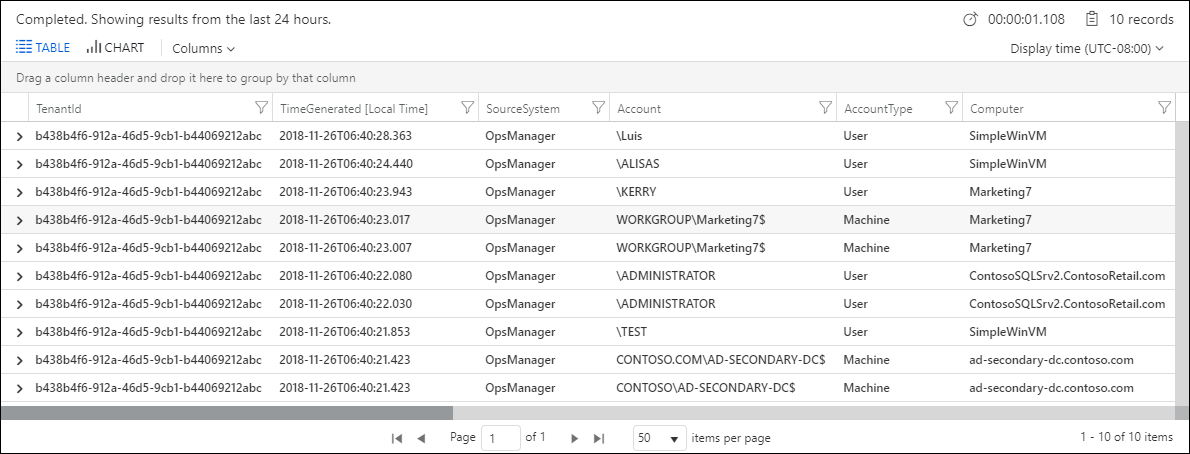
The preceding query returns 10 results from the SecurityEvent table, in no specific order. This common way to get a glance at a table helps you to understand its structure and content. Let's examine how it's built:
The query starts with the table name
SecurityEvent, which defines the scope of the query.The pipe (|) character separates commands, so the output of the first command is the input of the next. You can add any number of piped elements.
Following the pipe is the
takeoperator.We could run the query even without adding
| take 10. The command would still be valid, but it could return up to 30,000 results.
Take
Use the take operator to view a small sample of records by returning up to the specified number of records. The selected results are arbitrary and displayed in no particular order. If you need to return results in a particular order, use the sort and top operators.
Search queries
Search queries are less structured. They're better suited for finding records that include a specific value in any of their columns:
search in (SecurityEvent) "Cryptographic"
| take 10
This query searches the SecurityEvent table for records that contain the phrase "Cryptographic." Of those records, 10 records are returned and displayed. If you omit the in (SecurityEvent) part and run only search "Cryptographic", the search goes over all tables. The process would then take longer and be less efficient.
Important
Search queries are ordinarily slower than table-based queries because they have to process more data.
Sort and top
This section describes the sort and top operators and their desc and asc arguments. Although take is useful for getting a few records, you can't select or sort the results in any particular order. To get an ordered view, use sort and top.
Desc and asc
Desc
Use the desc argument to sort records in descending order. Descending is the default sorting order for sort and top, so you can usually omit the desc argument.
For example, the data returned by both of the following queries is sorted by the TimeGenerated column, in descending order:
-
SecurityEvent | sort by TimeGenerated desc -
SecurityEvent
| sort by TimeGenerated
Asc
To sort in ascending order, specify asc.
Sort
You can use the sort operator. sort sorts the query results by the column you specify. However, sort doesn't limit the number of records that are returned by the query.
For example, the following query returns all available records for the SecurityEvent table, which is up to a maximum of 30,000 records, and sorts them by the TimeGenerated column.
SecurityEvent
| sort by TimeGenerated
The preceding query could return too many results. Also, it might also take some time to return the results. The query sorts the entire SecurityEvent table by the TimeGenerated column. The Analytics portal then limits the display to only 30,000 records. This approach isn't optimal. The best way to only get the latest records is to use the top operator.
Top
Use the top operator to sort the entire table on the server side and then only return the top records.
For example, the following query returns the latest 10 records:
SecurityEvent
| top 10 by TimeGenerated
The output looks like this example.
The where operator: Filter on a condition
Filters, as indicated by their name, filter the data by a specific condition. Filtering is the most common way to limit query results to relevant information.
To add a filter to a query, use the where operator followed by one or more conditions. For example, the following query returns only SecurityEvent records where Level equals _8:
SecurityEvent
| where Level == 8
When you write filter conditions, you can use the following expressions:
| Expression | Description | Example |
|---|---|---|
| == | Check equality (case-sensitive) |
Level == 8 |
| =~ | Check equality (case-insensitive) |
EventSourceName =~ "microsoft-windows-security-auditing" |
| !=, <> | Check inequality (both expressions are identical) |
Level != 4 |
and, or |
Required between conditions | Level == 16 or CommandLine != "" |
To filter by multiple conditions, you can use either of the following approaches:
Use and, as shown here:
SecurityEvent
| where Level == 8 and EventID == 4672
Pipe multiple where elements, one after the other, as shown here:
SecurityEvent
| where Level == 8
| where EventID == 4672
Note
Values can have different types, so you might need to cast them to perform comparisons on the correct type. For example, the SecurityEvent Level column is of type String, so you must cast it to a numerical type, such as int or long, before you can use numerical operators on it, as shown here:
SecurityEvent | where toint(Level) >= 10
Specify a time range
You can specify a time range by using the time picker or a time filter.
Use the time picker
The time picker is displayed next to the Run button and indicates that you're querying records from only the last 24 hours. This default time range is applied to all queries. To get records from only the last hour, select Last hour and then run the query again.
Add a time filter to the query
You can also define your own time range by adding a time filter to the query. Adding a time filter overrides the time range selected in the time picker.
It's best to place the time filter immediately after the table name:
SecurityEvent
| where TimeGenerated > ago(30m)
| where toint(Level) >= 10
In the preceding time filter, ago(30m) means "30 minutes ago." This query returns records from only the last 30 minutes, which is expressed as, for example, 30m. Other units of time include days (for example, 2d) and seconds (for example, 10s).
Use project and extend to select and compute columns
Use project to select specific columns to include in the results:
SecurityEvent
| top 10 by TimeGenerated
| project TimeGenerated, Computer, Activity
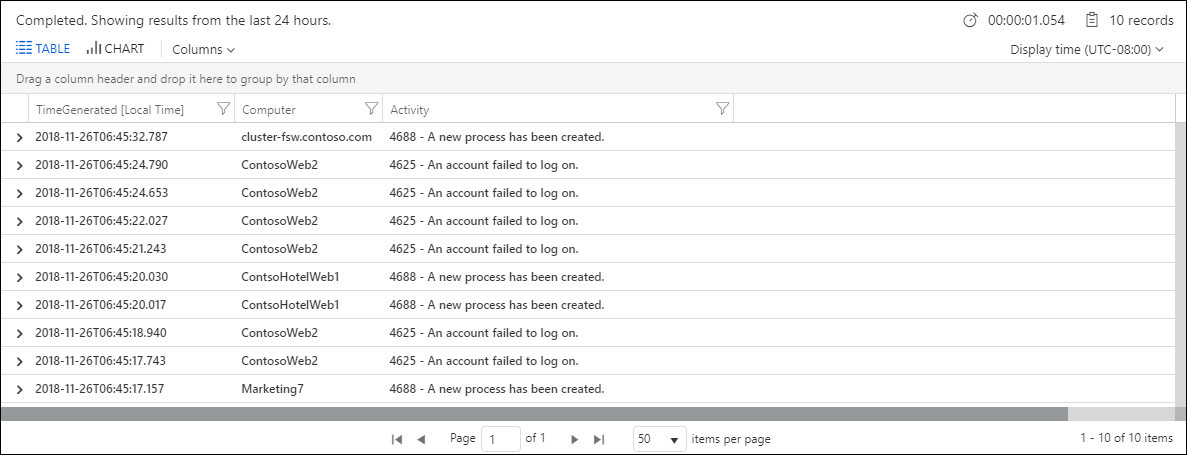
The preceding example generates the following output:
You can also use project to rename columns and define new ones. The next example uses project to do the following:
- Select only the
ComputerandTimeGeneratedoriginal columns. - Display the
Activitycolumn asEventDetails. - Create a new column named
EventCode. Thesubstring()function is used to get only the first four characters from theActivityfield.
SecurityEvent
| top 10 by TimeGenerated
| project Computer, TimeGenerated, EventDetails=Activity, EventCode=substring(Activity, 0, 4)
You can use extend to keep all original columns in the result set and define other ones. The following query uses extend to add the EventCode column. This column might not be displayed at the end of the table results. You would need to expand the details of a record to view it.
SecurityEvent
| top 10 by TimeGenerated
| extend EventCode=substring(Activity, 0, 4)
Use summarize to aggregate groups of rows
Use summarize to identify groups of records according to one or more columns and apply aggregations to them. The most common use of summarize is count, which returns the number of results in each group.
The following query reviews all Perf records from the last hour, groups them by ObjectName, and counts the records in each group:
Perf
| where TimeGenerated > ago(1h)
| summarize count() by ObjectName
Sometimes it makes sense to define groups by multiple dimensions. Each unique combination of these values defines a separate group:
Perf
| where TimeGenerated > ago(1h)
| summarize count() by ObjectName, CounterName
Another common use is to perform mathematical or statistical calculations on each group. The following example calculates the average CounterValue for each computer:
Perf
| where TimeGenerated > ago(1h)
| summarize avg(CounterValue) by Computer
Unfortunately, the results of this query are meaningless because we mixed together different performance counters. To make the results more meaningful, calculate the average separately for each combination of CounterName and Computer:
Perf
| where TimeGenerated > ago(1h)
| summarize avg(CounterValue) by Computer, CounterName
Summarize by a time column
Grouping results can also be based on a time column or another continuous value. Simply summarizing by TimeGenerated, though, would create groups for every single millisecond over the time range because these values are unique.
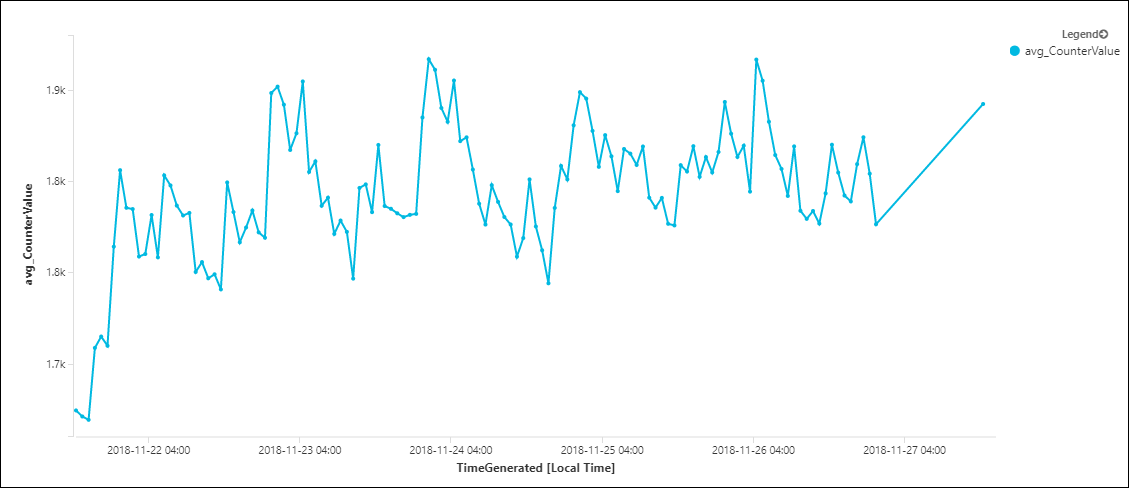
To create groups based on continuous values, it's best to break the range into manageable units by using bin. The following query analyzes Perf records that measure free memory (Available MBytes) on a specific computer. It calculates the average value of each 1-hour period over the last 7 days:
Perf
| where TimeGenerated > ago(7d)
| where Computer == "ContosoAzADDS2"
| where CounterName == "Available MBytes"
| summarize avg(CounterValue) by bin(TimeGenerated, 1h)
To make the output clearer, you can select to display it as a time chart, which shows the available memory over time.
Frequently asked questions
This section provides answers to common questions.
Why am I seeing duplicate records in Azure Monitor Logs?
Occasionally, you might notice duplicate records in Azure Monitor Logs. This duplication is typically from one of the following two conditions:
- Components in the pipeline have retries to ensure reliable delivery at the destination. Occasionally, this capability might result in duplicates for a small percentage of telemetry items.
- If the duplicate records come from a virtual machine, you might have both the Log Analytics agent and Azure Monitor Agent installed. If you still need the Log Analytics agent installed, configure the Log Analytics workspace to no longer collect data that's also being collected by the data collection rule used by Azure Monitor Agent.
Next steps
- To learn more about using string data in a log query, see Work with strings in Azure Monitor log queries.
- To learn more about aggregating data in a log query, see Advanced aggregations in Azure Monitor log queries.
- To learn how to join data from multiple tables, see Joins in Azure Monitor log queries.
- Get documentation on the entire Kusto Query Language in the KQL language reference.


