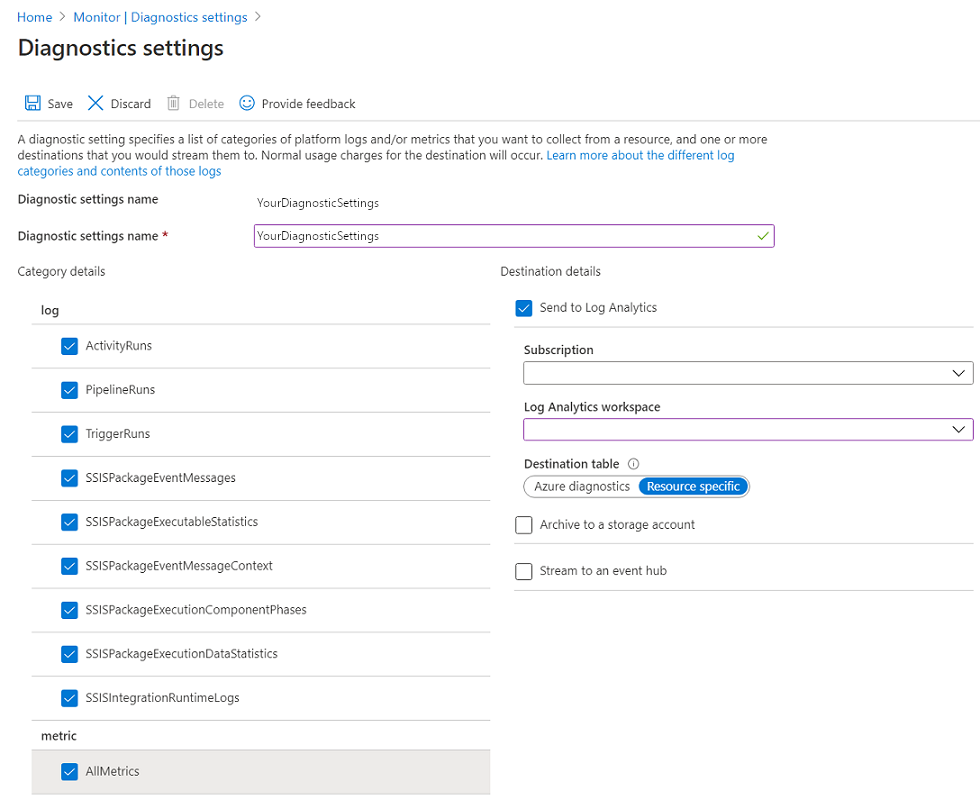
Configure diagnostic settings and a workspace
Create or add diagnostic settings for your data factory.
In the Azure portal, navigate to your data factory and select Diagnostics on the left navigation pane to see the diagnostics settings. If there are existing settings on the data factory, you see a list of settings already configured. Select Add diagnostic setting.
Give your setting a name, select Send to Log Analytics, and then select a workspace from Log Analytics workspace.
In Azure-Diagnostics mode, diagnostic logs flow into the AzureDiagnostics table.
In Resource-Specific mode, diagnostic logs from Azure Data Factory flow into the following tables:
- ADFActivityRun
- ADFPipelineRun
- ADFTriggerRun
- ADFSSISIntegrationRuntimeLogs
- ADFSSISPackageEventMessageContext
- ADFSSISPackageEventMessages
- ADFSSISPackageExecutableStatistics
- ADFSSISPackageExecutionComponentPhases
- ADFSSISPackageExecutionDataStatistics
You can select various logs relevant to your workloads to send to Log Analytics tables. For example:
- If you don't use SQL Server Integration Services (SSIS) at all, you don't need to select any SSIS logs.
- If you want to log SSIS integration runtime (IR) start, stop, or maintenance operations, select SSIS IR logs.
- If you invoke SSIS package executions via T-SQL on SQL Server Management Studio, SQL Server Agent, or other designated tools, select SSIS package logs.
- If you invoke SSIS package executions via Execute SSIS Package activities in Data Factory pipelines, select all logs.
If you select AllMetrics, various Data Factory metrics are made available for you to monitor or raise alerts on. These metrics include the metrics for Data Factory activity, pipeline, and trigger runs, and for SSIS IR operations and SSIS package executions.
Note
Because an Azure log table can't have more than 500 columns, we highly recommend that you select Resource-Specific mode. For more information, see Azure diagnostics logs reference.
Select Save.
After a few moments, the new setting appears in your list of settings for this data factory. Diagnostic logs are streamed to that workspace as soon as new event data is generated. Up to 15 minutes might elapse between when an event is emitted and when it appears in Log Analytics.

