Muistiinpano
Tämän sivun käyttö edellyttää valtuutusta. Voit yrittää kirjautua sisään tai vaihtaa hakemistoa.
Tämän sivun käyttö edellyttää valtuutusta. Voit yrittää vaihtaa hakemistoa.
Important
This feature is in Beta. Account admins can control access to this feature from the Previews page.
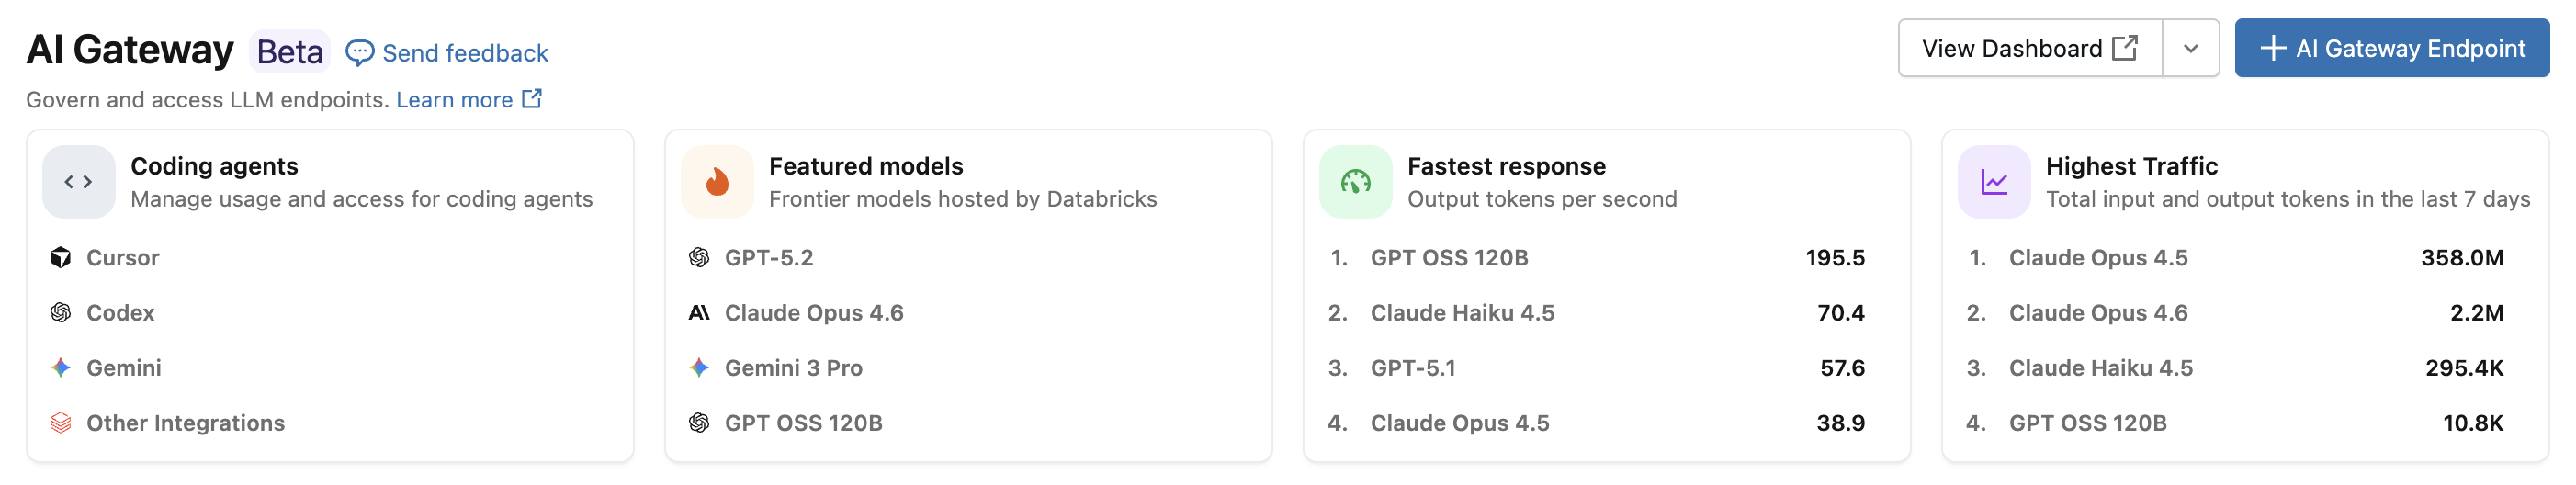
With the Azure Databricks coding agent integration, you can manage access and usage for coding agents like Cursor, Gemini CLI, and Codex CLI. Built on AI Gateway, it provides rate limiting, usage tracking, and inference tables for your coding tools.
Features
- Access: Direct access to various coding tools and models, all under one invoice.
- Observability: A single unified dashboard to track usage, spend, and metrics across all your coding tools.
- Unified governance: Admins can manage model permissions and rate limits directly through AI Gateway.
Requirements
- AI Gateway (Beta) preview enabled for your account.
- A Azure Databricks workspace in a AI Gateway (Beta) supported region.
- Unity Catalog enabled for your workspace. See Enable a workspace for Unity Catalog.
Supported agents
The following coding agents are supported:
Setup
Cursor
To configure Cursor to use AI Gateway endpoints:
Step 1: Configure base URL and API key
Open Cursor and navigate to Settings > Cursor Settings > Models > API Keys.
Enable Override OpenAI Base URL and enter the URL:
https://<ai-gateway-url>/cursor/v1Replace
<ai-gateway-url>with your AI Gateway endpoint URL.Paste your Azure Databricks personal access token into the OpenAI API Key field.
Step 2: Add custom models
- Click + Add Custom Model in Cursor Settings.
- Add your AI Gateway endpoint name and enable the toggle.
Note
Currently, only Azure Databricks-created foundation model endpoints are supported.
Step 3: Test the integration
- Open Ask mode with
Cmd+L(macOS) orCtrl+L(Windows/Linux) and select your model. - Send a message. All requests now route through Azure Databricks.
Codex CLI
Step 1: Set the DATABRICKS_TOKEN environment variable
export DATABRICKS_TOKEN=<databricks_pat_token>
Step 2: Configure the Codex client
Create or edit the Codex configuration file at ~/.codex/config.toml:
profile = "default"

[profiles.default]
model_provider = "proxy"
model = "databricks-gpt-5-2"

[model_providers.proxy]
name = "Databricks Proxy"
base_url = "https://<ai-gateway-url>/openai/v1"
env_key = "DATABRICKS_TOKEN"
wire_api = "responses"
Replace <ai-gateway-url> with your AI Gateway endpoint URL.
Gemini CLI
Step 1: Install the latest version of Gemini CLI
npm install -g @google/gemini-cli@nightly
Step 2: Configure environment variables
Create a file ~/.gemini/.env and add the following configuration. See the Gemini CLI authentication docs for more details.
GEMINI_MODEL=databricks-gemini-2-5-flash
GOOGLE_GEMINI_BASE_URL=https://<ai-gateway-url>/gemini
GEMINI_API_KEY_AUTH_MECHANISM="bearer"
GEMINI_API_KEY=<databricks_pat_token>
Replace <ai-gateway-url> with your AI Gateway endpoint URL and <databricks_pat_token> with your personal access token.
Dashboard
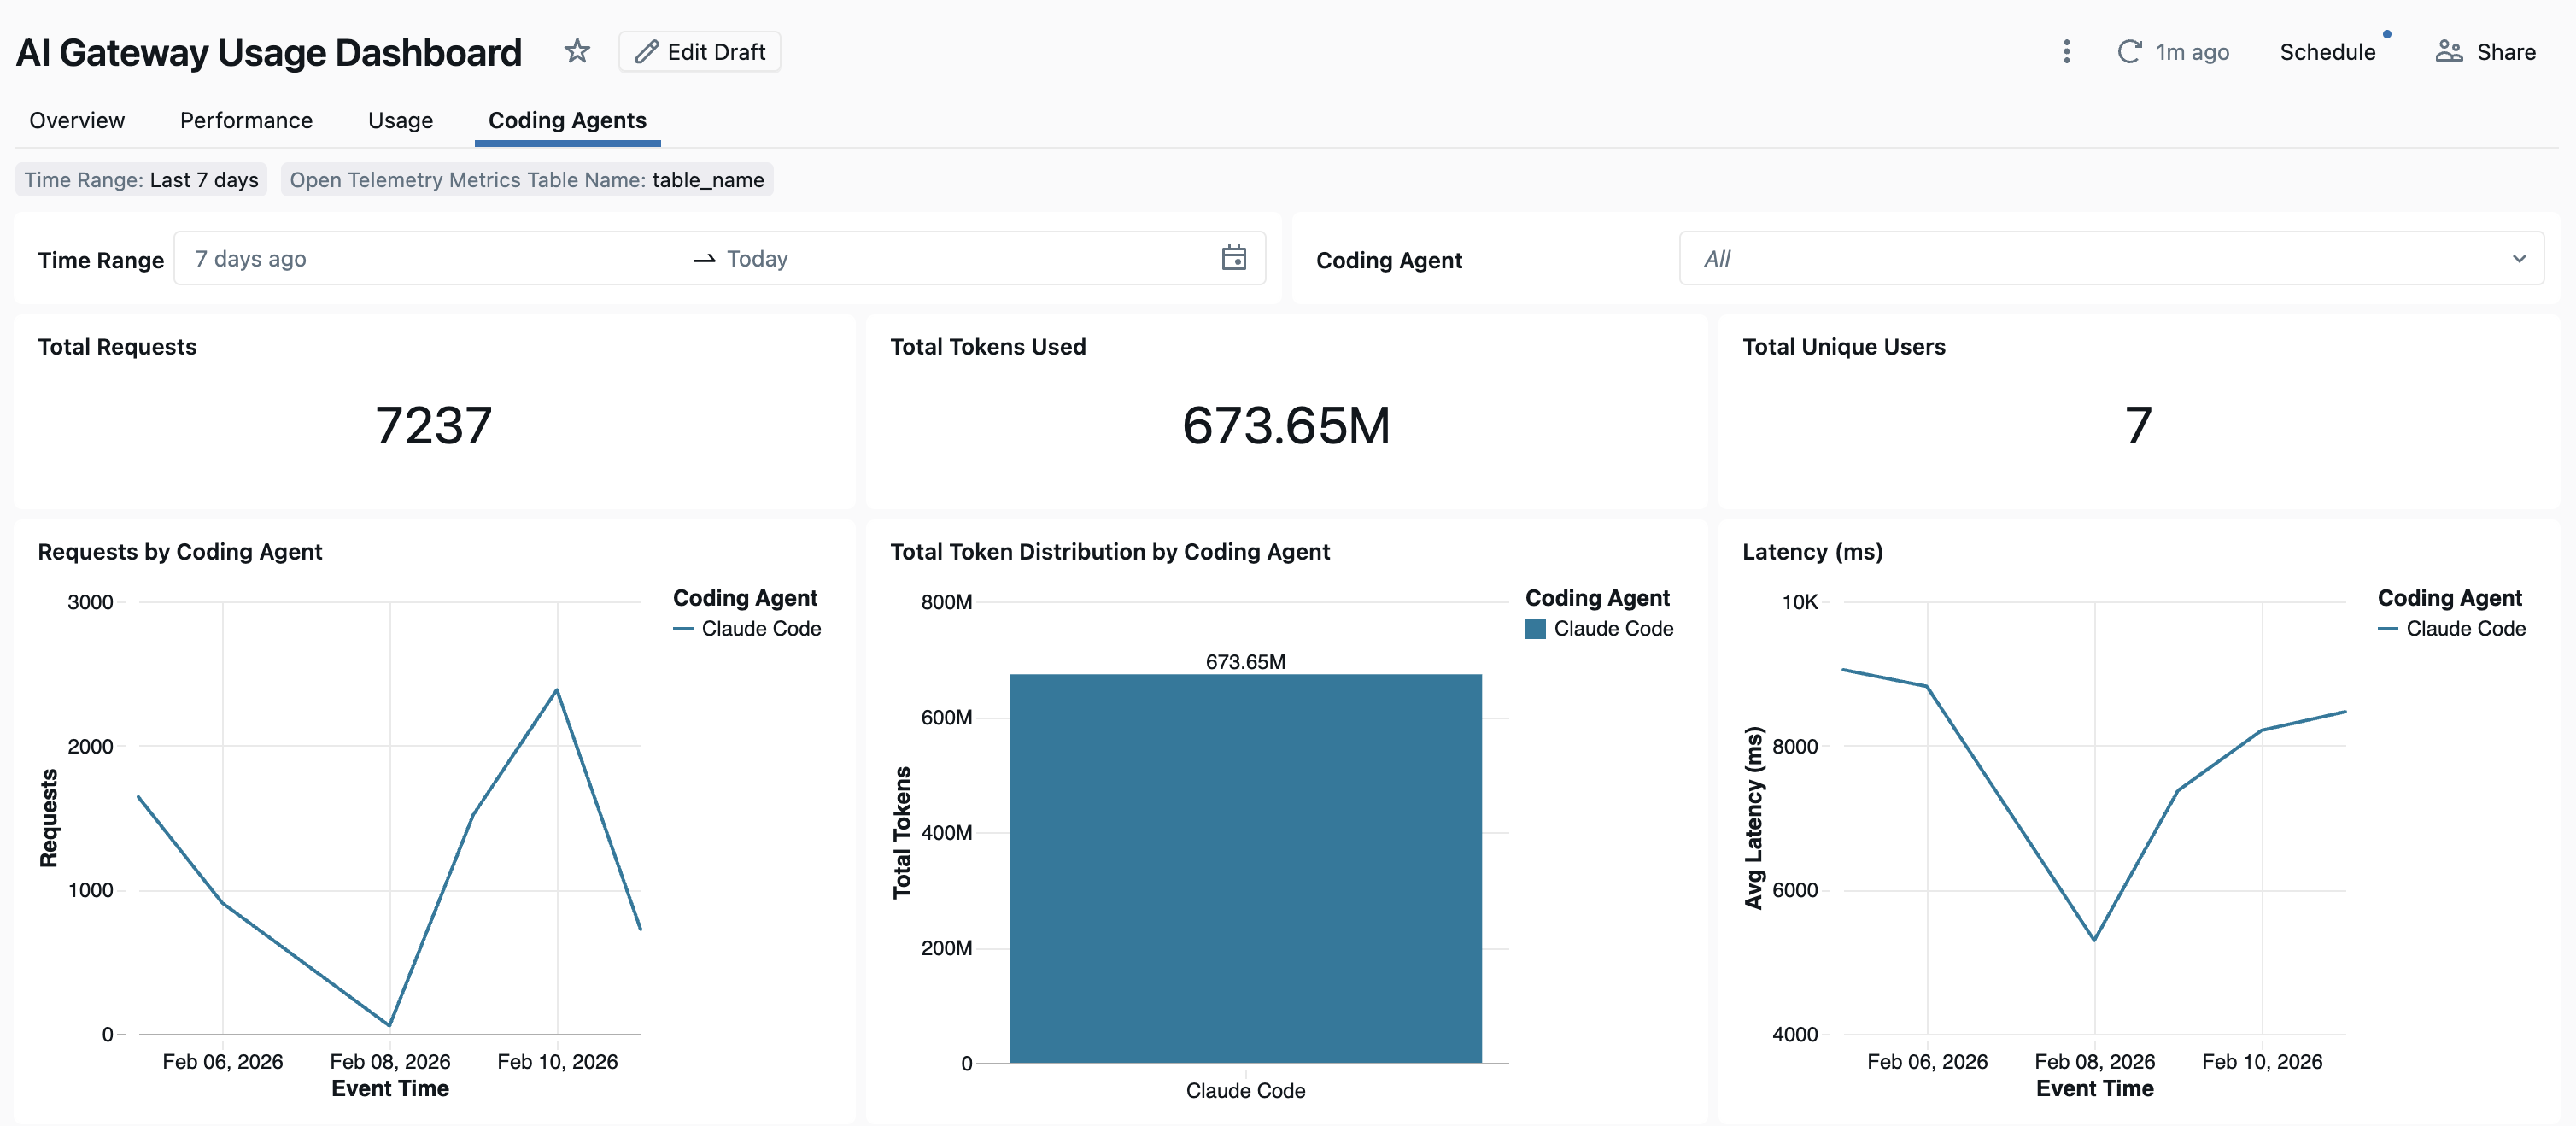
Once coding agent usage is tracked through AI Gateway, you can view and monitor your metrics in the out-of-the-box dashboard.
To access the dashboard, select View dashboard from the AI Gateway page. This creates a pre-configured dashboard with graphs for coding tool usage.
Set up OpenTelemetry data collection
Azure Databricks supports exporting OpenTelemetry metrics and logs from coding agents to Unity Catalog managed Delta tables. All metrics are time series data exported using the OpenTelemetry standard metrics protocol, and logs are exported using the OpenTelemetry logs protocol.
Requirements
- OpenTelemetry on Azure Databricks preview enabled. See Manage Azure Databricks previews.
Step 1: Create OpenTelemetry tables in Unity Catalog
Create Unity Catalog managed tables preconfigured with the OpenTelemetry metrics and logs schemas.
Metrics table
CREATE TABLE <catalog>.<schema>.<table_prefix>_otel_metrics (
  name STRING,
  description STRING,
  unit STRING,
  metric_type STRING,
  gauge STRUCT<
    start_time_unix_nano: LONG,
    time_unix_nano: LONG,
    value: DOUBLE,
    exemplars: ARRAY<STRUCT<
      time_unix_nano: LONG,
      value: DOUBLE,
      span_id: STRING,
      trace_id: STRING,
      filtered_attributes: MAP<STRING, STRING>
    >>,
    attributes: MAP<STRING, STRING>,
    flags: INT
  >,
  sum STRUCT<
    start_time_unix_nano: LONG,
    time_unix_nano: LONG,
    value: DOUBLE,
    exemplars: ARRAY<STRUCT<
      time_unix_nano: LONG,
      value: DOUBLE,
      span_id: STRING,
      trace_id: STRING,
      filtered_attributes: MAP<STRING, STRING>
    >>,
    attributes: MAP<STRING, STRING>,
    flags: INT,
    aggregation_temporality: STRING,
    is_monotonic: BOOLEAN
  >,
  histogram STRUCT<
    start_time_unix_nano: LONG,
    time_unix_nano: LONG,
    count: LONG,
    sum: DOUBLE,
    bucket_counts: ARRAY<LONG>,
    explicit_bounds: ARRAY<DOUBLE>,
    exemplars: ARRAY<STRUCT<
      time_unix_nano: LONG,
      value: DOUBLE,
      span_id: STRING,
      trace_id: STRING,
      filtered_attributes: MAP<STRING, STRING>
    >>,
    attributes: MAP<STRING, STRING>,
    flags: INT,
    min: DOUBLE,
    max: DOUBLE,
    aggregation_temporality: STRING
  >,
  exponential_histogram STRUCT<
    attributes: MAP<STRING, STRING>,
    start_time_unix_nano: LONG,
    time_unix_nano: LONG,
    count: LONG,
    sum: DOUBLE,
    scale: INT,
    zero_count: LONG,
    positive_bucket: STRUCT<
      offset: INT,
      bucket_counts: ARRAY<LONG>
    >,
    negative_bucket: STRUCT<
      offset: INT,
      bucket_counts: ARRAY<LONG>
    >,
    flags: INT,
    exemplars: ARRAY<STRUCT<
      time_unix_nano: LONG,
      value: DOUBLE,
      span_id: STRING,
      trace_id: STRING,
      filtered_attributes: MAP<STRING, STRING>
    >>,
    min: DOUBLE,
    max: DOUBLE,
    zero_threshold: DOUBLE,
    aggregation_temporality: STRING
  >,
  summary STRUCT<
    start_time_unix_nano: LONG,
    time_unix_nano: LONG,
    count: LONG,
    sum: DOUBLE,
    quantile_values: ARRAY<STRUCT<
      quantile: DOUBLE,
      value: DOUBLE
    >>,
    attributes: MAP<STRING, STRING>,
    flags: INT
  >,
  metadata MAP<STRING, STRING>,
  resource STRUCT<
    attributes: MAP<STRING, STRING>,
    dropped_attributes_count: INT
  >,
  resource_schema_url STRING,
  instrumentation_scope STRUCT<
    name: STRING,
    version: STRING,
    attributes: MAP<STRING, STRING>,
    dropped_attributes_count: INT
  >,
  metric_schema_url STRING
) USING DELTA
TBLPROPERTIES (
  'otel.schemaVersion' = 'v1'
)
Logs table
CREATE TABLE <catalog>.<schema>.<table_prefix>_otel_logs (
  event_name STRING,
  trace_id STRING,
  span_id STRING,
  time_unix_nano LONG,
  observed_time_unix_nano LONG,
  severity_number STRING,
  severity_text STRING,
  body STRING,
  attributes MAP<STRING, STRING>,
  dropped_attributes_count INT,
  flags INT,
  resource STRUCT<
    attributes: MAP<STRING, STRING>,
    dropped_attributes_count: INT
  >,
  resource_schema_url STRING,
  instrumentation_scope STRUCT<
    name: STRING,
    version: STRING,
    attributes: MAP<STRING, STRING>,
    dropped_attributes_count: INT
  >,
  log_schema_url STRING
) USING DELTA
TBLPROPERTIES (
  'otel.schemaVersion' = 'v1'
)
Step 2: Update env vars in your coding agent
In any coding agent with OpenTelemetry metric support enabled, configure the following environment variables.
{
  "OTEL_METRICS_EXPORTER": "otlp",
  "OTEL_EXPORTER_OTLP_METRICS_PROTOCOL": "http/protobuf",
  "OTEL_EXPORTER_OTLP_METRICS_ENDPOINT": "https://<workspace-url>/api/2.0/otel/v1/metrics",
  "OTEL_EXPORTER_OTLP_METRICS_HEADERS": "content-type=application/x-protobuf,Authorization=Bearer <databricks_pat_token>,X-Databricks-UC-Table-Name=<catalog>.<schema>.<table_prefix>_otel_metrics",
  "OTEL_METRIC_EXPORT_INTERVAL": "10000",
  "OTEL_LOGS_EXPORTER": "otlp",
  "OTEL_EXPORTER_OTLP_LOGS_PROTOCOL": "http/protobuf",
  "OTEL_EXPORTER_OTLP_LOGS_ENDPOINT": "https://<workspace-url>/api/2.0/otel/v1/logs",
  "OTEL_EXPORTER_OTLP_LOGS_HEADERS": "content-type=application/x-protobuf,Authorization=Bearer <databricks_pat_token>,X-Databricks-UC-Table-Name=<catalog>.<schema>.<table_prefix>_otel_logs",
  "OTEL_LOGS_EXPORT_INTERVAL": "5000"
}
Step 3: Run your coding agent.
Your data should propagate to the Unity Catalog tables within 5 minutes.