Muistiinpano
Tälle sivulle pääsy edellyttää valtuutusta. Voit yrittää kirjautua sisään tai vaihtaa hakemistoja.
Tälle sivulle pääsy edellyttää valtuutusta. Voit yrittää vaihtaa hakemistoja.
In this article, you learn how to use troubleshooting guides for Azure Database for PostgreSQL flexible server from the Azure portal. To learn more about troubleshooting guides, see the overview.
Prerequisites
To effectively troubleshoot a specific issue, you need to make sure that you have all the necessary data in place. Each troubleshooting guide requires a specific set of data, which is sourced from three separate features: Diagnostic settings, Query Store, and Enhanced metrics. All troubleshooting guides require logs to be sent to a Log Analytics workspace, but the specific category of logs to be captured may vary depending on the particular guide.
Please, follow the steps described in Configure and Access Logs - Azure Database for PostgreSQL flexible server to configure diagnostic settings and send the logs to a Log Analytics workspace.
Query Store, and Enhanced metrics are configured via Server parameters. Please follow the steps described in the configure server parameters in Azure Database for PostgreSQL flexible server articles for Azure portal or Azure CLI.
The table below provides information on the required log categories for each troubleshooting guide, as well as the necessary Query Store, Enhanced metrics and Server parameters prerequisites.
| Troubleshooting guide | Diagnostic settings log categories and metrics | Query Store | Enhanced metrics | Server parameters |
|---|---|---|---|---|
| CPU | PostgreSQL Server Logs PostgreSQL Server Sessions data PostgreSQL Server Query Store Runtime AllMetrics |
pg_qs.query_capture_mode to TOP or ALL | metrics.collector_database_activity | N/A |
| Memory | PostgreSQL Server Logs PostgreSQL Server Sessions data PostgreSQL Server Query Store Runtime |
pg_qs.query_capture_mode to TOP or ALL | metrics.collector_database_activity | N/A |
| IOPS | PostgreSQL Server Query Store Runtime PostgreSQL Server Logs PostgreSQL Server Sessions data PostgreSQL Server Query Store Wait Statistics |
pg_qs.query_capture_mode to TOP or ALL pgms_wait_sampling.query_capture_mode to ALL |
metrics.collector_database_activity | track_io_timing to ON |
| Temporary files | PostgreSQL Server Sessions data PostgreSQL Server Query Store Runtime PostgreSQL Server Query Store Wait Statistics |
pg_qs.query_capture_mode to TOP or ALL pgms_wait_sampling.query_capture_mode to ALL |
metrics.collector_database_activity | N/A |
| Autovacuum monitoring | PostgreSQL Server Logs PostgreSQL Autovacuum and schema statistics PostgreSQL remaining transactions |
N/A | N/A | log_autovacuum_min_duration |
| Autovacuum blockers | PostgreSQL Server Sessions data PostgreSQL remaining transactions |
N/A | N/A | N/A |
Note
Please note that if you have recently enabled diagnostic settings, query store, enhanced metrics or server parameters, it may take some time for the data to be populated. Additionally, if there has been no activity on the database within a certain time frame, the charts might appear empty. In such cases, try changing the time range to capture relevant data. Be patient and allow the system to collect and display the necessary data before proceeding with your troubleshooting efforts.
Using the troubleshooting guides
To use the troubleshooting guides, follow these steps:
Open the Azure portal and find an Azure Database for PostgreSQL flexible server instance that you want to examine.
From the left-side menu, under the Monitoring section, select Troubleshooting guides.
Navigate to the top of the page where you will find a series of tabs, each representing one of the six problems you may wish to resolve. Click on the relevant tab.
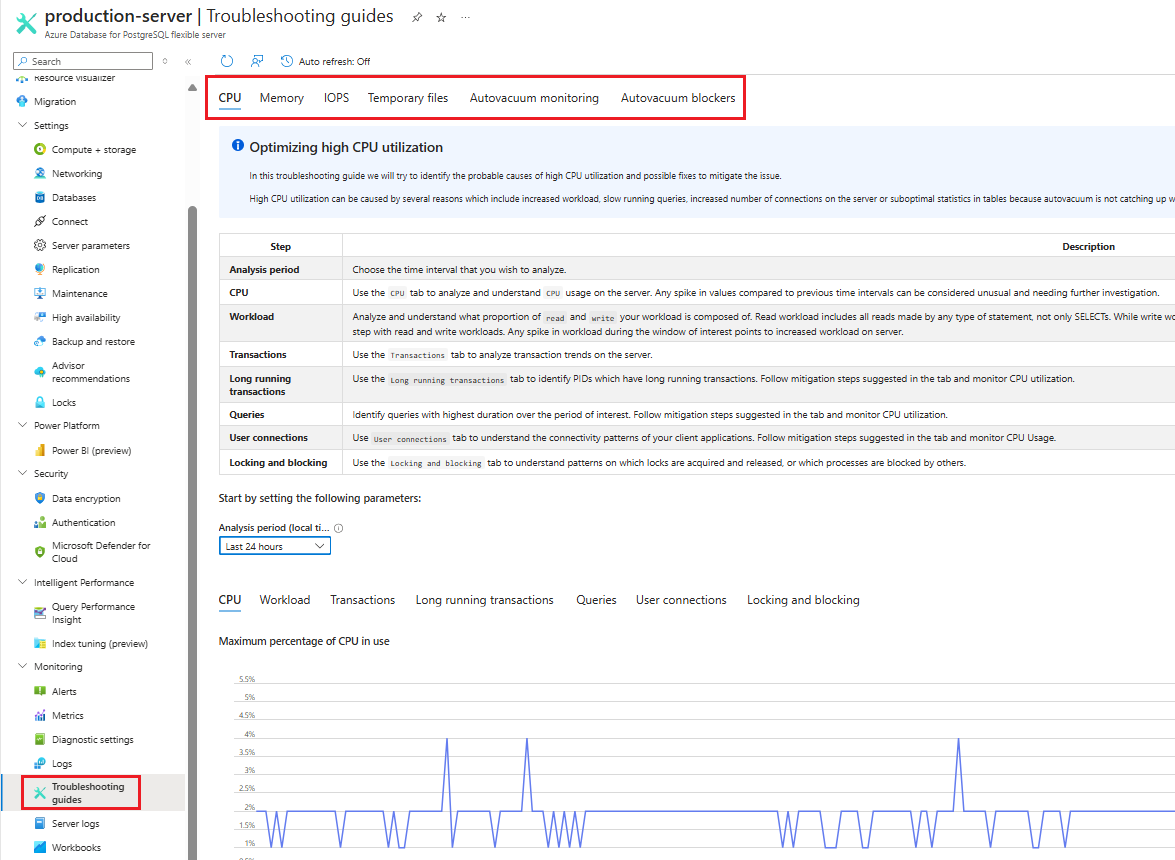
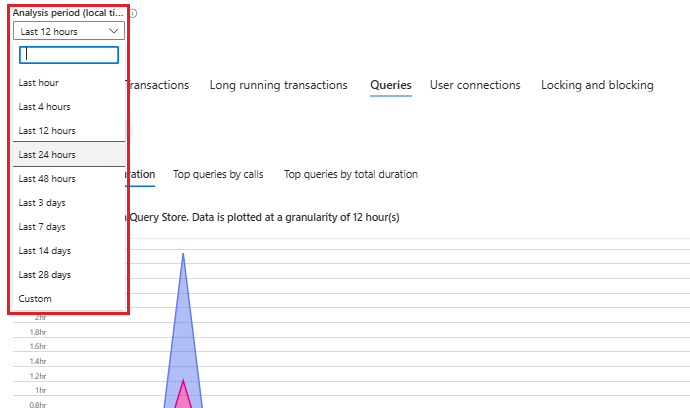
Select the period of time which you want to analyze.
Follow the step-by-step instructions provided by the guide. Pay close attention to the charts and data visualizations plotted within the troubleshooting steps, as they can help you identify any inaccuracies or anomalies. Use this information to effectively diagnose and resolve the problem at hand.
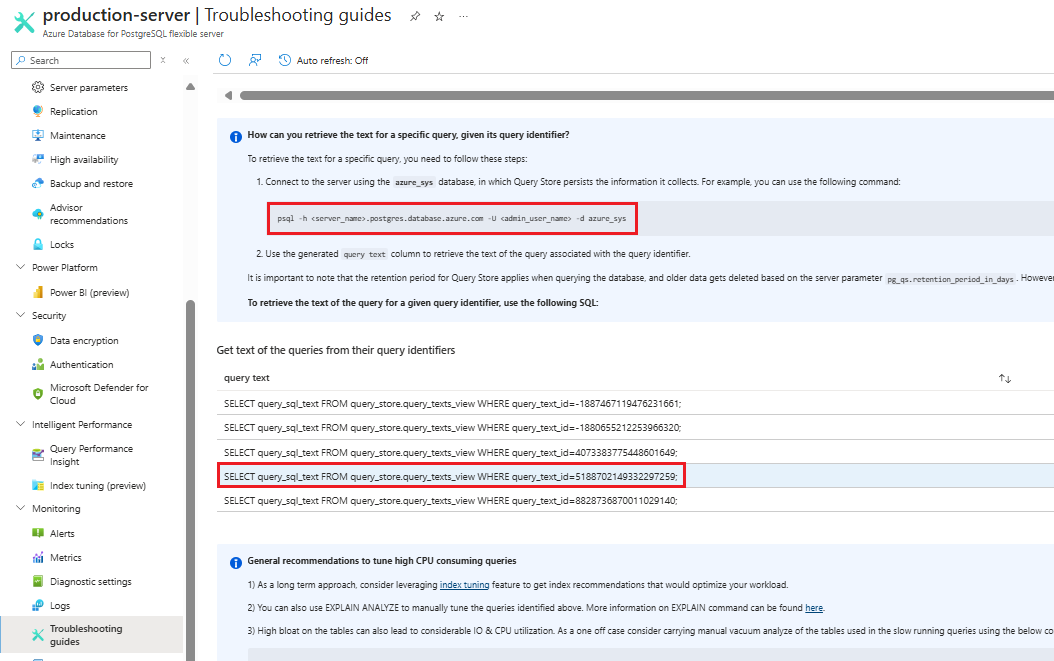
Retrieving the text of queries collected by query store
Due to privacy considerations, certain information such as query text and usernames may not be displayed within the Azure portal.
To retrieve the text of those queries collected by query store, you need to log in to your Azure Database for PostgreSQL flexible server instance.
Using the PostgreSQL client of your choice, access the azure_sys database where query store data is stored.
Once connected, query the query_store.query_texts_view view to retrieve the desired query text.
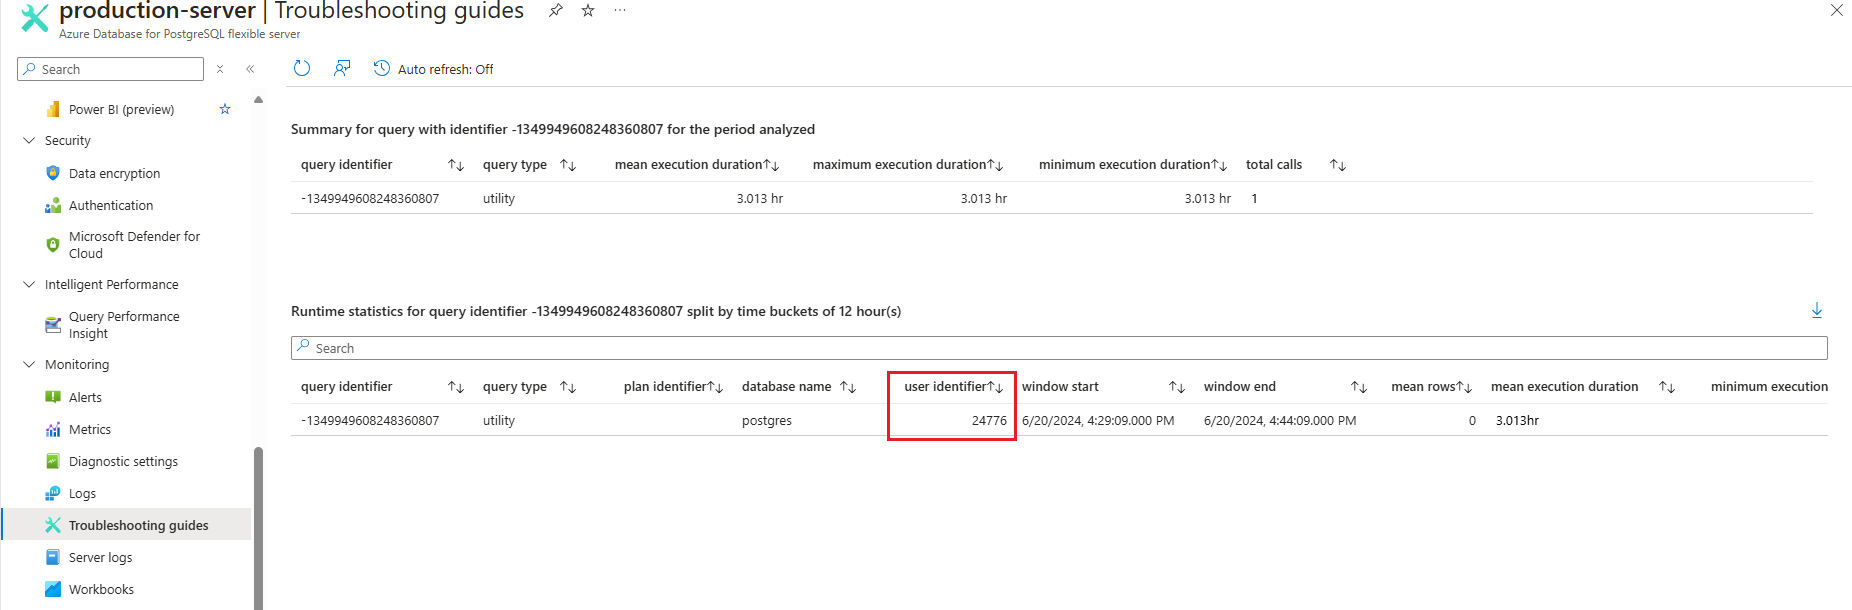
Retrieving the name of a user or role
For privacy reasons, the Azure portal displays the role ID from the PostgreSQL metadata (pg_catalog) rather than the actual username.
To retrieve the username, you can query the pg_roles view or use the query shown below in your PostgreSQL client of choice, such as Azure Cloud Shell and the psql tool:
SELECT 'UserID'::regrole;
In the following example you would be retrieving the name of the user or role whose identifier is 24776.
SELECT '24776'::regrole;
Related content
- Configure intelligent tuning for Azure Database for PostgreSQL flexible server.
- Troubleshooting guides for Azure Database for PostgreSQL flexible server.
- Autovacuum tuning in Azure Database for PostgreSQL flexible server.
- Troubleshoot high IOPS utilization in Azure Database for PostgreSQL flexible server.
- Best practices for uploading data in bulk in Azure Database for PostgreSQL flexible server.
- Troubleshoot high CPU utilization in Azure Database for PostgreSQL flexible server.
- Query Performance Insight in Azure Database for PostgreSQL flexible server.