Monitor and troubleshoot memory usage with in-memory OLTP
Applies to:
SQL Server
In-Memory OLTP consumes memory in different patterns than disk-based tables. You can monitor the amount of memory allocated and used by memory-optimized tables and indexes in your database using the DMVs or performance counters provided for memory and the garbage collection subsystem. This gives you visibility at both the system and database level and lets you prevent problems due to memory exhaustion.
This article covers monitoring your In-Memory OLTP memory usage for SQL Server.
Note
This tutorial does not apply in Azure SQL Managed Instance or Azure SQL Database. Instead, for a demonstration of in-memory OLTP in Azure SQL, see:
For more information on monitoring in-memory OLTP usage, see:
1. Create a sample database with memory-optimized tables
The following steps create a database to use for our exercise.
Launch SQL Server Management Studio.
Select New Query.
Note
You can skip this next step if you already have a database with memory-optimized tables.
Paste this code into the new query window and execute each section to create the test database for this exercise,
IMOLTP_DB.-- create a database to be used CREATE DATABASE IMOLTP_DB GOThe sample script below uses
C:\Data, but your instance likely uses different folder locations for database data files. Update the following script to use a proper location for the in-memory file location, and execute.ALTER DATABASE IMOLTP_DB ADD FILEGROUP IMOLTP_DB_xtp_fg CONTAINS MEMORY_OPTIMIZED_DATA ALTER DATABASE IMOLTP_DB ADD FILE( NAME = 'IMOLTP_DB_xtp' , FILENAME = 'C:\Data\IMOLTP_DB_xtp') TO FILEGROUP IMOLTP_DB_xtp_fg; GOThe following script will create three memory-optimized tables that you can use in the remainder of this topic. In the example, we mapped the database to a resource pool so that we can control how much memory can be taken by memory-optimized tables. Execute the following script in the
IMOLTP_DBdatabase.-- create some tables USE IMOLTP_DB GO -- create the resoure pool CREATE RESOURCE POOL PoolIMOLTP WITH (MAX_MEMORY_PERCENT = 60); ALTER RESOURCE GOVERNOR RECONFIGURE; GO -- bind the database to a resource pool EXEC sp_xtp_bind_db_resource_pool 'IMOLTP_DB', 'PoolIMOLTP' -- you can query the binding using the catalog view as described here SELECT d.database_id , d.name , d.resource_pool_id FROM sys.databases d GO -- take database offline/online to finalize the binding to the resource pool USE master GO ALTER DATABASE IMOLTP_DB SET OFFLINE GO ALTER DATABASE IMOLTP_DB SET ONLINE GO -- create some tables USE IMOLTP_DB GO -- create table t1 CREATE TABLE dbo.t1 ( c1 int NOT NULL CONSTRAINT [pk_t1_c1] PRIMARY KEY NONCLUSTERED , c2 char(40) NOT NULL , c3 char(8000) NOT NULL ) WITH (MEMORY_OPTIMIZED = ON, DURABILITY = SCHEMA_AND_DATA) GO -- load t1 150K rows DECLARE @i int = 0 BEGIN TRAN WHILE (@i <= 150000) BEGIN INSERT t1 VALUES (@i, 'a', replicate ('b', 8000)) SET @i += 1; END Commit GO -- Create another table, t2 CREATE TABLE dbo.t2 ( c1 int NOT NULL CONSTRAINT [pk_t2_c1] PRIMARY KEY NONCLUSTERED , c2 char(40) NOT NULL , c3 char(8000) NOT NULL ) WITH (MEMORY_OPTIMIZED = ON, DURABILITY = SCHEMA_AND_DATA) GO -- Create another table, t3 CREATE TABLE dbo.t3 ( c1 int NOT NULL CONSTRAINT [pk_t3_c1] PRIMARY KEY NONCLUSTERED HASH (c1) WITH (BUCKET_COUNT = 1000000) , c2 char(40) NOT NULL , c3 char(8000) NOT NULL ) WITH (MEMORY_OPTIMIZED = ON, DURABILITY = SCHEMA_AND_DATA) GO
2. Monitor memory usage
Monitor memory usage with SQL Server Management Studio
Since SQL Server 2014 (12.x), SQL Server Management Studio has built-in standard reports to monitor the memory consumed by in-memory tables. You can access these reports using Object Explorer. You can also use the object explorer to monitor memory consumed by individual memory-optimized tables.
Consumption at the database level
You can monitor memory use at the database level as follows.
Launch SQL Server Management Studio and connect to your SQL Server or SQL managed instance.
In Object Explorer, right-click the database you want reports on.
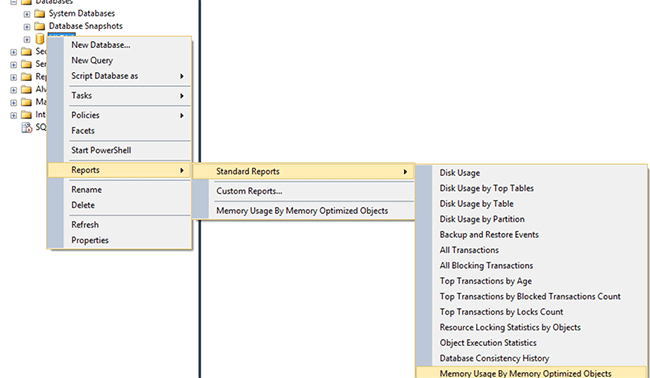
In the context menu select, Reports -> Standard Reports -> Memory Usage By Memory Optimized Objects

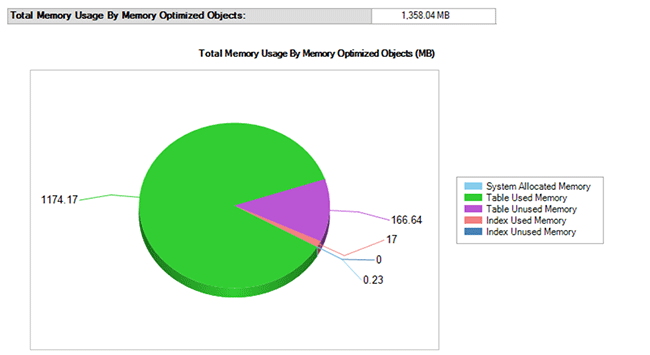
This report shows memory consumption by the database we created above.

Monitor memory usage with DMVs
There are many DMVs available to monitor memory consumed by memory-optimized tables, indexes, system objects, and by run-time structures.
Memory consumption by memory-optimized tables and indexes
You can find memory consumption for all user tables, indexes, and system objects by querying sys.dm_db_xtp_table_memory_stats as shown here.
SELECT object_name(object_id) AS [Name]
     , *
   FROM sys.dm_db_xtp_table_memory_stats;
Sample Output
Name       object_id   memory_allocated_for_table_kb memory_used_by_table_kb memory_allocated_for_indexes_kb memory_used_by_indexes_kb
---------- ----------- ----------------------------- ----------------------- ------------------------------- -------------------------
t3         629577281   0                             0                       128                             0
t1         565577053   1372928                       1200008                 7872                            1942
t2         597577167   0                             0                       128                             0
NULL       -6          0                             0                       2                               2
NULL       -5          0                             0                       24                              24
NULL       -4          0                             0                       2                               2
NULL       -3          0                             0                       2                               2
NULL       -2          192                           25                      16                              16
For more information, see sys.dm_db_xtp_table_memory_stats.
Memory consumption by internal system structures
Memory is also consumed by system objects, such as transactional structures, buffers for data and delta files, garbage collection structures, and more. You can find the memory used for these system objects by querying sys.dm_xtp_system_memory_consumers as shown here.
SELECT memory_consumer_desc
     , allocated_bytes/1024 AS allocated_bytes_kb
     , used_bytes/1024 AS used_bytes_kb
     , allocation_count
   FROM sys.dm_xtp_system_memory_consumers
Sample Output
memory_consumer_ desc allocated_bytes_kb   used_bytes_kb        allocation_count
------------------------- -------------------- -------------------- ----------------
VARHEAP                   0                    0                    0
VARHEAP                   384                  0                    0
DBG_GC_OUTSTANDING_T      64                   64                   910
ACTIVE_TX_MAP_LOOKAS      0                    0                    0
RECOVERY_TABLE_CACHE      0                    0                    0
RECENTLY_USED_ROWS_L      192                  192                  261
RANGE_CURSOR_LOOKSID      0                    0                    0
HASH_CURSOR_LOOKASID      128                  128                  455
SAVEPOINT_LOOKASIDE       0                    0                    0
PARTIAL_INSERT_SET_L      192                  192                  351
CONSTRAINT_SET_LOOKA      192                  192                  646
SAVEPOINT_SET_LOOKAS      0                    0                    0
WRITE_SET_LOOKASIDE       192                  192                  183
SCAN_SET_LOOKASIDE        64                   64                   31
READ_SET_LOOKASIDE        0                    0                    0
TRANSACTION_LOOKASID      448                  448                  156
PGPOOL:256K               768                  768                  3
PGPOOL: 64K               0                    0                    0
PGPOOL:  4K               0                    0                    0
For more information, see sys.dm_xtp_system_memory_consumers).
Memory consumption at run-time when accessing memory-optimized tables
You can determine the memory consumed by run time structures, such as the procedure cache with the following query: run this query to get the memory used by run-time structures such as for the procedure cache. All run-time structures are tagged with XTP.
SELECT memory_object_address
     , pages_in_bytes
     , bytes_used
     , type
   FROM sys.dm_os_memory_objects WHERE type LIKE '%xtp%'
Sample Output
memory_object_address pages_ in_bytes bytes_used type
--------------------- ------------------- ---------- ----
0x00000001F1EA8040    507904              NULL       MEMOBJ_XTPDB
0x00000001F1EAA040    68337664            NULL       MEMOBJ_XTPDB
0x00000001FD67A040    16384               NULL       MEMOBJ_XTPPROCCACHE
0x00000001FD68C040    16384               NULL       MEMOBJ_XTPPROCPARTITIONEDHEAP
0x00000001FD284040    16384               NULL       MEMOBJ_XTPPROCPARTITIONEDHEAP
0x00000001FD302040    16384               NULL       MEMOBJ_XTPPROCPARTITIONEDHEAP
0x00000001FD382040    16384               NULL       MEMOBJ_XTPPROCPARTITIONEDHEAP
0x00000001FD402040    16384               NULL       MEMOBJ_XTPPROCPARTITIONEDHEAP
0x00000001FD482040    16384               NULL       MEMOBJ_XTPPROCPARTITIONEDHEAP
0x00000001FD502040    16384               NULL       MEMOBJ_XTPPROCPARTITIONEDHEAP
0x00000001FD67E040    16384               NULL       MEMOBJ_XTPPROCPARTITIONEDHEAP
0x00000001F813C040    8192                NULL       MEMOBJ_XTPBLOCKALLOC
0x00000001F813E040    16842752            NULL       MEMOBJ_XTPBLOCKALLOC
For more information, see sys.dm_os_memory_objects (Transact-SQL).
Memory consumed by In-Memory OLTP engine across the instance
Memory allocated to the In-Memory OLTP engine and the memory-optimized objects is managed the same way as any other memory consumer within a SQL Server instance. The clerks of type MEMORYCLERK_XTP accounts for all the memory allocated to In-Memory OLTP engine. Use the following query to find all the memory used by the In-Memory OLTP engine.
-- This DMV accounts for all memory used by the in-memory engine
SELECT type
   , name
   , memory_node_id
   , pages_kb/1024 AS pages_MB
   FROM sys.dm_os_memory_clerks WHERE type LIKE '%xtp%'
The following sample output shows that the memory allocated is 18 MB system-level memory and 1358 MB allocated to database_id = 5. Since this database is mapped to a dedicated resource pool, this memory is accounted for in that resource pool.
type                 name       memory_node_id pages_MB
-------------------- ---------- -------------- --------------------
MEMORYCLERK_XTP      Default    0              18
MEMORYCLERK_XTP      DB_ID_5    0              1358
MEMORYCLERK_XTP      Default    64             0
For more information, see sys.dm_os_memory_clerks.
3. Manage memory consumed by memory-optimized objects
You can control the total memory consumed by memory-optimized tables by binding it to a named resource pool. For more information, see Bind a database with memory-optimized tables to a resource pool.
Troubleshoot memory issues
Troubleshooting memory issues is a three-step process:
Identify how much memory is being consumed by the objects in your database or instance. You can use a rich set of monitoring tools available for memory-optimized tables as described earlier. For example, see the sample queries on the DMVs
sys.dm_db_xtp_table_memory_statsorsys.dm_os_memory_clerks.Determine how memory consumption is growing and how much head room you have left. By monitoring the memory consumption periodically, you can know how the memory use is growing. For example, if you have mapped the database to a named resource pool, you can monitor the performance counter Used Memory (KB) to see how memory usage is growing.
Take action to mitigate the potential memory issues. For more information, see Resolve Out Of Memory Issues.