View usage data for Viva Connections
Understand how and when users engage with components of the Connections experience by using analytics. Review data on overall traffic, usage, and engagement across each of your organization's Connections experiences. Data can be further filtered to view a specified range or downloaded as an analytics report in Excel.
Note
- Member level permissions (or higher) are required to view usage analytics for Connections.
- Usage analytics data is aggregated and can't be tracked to an individual user.
- You must have an Enterprise (E), Frontline (F), or Academic (A) license type to create a Viva Connections experience.
- Users with a Microsoft 365 subscription (E, F, or A license) are limited to creating and using one experience. If you want to create or use two or more experiences (up to 50), then every user in your tenant must have a Microsoft Viva Suite or Viva Communications and Communities license. See Microsoft Viva plans and pricing for more info.
- For tenants that are set up for more than one region, the option to access analytics will have to be disabled for each region using PowerShell commands. For more information, see how to disable analytics features.
- The analytics feature is unavailable in GCC, GCC High, and DoD environments. For more information, see the list of platform features.
How to access the report
Users need member level permissions (or higher) in their Connections experience to access and view the analytics data for that experience. For organizations that have more than one Connections experience, you can view the analytics report for each experience by going to that experience and opening the report.
Analytics data for Connections can be accessed from your SharePoint home site or the Connections app in Microsoft Teams.
Access analytics data from a SharePoint home site
Navigate to your organization’s SharePoint home site.
Select the Settings
 icon.
icon.Select Manage Viva Connections.
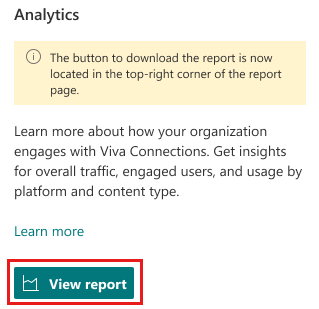
Go to the Analytics section and select View report.
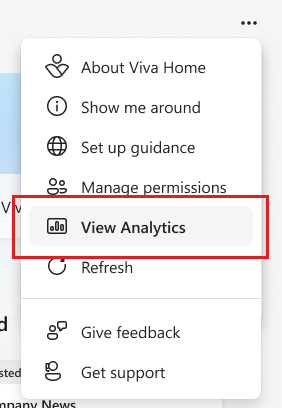
Access analytics data from Microsoft Teams
Navigate to your organization’s Connections app in Teams.
Select the ellipsis in the top-right corner.
Select View Analytics
What’s in the usage report
The Analytics page contains charts and graphs providing data on overall traffic, usage, and engagement for your accessed Connections experience. Data can be filtered down to the last 7, 30, or 90 days. Overall traffic data can be filtered to the last 12 months.
Note
- A Microsoft Viva suite or Viva Communications and Communities license is required to view data beyond 30 days. For more information, see Microsoft Viva plans and pricing.
- Data filtered to the previous 90 days and 12 months will be available in mid-June 2024. Historical data for these new filters won't be available.
Overall traffic
This section provides usage data on unique users, engaged users, total views, and returning users. Activity for desktop, web, and mobile usage is combined in this section, regardless of the platform.
- Unique users: Total number of individual users regardless of how many times they visited across all Connections platforms and devices.
- Engaged users: Total number of individual viewers who interact with Connections content types.
- Total views: Total number of views across all Connections platforms and devices.
- Returning users: Can view by the percentage or number of users who engaged with Connections content since the last month over a 12-month view. Select the dropdown to switch viewing data on returning users by percentage and individual user.
Note
A Microsoft Viva suite or Viva Communications and Communities license is required to view data on returning users. For more information, see Microsoft Viva plans and pricing.

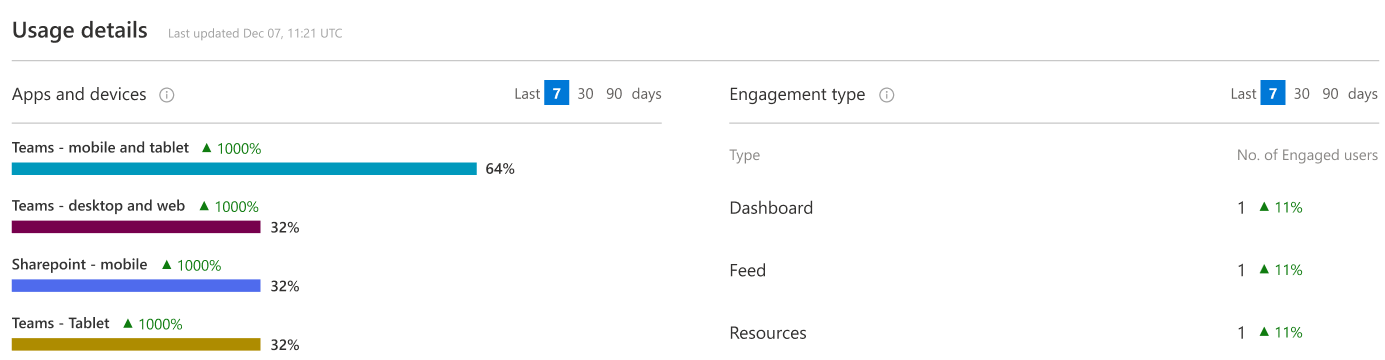
Usage details
This section breaks down usage data across the types of devices and apps used to access the Connections experience, including activity from the Dashboard, Feed, and Resources.
Note
An update is planned for Q2 2025 that will replace the Feed experience with an Enterprise News Reader that will present news that's recommended for you from your organization.
- Total views by apps and devices: Includes views for desktop, web, and mobile usage.
- Engaged users by component: Includes number of engaged users for the Dashboard, Feed, and Resources web parts.
Dashboard: Includes usage from the Dashboard.
Feed: Includes usage from the Feed.
Resources: Includes usage from the tab in the mobile app and the desktop app (The global navigation bar in SharePoint isn't included).

Engagement details
Engaged users by dashboard card: Includes usage data for each dashboard card on your dashboard, indicating how often each user engages with a card.


Filter and download reports
Reports can be filtered on the last 7, 30, or 90 days, or the last 12 months. To filter the data, select a range of days next to a graph.
Note
A Microsoft Viva suite or Viva Communications and Communities license is required to view or download report data beyond 30 days. For more information, see Microsoft Viva plans and pricing.

Select Download report at the top of the analytics page to download an Excel spreadsheet that contains all the information on the analytics page across three separate tabs and sheets of data. The spreadsheet contains all data available that the account has access to (based on license).

How to to disable analytics features
Your organization might not want to see analytics data due to local data and compliance regulations or other reasons. Use the following steps to disable the Connections analytics feature using PowerShell. For tenants that are set up for more than one region, the option to access analytics needs to be disabled for each region using the PowerShell command.
Make sure any previous versions of SharePoint Online Management Shell are uninstalled on your device (Settings > Apps > Installed apps > uninstall "SharePoint Online Management Shell").
Connect to SharePoint as a SharePoint Administrator in Microsoft 365. To learn how, see Getting started with SharePoint Online Management Shell.
Connect to the tenant's SharePoint service by running the following command:
Run
Connect-SPOService -Url <sharepoint admin URL> -Credential <credentials>Enter the password in the password field.
Run
Get-SPOTenantto view the tenant admin Settings.Locate the "DisableVivaConnectionsAnalytics" setting.
Enable or disable the setting by running the following command:
Run
Set-SPOTenant -DisableVivaConnectionsAnalytics $TrueRun
Get-SPOTenantto confirm the setting is updated.
Explanations for common report errors
You might see an error in the Analytics section. Review common errors to learn more about how to resolve them so you can download reports to view usage data for Connections.
Not enough data to generate a report
This message displays if there isn't enough usage data to generate a report. Finish setting up Connections and try to access the report again. For more information, see the guide to getting set up with Viva Connections.
General error
Sometimes due to connectivity issues or other technical problems, the analytics report might not be available. Check your network connection, refresh the page, and try loading the report again.
Errors within the downloaded report
Within the downloaded Excel report, you might notice that certain sections aren't available due to insufficient usage data. Learn more about how to amplify your organization’s instance of Viva Connections and the available Microsoft Viva adoption resources.
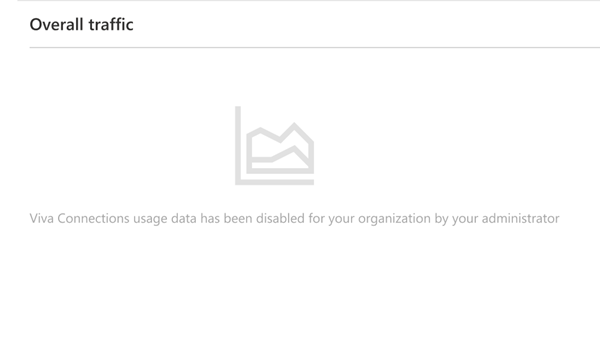
The report is disabled
You might get the following message: "Viva Connections usage data has been disabled for your organization by your administrator." This message means you can't access usage reports unless your admin enables the feature for your organization.