Exercise - Set up Scope 3 Category 2 Average spend-based calculations
In this exercise, you'll ingest Scope 3 Category 2 data to Sustainability Manager and define EEIO spend-based carbon emission calculations. This exercise builds on the knowledge that you learned in the Set up a sustainability solution using Microsoft Sustainability Manager content and serves as an introduction to EEIO spend-based calculations.
Important
Ensure that you've completed the previous exercise to create reference data. The data import process requires all reference data to exist, and the process is case-sensitive. Additionally, make sure that the reference data that was added has the exact case formatting as is found in the exercise. Failure to do so will result in errors during the data import process.
Important
To download the sample Microsoft Excel files that you'll ingest into Microsoft Sustainability Manager, go to sample data. In the GitHub page that appears, select the Download button. Extract the three Excel files to a folder on your local computer for use in this exercise.
Task: Ingest data
In this task, Devon will import Scope 3 capital goods, an Excel spreadsheet that Remy has provided. This step brings in the coffee roasting machines and office equipment that was purchased for the Houston and Fulshear facilities and then it adds them to the Scope 3 Category 4, capital goods activity data.

Remy Morris
Hi Devon, I've gathered capital goods data from the facilities and prepared a Scope 3 Category 2 activity data spreadsheet for 2022. Could you please ingest this data into Sustainability Manager? Thank you!
Yes, Remy, I'll start ingesting that data!

Devon Torres
Open Sustainability Manager.
On the left navigation pane, select Data > Imports.
Select + New.
Select POWER QUERY CONNECTORS.
Complete the following steps:
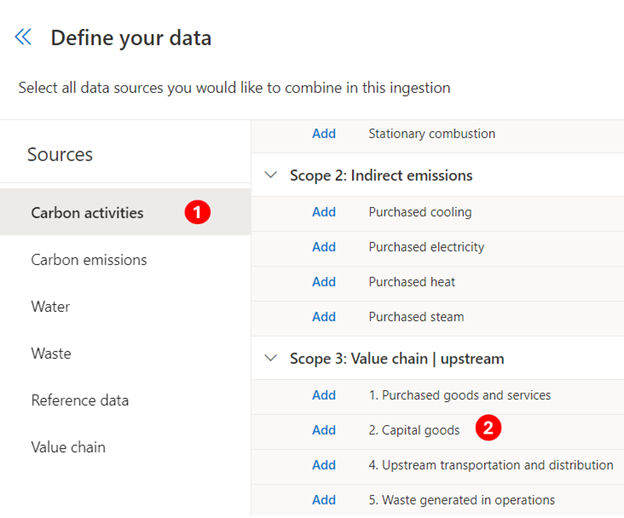
Select Sources > Carbon activities.
Select Add next to 2. Capital goods under Value chain | upstream.
Select Next when you're finished.
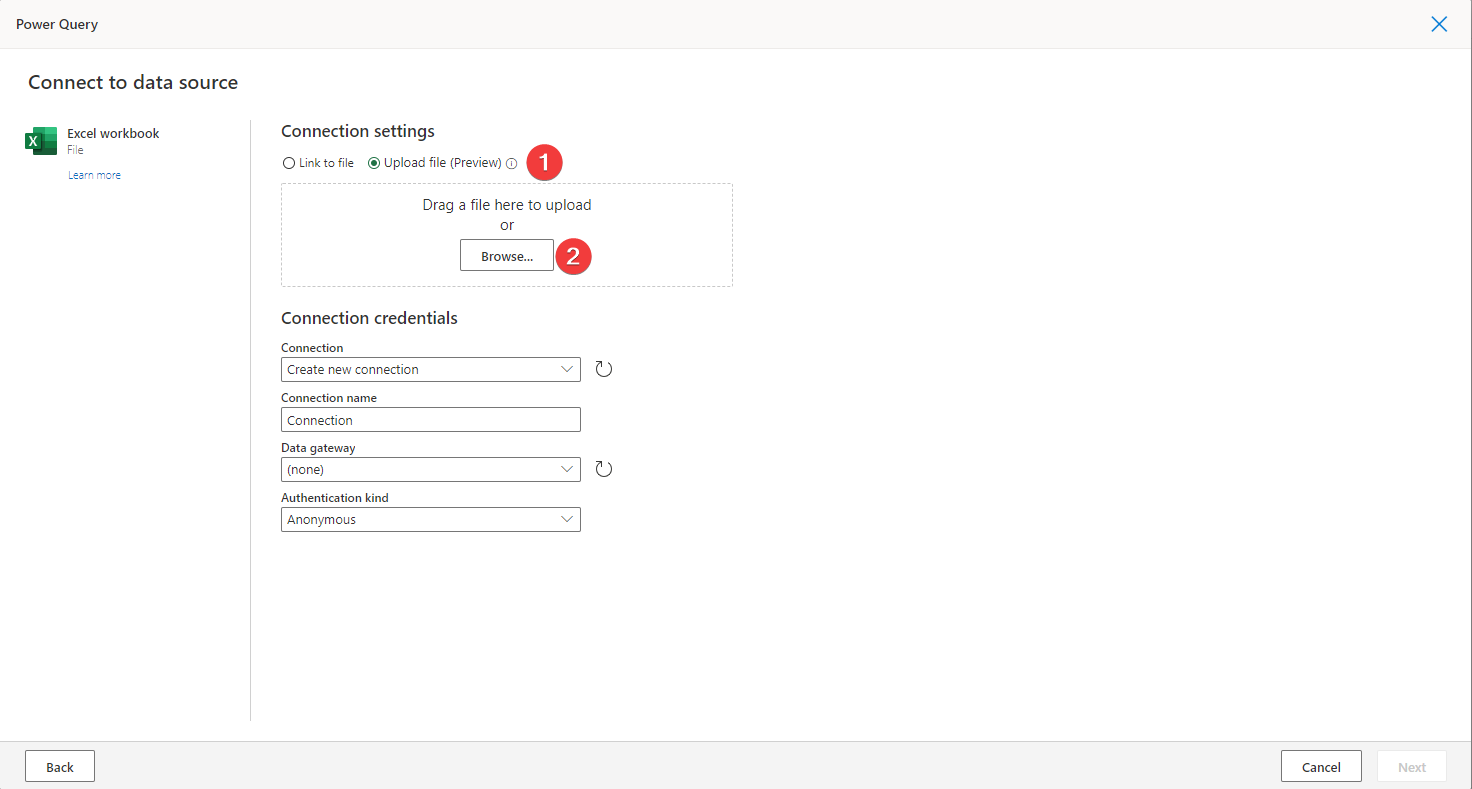
Select Excel workbook.
Select Upload file and then select Browse.
Note
You can also choose to import an existing file that's located in OneDrive. For simplicity of this exercise, you'll use the Upload file functionality. If you notice an error that prevents you from uploading the file, open a browser instance and then initiate OneDrive by going to https://portal.office.com/onedrive.
On the file selection window, browse to the location of the downloaded Excel files. Select the Scope 3 Capital Goods.xlsx file and then select Open.
After the file has successfully uploaded, select Sign-in to create a new connection credential.
A Microsoft Office 365 sign-in dialog will appear. Select your user account.
After the sign-in process is complete, the new connection will be selected automatically. Select Next.
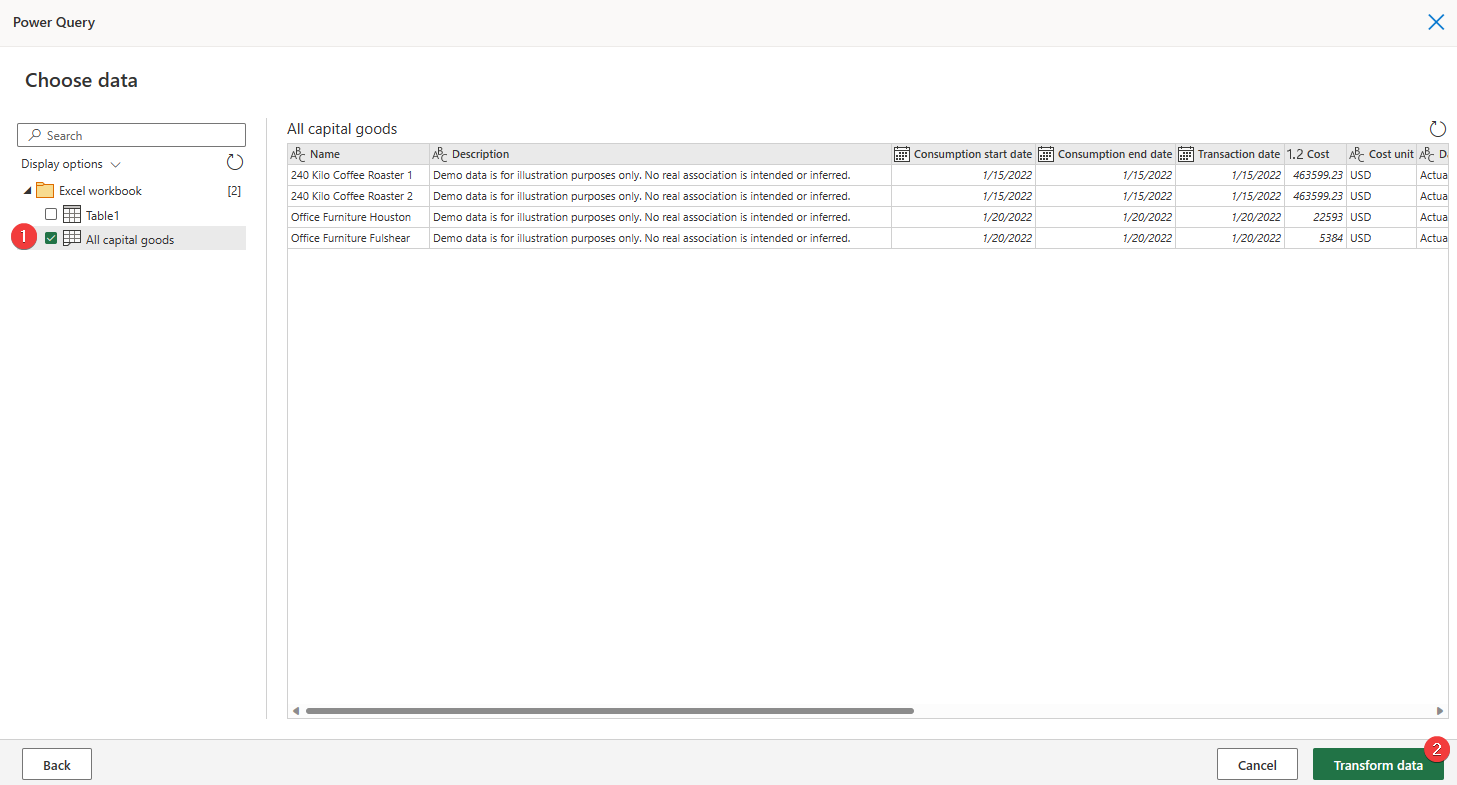
On the Choose data page of the Power Query wizard, select the All capital goods sheet and then select Transform data.


On the Transform data page of the Power Query wizard, you can perform transformations on various data and columns. These transformations will allow you to adjust data types, update column mappings, and perform advanced transformations within Microsoft Power Platform dataflows or Microsoft Power BI datasets. In this scenario, you have already formatted the spreadsheet to match the Microsoft Cloud for Sustainability data model.
Select Create to start the data import process.
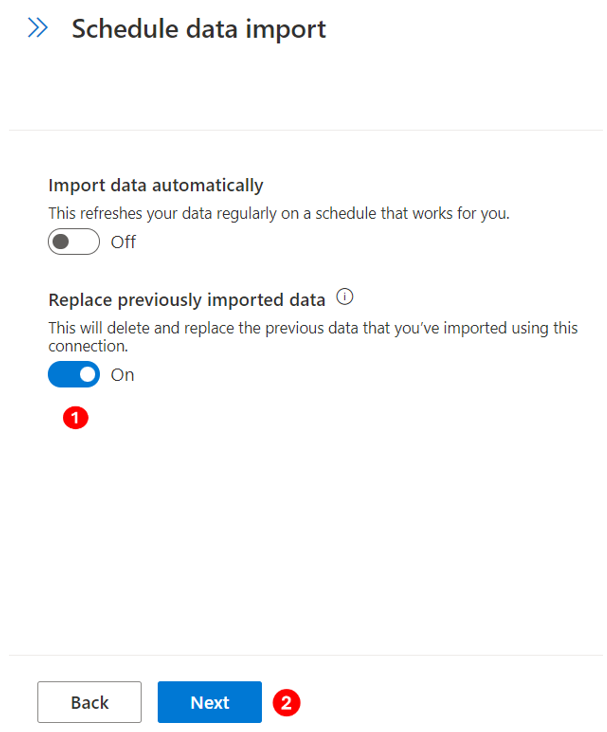
The New data connection wizard will show the Schedule data import page, where you can complete the following actions:
Turn on the Import data automatically toggle, which will give you the option of setting a schedule to have the data imported automatically. This option would be beneficial if the connector is used in a scenario where the data changes frequently, such as a web API or FTP server.
Turn on the Replace previously imported data toggle, which will remove all previously imported data and will bring in the full dataset that was retrieved. This option would be beneficial if the data source provides data from the last import and always includes a full set of data.
Turn on Replace previously imported data and then select Next.
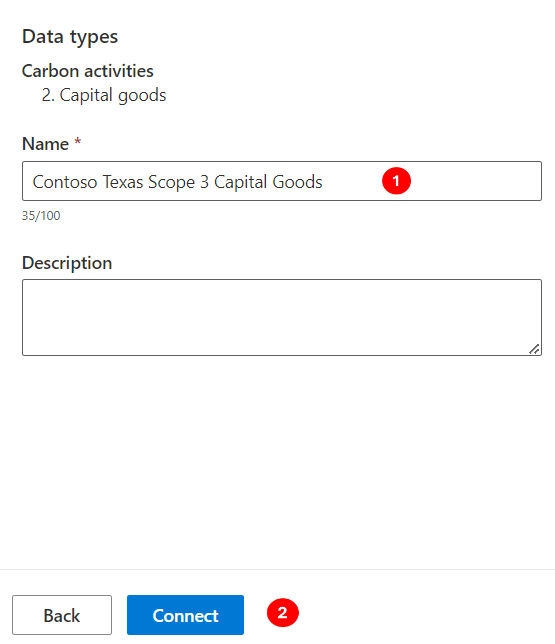
On the Review and name page, enter a name for the new connection, such as Contoso Texas Scope 3 Capital Goods and then select Connect.
Map your source data to the data model. Data doesn't appear until this step is complete. Select Map fields.
Select Data source > 2. Capital goods. Select Auto map.
Verify that the Destination and Source fields are mapped correctly. After reviewing your field mappings, select Save. Switch the Ready to import toggle to yes. Select the back arrow, and then select Done.
Select Refresh to view the updated status, which should show as Complete.
Go to Carbon activities on the left side of the page.
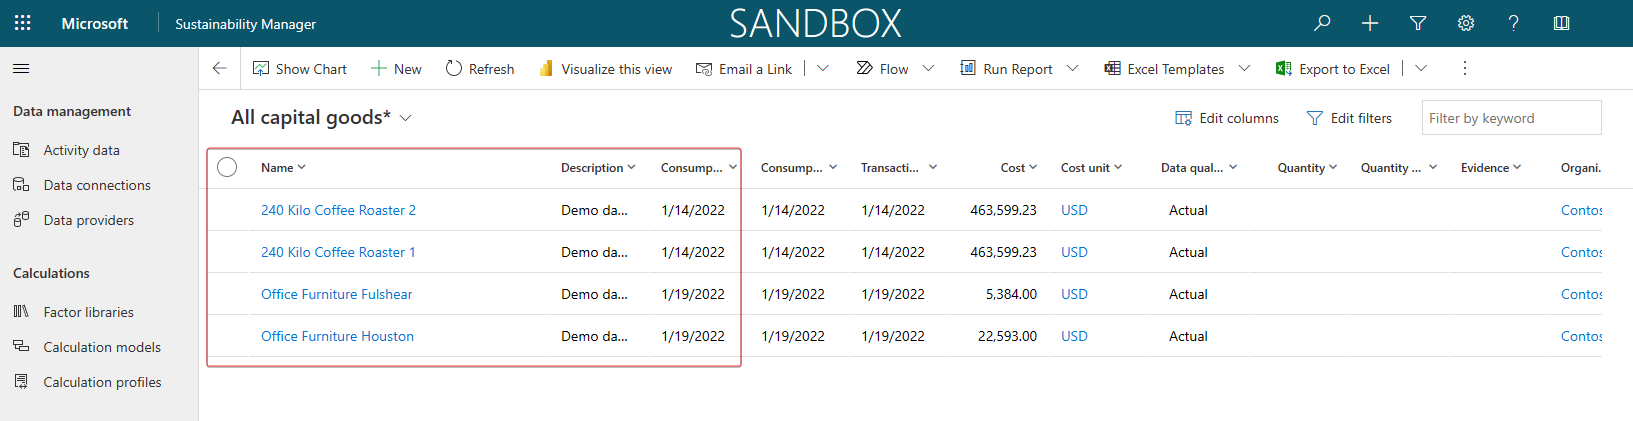
Select the 2. Capital goods option from the Scope 3: Value chain | upstream section to view the data for all capital goods that have been purchased and imported.
Select the arrow next to the Organizational Unit column and select Filter by.
Select Contoso Texas from the Filter By dialog.

Select Apply to apply the filter to the column.
The view will refresh, and the activity data records that were imported during this exercise will display.


Acting as the persona of Devon, the sustainability specialist of Contoso, Texas, you've completed the data import of Scope 3 Category 2 capital goods. It's a crucial step to realize the goal of recording, reporting, and reducing carbon emissions. Next, you'll review the calculation model for this data.
Task: Review calculation models
In this task, Devon will review the calculation models that are included in Sustainability Manager to calculate carbon emissions for the capital goods that have been purchased. In this case, Devon will review the purchased equipment from Fabrikam Inc.
Remy Morris
Hi Devon, the ingested data looks great. We didn't receive the emissions data from our suppliers, so we need to perform an Average spend-based calculation.
Thank you for the information, Remy. It's best practice to review our existing calculation models to see if an existing one matches our needs. I'll review them now.
Devon Torres
Go to Calculations > Models on the left navigation pane.
Review the list of calculation models and determine if an existing model nearly matches Contoso's calculation needs. Because the equipment is being purchased and used in the United States, you can identify an existing capital goods calculation model that uses the latest EPA 2022 - Supply chain GHG emission factors - v1.1 factor library for EEIO factors based on spend type.
Select the Capital Goods calculation model under Scope 3: Value chain | upstream.
Note
You might need to scroll through the list to find your selection.
Review the calculation model actions. Select the Spend-based calculation report action to review the data that's been used for the carbon emission calculation.


The emission report value and unit that's used in the calculation should appear, including the emission factor library and emission factor.
You can use the Report action to calculate and report carbon emissions to the Emissions table. The system will calculate emissions by using the selected emission factor from the dropdown menu or a factor mapping that determines the appropriate emission factor. In this exercise, the action will use the spend type field to identify the factor mapping and emission factor to use in the calculation.
Next, the system will convert the activity data quantity and quantity unit to the same unit type as the emission factor. Then, it will multiply the converted value against each gas that's listed in the emission factor to determine the volume of gases that are produced.
To determine the CO2e (carbon dioxide equivalency), the volume of gases produced is multiplied against their Global Warming Potential (GWP) factor, which is stored in the Greenhouse Gases table in Microsoft Dataverse, and then they're added together.
The Report action stores the values of gases produced, CO2e, and other identifying information about the activity data row in the Emissions table.
Acting as Devon, you've successfully reviewed the included calculation models and have used the Capital Goods calculation model. Sustainability Manager comes equipped with multiple calculation models. Occasionally, these included models might not match your unique needs, so you'll need to create new models to provide custom calculations. Be sure to review the included models to view other types of complex calculation models.
Task: Create a calculation profile
In this task, Riley Ramirez will create a calculation profile by using an existing calculation model called Capital Goods.
Devon Torres
Hi Riley, could you please create a calculation profile for category 2 Capital goods with the Capital Goods calculation model and filter the activity data to only Contoso Texas data? Thank you!
Sure thing, Devon, I'll let you know when the profile is ready!

Riley Ramirez
Go to Calculations > Calculation profiles on the left navigation pane.
Select + New to create a new calculation profile.
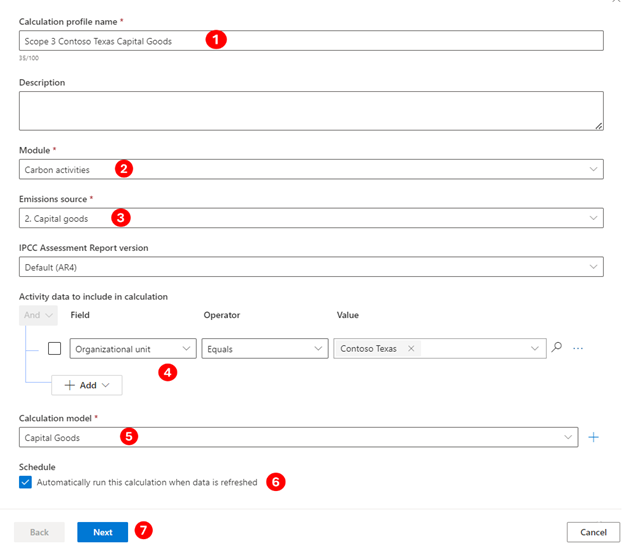
Populate the following information on the New calculation profile wizard:
Calculation profile name - Use to identify the calculation profile in the list. Enter Scope 3 Contoso Texas Capital Goods.
Module - Use to identify the module in the list. Enter Carbon activities.
Emission source - Use to identify which activity data type should be used in the calculation. Enter 2. Capital goods.
Activity data to include in calculation - Use to filter activity data to a specific subset of the activity data type. Enter Organizational unit equals Contoso Texas.
Calculation model - Use to identify the calculation model to be used. Select Capital goods from the dropdown list.
Schedule - Select the Automatically run this calculation when data is refreshed checkbox to automatically trigger calculations when the matching activity data is refreshed.
To create the filter, complete the following steps:
Select Add > Add row.
From the Select a field dropdown menu, select Organizational unit.
From the Value dropdown menu, select Contoso Texas (Organizational unit).

Select Next.
Note
Select the calculation model from the dropdown list.
On the preview page of the New calculation profile wizard, the emissions are calculated for the first row of data that matches the Activity data to include filter. For more information, see Exercise - Run calculations.
Select Save to save your calculation profile. Select Done.


Acting as Riley's persona, you've successfully created a calculation profile. Calculation profiles are the mechanisms by which calculation jobs are queued. You can set your calculation profiles to run automatically when matching activity data is added or updated, as you selected in this scenario, or you can run them manually.
Task: Perform a calculation and review the results
In this task, Devon will run the newly created calculation profile for the purchase of capital goods. This task will create a calculation job that iterates over each activity data row that matches the Calculation Profile filter criteria. It also uses the calculation model that you previously identified to calculate the carbon emissions for each row. The results will be shown in the Emissions table, which Devon can review after the calculations are complete.
Riley Ramirez
Hi Devon, I've created a new calculation profile named Scope 3 Contoso Texas Capital Goods for you.
Thank you, Riley! I'll run that profile to create a calculation job that iterates over each activity data row and calculates the carbon emissions for each row.
Devon Torres
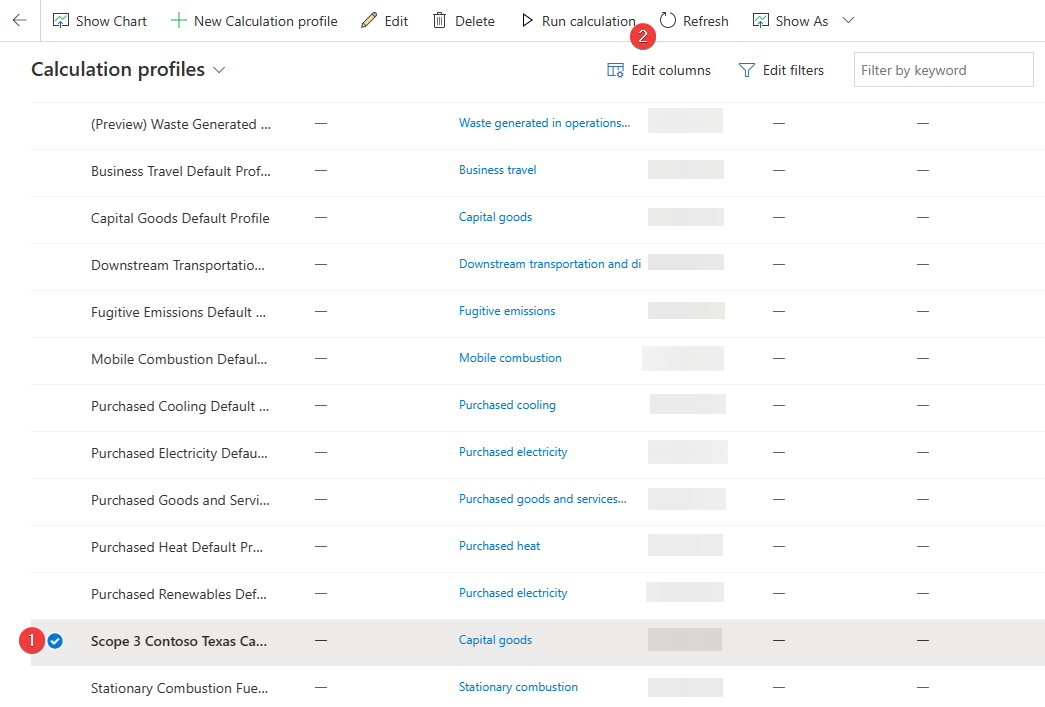
Follow these steps to run the calculation profile for Scope 3 Contoso Texas Capital Goods:
Select Scope 3 Contoso Texas Capital Goods in the list.
Select Run calculation on the command bar.
After a few minutes (approximately three), the calculation job should be complete. Select Refresh to check the status of the calculation job. The calculation profile should now have a status of Succeeded.
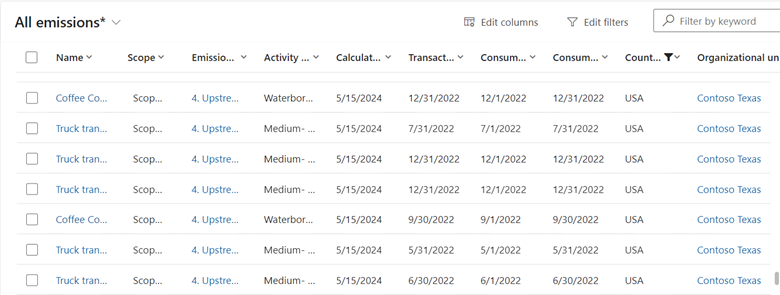
Select Data > All emissions on the left navigation pane. The view shows all emissions that have been calculated or directly imported.
Select the arrow next to the Organizational Unit column and then select Filter by.
Select Contoso Texas from the Filter By dialog.
Select Apply to apply the filter to the column.
The view will refresh, and the calculated emissions data for each activity data record that was imported in the previous tasks will display. Scroll right to view the CO2e carbon emission values.


Now, you've created and run calculation profiles. This step is the last in calculating and recording your carbon emissions in Sustainability Manager.
The following actions were completed in this exercise:
Devon, the sustainability specialist, performed the data ingestion of the capital goods data that Remy, the emissions analyst, prepared.
Devon reviewed the default calculation models and used the Capital Goods calculation model.
Riley, the IT admin, built the calculation profile for the Contoso, Texas organizational unit by using the Capital Goods calculation model.
Devon ran the calculation profile and validated the emissions data.