הערה
הגישה לדף זה מחייבת הרשאה. באפשרותך לנסות להיכנס או לשנות מדריכי כתובות.
הגישה לדף זה מחייבת הרשאה. באפשרותך לנסות לשנות מדריכי כתובות.
Question
Friday, October 5, 2018 7:08 PM
Hello everyone,
Some weeks ago I asked about how to add data to a Listview and everything went fine. This time, I'm trying to add data to a Datagridview in the same way, but I noticed that Datagridviews and Listviews works differently. This is the way I fill up my Listview with data:
   '  Cálculo para Lista de Carga 1
        With ListvCarga1
            .View = View.Details
            .Columns.Add("Punto", 40, HorizontalAlignment.Center)
            .Columns.Add("X (m)", 50, HorizontalAlignment.Center)
            .Columns.Add("Y (cm)", 70, HorizontalAlignment.Center)
            .Columns.Add("V (Kgf)", 70, HorizontalAlignment.Center)
            .Columns.Add("M (Kgf*m)", 70, HorizontalAlignment.Center)
        End With
        '


        ''''''''''''''''''''''''''''''''''''''''''''CALCULO CON 1 CARGA


        Dim i As Integer
        Dim XC1 As Decimal
        '
        If combobCantidadCargas.Text = 1 Then 'Existe solo 1 carga

            i = 0
            XC1 = 0
            ' de extremo izquierdo a posicion de carga 1
            While XC1 <= dblPosicionCarga1
                Dim lviextc1 As New ListViewItem((XC1 / 0.05 + 1).ToString("0"))
                lviextc1.SubItems.Add((XC1).ToString("0.00"))
                lviextc1.SubItems.Add(((dblCarga1 * 10 * dblCaracteristicaSistema) / (dblBalasto * dblAncho) * 1 / ((Math.Sinh(dblCaracteristicaSistema * dblLongitud * 100)) ^ 2 - (Math.Sin(dblCaracteristicaSistema * dblLongitud * 100)) ^ 2) * (2 * Math.Cosh(dblCaracteristicaSistema * XC1 * 100) * Math.Cos(dblCaracteristicaSistema * XC1 * 100) * decAaC1 + (Math.Cosh(dblCaracteristicaSistema * XC1 * 100) * Math.Sin(dblCaracteristicaSistema * XC1 * 100) + Math.Sinh(dblCaracteristicaSistema * XC1 * 100) * Math.Cos(dblCaracteristicaSistema * XC1 * 100)) * decBbC1)).ToString("0.000000"))
                lviextc1.SubItems.Add((dblCarga1 * 1000 * 1 / ((Math.Sinh(dblCaracteristicaSistema * dblLongitud * 100)) ^ 2 - (Math.Sin(dblCaracteristicaSistema * dblLongitud * 100)) ^ 2) * ((Math.Cosh(dblCaracteristicaSistema * XC1 * 100) * Math.Sin(dblCaracteristicaSistema * XC1 * 100) + Math.Sinh(dblCaracteristicaSistema * XC1 * 100) * Math.Cos(dblCaracteristicaSistema * XC1 * 100)) * decAaC1 + (Math.Sinh(dblCaracteristicaSistema * XC1 * 100) * Math.Sin(dblCaracteristicaSistema * XC1 * 100)) * decBbC1)).ToString("0.00"))
                lviextc1.SubItems.Add(((dblCarga1 * 10 / dblCaracteristicaSistema) * 1 / (2 * ((Math.Sinh(dblCaracteristicaSistema * dblLongitud * 100)) ^ 2 - (Math.Sin(dblCaracteristicaSistema * dblLongitud * 100)) ^ 2)) * (2 * Math.Sinh(dblCaracteristicaSistema * XC1 * 100) * Math.Sin(dblCaracteristicaSistema * XC1 * 100) * decAaC1 + (Math.Cosh(dblCaracteristicaSistema * XC1 * 100) * Math.Sin(dblCaracteristicaSistema * XC1 * 100) - Math.Sinh(dblCaracteristicaSistema * XC1 * 100) * Math.Cos(dblCaracteristicaSistema * XC1 * 100)) * decBbC1)).ToString("0.00"))

                ListvCarga1.Items.Add(lviextc1)

                i += 1
                XC1 = i * 0.05

            End While

            'de posicion de carga 1 a extremo derecho
            i = 0
            XC1 = dblPosicionCarga1

            While XC1 <= dblLongitud
                Dim lvic1ext As New ListViewItem((XC1 / 0.05 + 2).ToString("0"))
                lvic1ext.SubItems.Add((XC1).ToString("0.00"))
                lvic1ext.SubItems.Add(((dblCarga1 * 10 * dblCaracteristicaSistema) / (dblBalasto * dblAncho) * 1 / ((Math.Sinh(dblCaracteristicaSistema * dblLongitud * 100)) ^ 2 - (Math.Sin(dblCaracteristicaSistema * dblLongitud * 100)) ^ 2) * (2 * Math.Cosh(dblCaracteristicaSistema * (dblLongitud - XC1) * 100) * Math.Cos(dblCaracteristicaSistema * (dblLongitud - XC1) * 100) * decCcC1 + (Math.Cosh(dblCaracteristicaSistema * (dblLongitud - XC1) * 100) * Math.Sin(dblCaracteristicaSistema * (dblLongitud - XC1) * 100) + Math.Sinh(dblCaracteristicaSistema * (dblLongitud - XC1) * 100) * Math.Cos(dblCaracteristicaSistema * (dblLongitud - XC1) * 100)) * decDdC1)).ToString("0.000000"))
                lvic1ext.SubItems.Add((-dblCarga1 * 1000 * 1 / ((Math.Sinh(dblCaracteristicaSistema * dblLongitud * 100)) ^ 2 - (Math.Sin(dblCaracteristicaSistema * dblLongitud * 100)) ^ 2) * ((Math.Cosh(dblCaracteristicaSistema * (dblLongitud - XC1) * 100) * Math.Sin(dblCaracteristicaSistema * (dblLongitud - XC1) * 100) + Math.Sinh(dblCaracteristicaSistema * (dblLongitud - XC1) * 100) * Math.Cos(dblCaracteristicaSistema * (dblLongitud - XC1) * 100)) * decCcC1 + (Math.Sinh(dblCaracteristicaSistema * (dblLongitud - XC1) * 100) * Math.Sin(dblCaracteristicaSistema * (dblLongitud - XC1) * 100)) * decDdC1)).ToString("0.00"))
                lvic1ext.SubItems.Add(((dblCarga1 * 10 / dblCaracteristicaSistema) * 1 / (2 * ((Math.Sinh(dblCaracteristicaSistema * dblLongitud * 100)) ^ 2 - (Math.Sin(dblCaracteristicaSistema * dblLongitud * 100)) ^ 2)) * (2 * Math.Sinh(dblCaracteristicaSistema * (dblLongitud - XC1) * 100) * Math.Sin(dblCaracteristicaSistema * (dblLongitud - XC1) * 100) * decCcC1 + (Math.Cosh(dblCaracteristicaSistema * (dblLongitud - XC1) * 100) * Math.Sin(dblCaracteristicaSistema * (dblLongitud - XC1) * 100) - Math.Sinh(dblCaracteristicaSistema * (dblLongitud - XC1) * 100) * Math.Cos(dblCaracteristicaSistema * (dblLongitud - XC1) * 100)) * decDdC1)).ToString("0.00"))

                ListvCarga1.Items.Add(lvic1ext)

                i += 1
                XC1 = dblPosicionCarga1 + i * 0.05

            End While

        End If
What I'm doing there, and what I want to do with DataGridViews is:
- Define Columns width and headers. This is crucial to keep a constant appereance on all DataGridViews.
- Create a loop from 0 to Load Position (dblPosicionCarga1) on which I calculate deflection, shear and bending moment every X interval.
- When i reach dblPosicionCarga1 with first loop. Second loop starts inmediately from dblPosicionCarga1 to dblLongitud (wich is the lenght of the beam evaluated). Important: dblPosicionCarga1 is repeated on the list (intentionally).
It is important to point out that both loops go on the same DataGridView, without erasing each other.
Is there a way to do this? Thanks in advance for your help and guidance, guys.
All replies (17)
Saturday, October 6, 2018 10:48 AM ✅Answered | 1 vote
Alex,
Me thinks you may be making it more difficult than it is? It is easy to make the dgv (however I still use a datatable). Making the chart is a bit trickier due to two points with the same x value.
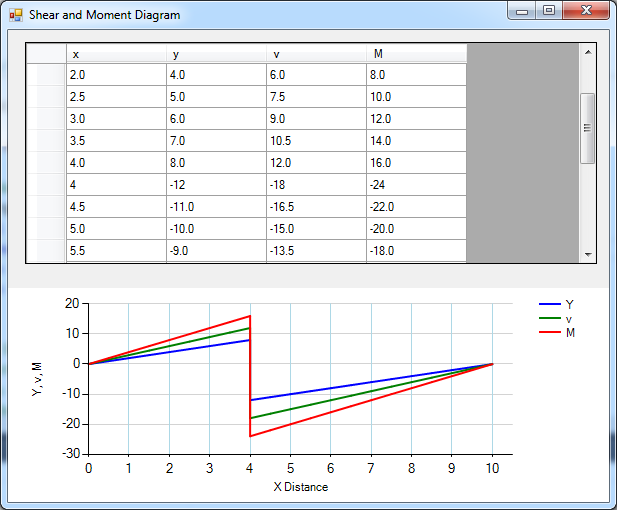
This is basically the same as the last question example that I posted but now it is like your example. Note now there are two rows in the dgv at x = 4 (position b of the point load). You should be able to get it to work with your equations once you add the constants and correct the increments (which I show commented out).
To make the example add a datagridview and a chart to an empty form as shown. Then copy and paste the code into the form.
Imports System.Windows.Forms.DataVisualization.Charting

Public Class Form1

    Private dt As New DataTable

    Private Sub Form1_Load(sender As Object, e As EventArgs) Handles MyBase.Load

        Text = "Shear and Moment Diagram"

        'set up the beam data
        Dim dblPosicionCarga1 As Decimal = 4    'single point load location
        Dim XC1 As Decimal                      'current x location
        Dim xstep As Decimal = CDec(0.05)       'step length
        Dim theInterval As Decimal = 1          'plot interval
        Dim dblLongitud As Decimal = 10         'total beam length

        'not used
        'Dim dblCarga1 As Double = 5
        'Dim dblCaracteristicaSistema As Double = 10
        'Dim dblBalasto As Double = 1
        'Dim dblAncho As Double = 1
        'Dim decBbC1 As Double = 1
        'Dim decAaC1 As Double = 1
        'dr(1) = ((dblCarga1 * 10 * dblCaracteristicaSistema) / (dblBalasto * dblAncho) * 1 / ((Math.Sinh(dblCaracteristicaSistema * dblLongitud * 100)) ^ 2 - (Math.Sin(dblCaracteristicaSistema * dblLongitud * 100)) ^ 2) * (2 * Math.Cosh(dblCaracteristicaSistema * XC1 * 100) * Math.Cos(dblCaracteristicaSistema * XC1 * 100) * decAaC1 + (Math.Cosh(dblCaracteristicaSistema * XC1 * 100) * Math.Sin(dblCaracteristicaSistema * XC1 * 100) + Math.Sinh(dblCaracteristicaSistema * XC1 * 100) * Math.Cos(dblCaracteristicaSistema * XC1 * 100)) * decBbC1))
        'dr(2) = (dblCarga1 * 1000 * 1 / ((Math.Sinh(dblCaracteristicaSistema * dblLongitud * 100)) ^ 2 - (Math.Sin(dblCaracteristicaSistema * dblLongitud * 100)) ^ 2) * ((Math.Cosh(dblCaracteristicaSistema * XC1 * 100) * Math.Sin(dblCaracteristicaSistema * XC1 * 100) + Math.Sinh(dblCaracteristicaSistema * XC1 * 100) * Math.Cos(dblCaracteristicaSistema * XC1 * 100)) * decAaC1 + (Math.Sinh(dblCaracteristicaSistema * XC1 * 100) * Math.Sin(dblCaracteristicaSistema * XC1 * 100)) * decBbC1))
        'dr(3) = ((dblCarga1 * 10 / dblCaracteristicaSistema) * 1 / (2 * ((Math.Sinh(dblCaracteristicaSistema * dblLongitud * 100)) ^ 2 - (Math.Sin(dblCaracteristicaSistema * dblLongitud * 100)) ^ 2)) * (2 * Math.Sinh(dblCaracteristicaSistema * XC1 * 100) * Math.Sin(dblCaracteristicaSistema * XC1 * 100) * decAaC1 + (Math.Cosh(dblCaracteristicaSistema * XC1 * 100) * Math.Sin(dblCaracteristicaSistema * XC1 * 100) - Math.Sinh(dblCaracteristicaSistema * XC1 * 100) * Math.Cos(dblCaracteristicaSistema * XC1 * 100)) * decBbC1))

        'make a data table with the values
        dt.Columns.Add("x")
        dt.Columns.Add("y")
        dt.Columns.Add("v")
        dt.Columns.Add("M")

        Dim dr As DataRow

        For XC1 = 0 To dblPosicionCarga1 Step xstep
            dr = dt.NewRow
            dr(0) = XC1
            dr(1) = XC1 * 2        'thess are just dummy equations
            dr(2) = XC1 * 3
            dr(3) = XC1 * 4
            dt.Rows.Add(dr)
        Next

        For XC1 = dblPosicionCarga1 To dblLongitud Step xstep
            dr = dt.NewRow
            dr(0) = XC1
            dr(1) = -(dblLongitud - XC1) * 2
            dr(2) = -(dblLongitud - XC1) * 3
            dr(3) = -(dblLongitud - XC1) * 4
            dt.Rows.Add(dr)
        Next

        'use the datatable as the dgv source
        DataGridView1.DataSource = dt

        'setup the chart
        With Chart1.ChartAreas(0)
            .AxisX.Title = "X Distance"
            .AxisX.MajorGrid.LineColor = Color.LightBlue
            .AxisX.Minimum = 0
            .AxisX.Interval = theInterval
            .AxisY.Title = "Y, v, M"
            .AxisY.MajorGrid.LineColor = Color.LightGray
        End With

        'setup the chart series
        Chart1.Series.Clear()
        AddSerries("Y", Color.Blue)
        AddSerries("v", Color.Green)
        AddSerries("M", Color.Red)

        'draw the chart using datatable
        Dim ax As Decimal

        For r As Integer = 0 To dt.Rows.Count - 1
            ax = CDec(dt.Rows(r)(0))   'this works better to precalc else chart errs
            Chart1.Series("Y").Points.AddXY(ax, dt.Rows(r)(1))
            Chart1.Series("v").Points.AddXY(ax, dt.Rows(r)(2))
            Chart1.Series("M").Points.AddXY(ax, dt.Rows(r)(3))
        Next
    End Sub

    Private Sub AddSerries(thisName As String, clr As Color)
        Chart1.Series.Add(thisName)
        With Chart1.Series(thisName)
            .ChartType = DataVisualization.Charting.SeriesChartType.Line
            .BorderWidth = 2
            .Color = clr
        End With
    End Sub
End Class
Friday, October 5, 2018 7:57 PM
Hi
Sorry , I do not understand your question.
Here is some code that seems to illustrate what I believe is one of your points - build several DGV all with same layout characteristics.
Also adds random data rows to all DGV.
This example allows cycling through all DGV using
NEXT/PREV buttons.
Layout
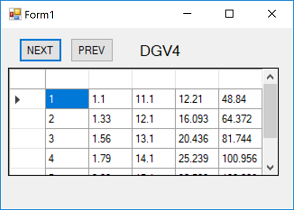
Code
' Form1 with Label1, Button1 and
' Button2 as per image
Option Strict On
Option Explicit On
Public Class Form1
  Dim dgvs As New List(Of DataGridView)
  Dim currDGV As Integer = 3
  Private Sub Form1_Load(sender As Object, e As EventArgs) Handles MyBase.Load
    ' form size
    Size = New Size(340, 240)

    ' define 4 DataGridViews
    For i As Integer = 1 To 4
      Dim dgv As New DataGridView
      With dgv
        .Size = New Size(300, 120)
        .Location = New Point(8, 44)
        .Name = "DGV" & i.ToString
        .ColumnCount = 5
        .AutoSizeColumnsMode = DataGridViewAutoSizeColumnsMode.Fill
        .Visible = False

        Dim a1 As Double = 1.1
        Dim a2 As Double = 11.1
        Dim row As Integer = 0
        Dim rows As Integer = 5
        Do
          Dim c1 As Double = a1 * a2
          Dim c2 As Double = a1 * a2 * i
          .Rows.Add(row + 1, a1, a2, c1, c2)
          row += 1
          a1 += 0.23
          a2 += 1
        Loop Until row = rows
      End With
      dgvs.Add(dgv)
      Controls.Add(dgv)
    Next
    SetDGV()
  End Sub
  Sub SetDGV()
    For j As Integer = 0 To dgvs.Count - 1
      dgvs(j).Visible = False
      If j = currDGV Then
        dgvs(currDGV).Visible = True
        Label1.Text = dgvs(currDGV).Name
      End If
    Next
  End Sub
  Private Sub Button1_Click(sender As Object, e As EventArgs) Handles Button1.Click
    ' NEXT
    currDGV += 1
    If currDGV > dgvs.Count - 1 Then currDGV = 0
    SetDGV()
  End Sub
  Private Sub Button2_Click(sender As Object, e As EventArgs) Handles Button2.Click
    ' PREV
    currDGV -= 1
    If currDGV < 0 Then currDGV = dgvs.Count - 1
    SetDGV()
  End Sub
End Class
Regards Les, Livingston, Scotland
Friday, October 5, 2018 10:50 PM
Hi
Sorry , I do not understand your question.
Hi, Leshay. First of all thanks for taking the time to answer.
The code you shared is actually helpful and clarifies some of my doubts.
However, It seems I wasn't clear enough at explaining what I needed.
Let me give you one example:
Imagine we have a steel bar divided into two segments (Segment #1 called ab, and segment #2 called bc), so that: ab + bc = Total Lenght.
Now, imagine we have two sets of equations that calculate temperture and deformation caused by temperature of steel bodies.
Consider that set of equations #1, for some reason, only works on segment ab, and set of equations #2 only works on segment bc.
What I need to do, is to create ONE DataGridView that contains the calculation of temperature and deformation caused by temperature ordered.
By ordered I mean the following: This is an example of how dgv should look.
Point Position (in) Temperature (°F) Deformation by Temperature (in)
1 a Temp(a) (Set eq#1) Def(a) (Set eq#1)
2 1 Temp(1) (Set eq#1) Def(1) (Set eq#1)
3 2 Temp(2) (Set eq#1) Def(2) (Set eq#1)
4 3 Temp(3) (Set eq#1) Def(3) (Set eq#1)
... ... ... ....
n b Temp(b) (Set eq#1) Def(b) (Set eq#1)
** n+1 b ** Temp(b) (Set eq#2) Temp(b) (Set eq#2)
n+2 b+1 Temp(b+1) (Set eq#2) Def(b+1) (Set eq#2)
n+3 b+2 Temp(b+2) (Set eq#2) Def(b+2) (Set eq#2)
n+4 b+3 Temp(b+3) (Set eq#2) Def(b+3) (Set eq#2)
... ... .... ....
n+m c Temp(c) (Set eq#2) Def(c) (Set eq#2)
Notice that Position "b" (being the border between both lenghts, ab and bc) is evaluated twice, first with the set of equations #1 and then with the set of equations #2. But the Point is not affected.
Also, notice that both loops are on the same dgv, and not only that, they are evaluated and shown in order.
I hope I explained me better now. I really appreciate your help, Leshay.
Saturday, October 6, 2018 11:07 AM
@Tommy, nice chart and +1 for using a DataTable.
Please remember to mark the replies as answers if they help and unmark them if they provide no help, this will help others who are looking for solutions to the same or similar problem. Contact via my Twitter (Karen Payne) or Facebook (Karen Payne) via my MSDN profile but will not answer coding question on either.
VB Forums - moderator
Saturday, October 6, 2018 11:32 AM
@Tommy, nice chart and +1 for using a DataTable.
Please remember to mark the replies as answers if they help and unmark them if they provide no help, this will help others who are looking for solutions to the same or similar problem. Contact via my Twitter (Karen Payne) or Facebook (Karen Payne) via my MSDN profile but will not answer coding question on either.
VB Forums - moderator
Thank you! :)
We are open to any suggestions. Alex was using many listviews (see OPs previous posts) and etc...
I think next Alex will now want multiple dts with the same data. ie the Point b on the beam moves x = 4 , x = 5 ... and maybe some other things.
So can we have a 3 dimensional datatable? Ie now it is 2 dimensions (row, column) I am guessing next will be multiple dts so we need (row, column, table index). Or just a list of datatables?
Assuming this is what Alex wants of course I am still guessing. Lets see what Alex says.
PS Karen - there is a way to just assign the datatable to the chart points series with binding source? now it is just filling with the for loop. I think that can be eliminated like using the dt for source in the dgv. Do you know how to source the chart with dt off top of your head?
Saturday, October 6, 2018 12:12 PM | 1 vote
To be honest, I've never used the Chart control. With that from a blog on charting I just read it seems like a good resource for binding to a Chart control.
In the comments (search for DataTable) it appears, at least from a quick read when setting a DataTable as the DataSource it does not work. But does mention a DataView and in a MSDN page indicates the same is possible.
Then I looked at a StackOverflow post (C# but easily converted to VB.NET) which seems contradictory to the above as the answer indicates a DataTable is possible.
Please remember to mark the replies as answers if they help and unmark them if they provide no help, this will help others who are looking for solutions to the same or similar problem. Contact via my Twitter (Karen Payne) or Facebook (Karen Payne) via my MSDN profile but will not answer coding question on either.
VB Forums - moderator
Saturday, October 6, 2018 12:15 PM
I haven't tried the code yet because I'm modifying a little bit the UI to make my windows form more intuitive, but checking the code and results, that's exactly what I needed.
I was working with Listviews and one of the problems that annoyed me the most when graphing what that the Point load (which would be "b" on the example I showed) wasn't considered the same point. So the chart X axis was something like:
0 1 2 3 4 b b 5 6 ... etc.
It was particularly awful for small beams. Now, with the code you shared it is clear that it won't happen.
PS: Tommy, I bet you noticed I took your suggestion to change all listviews to datagridviews with datatables. It's hard work but it will give better results. Thanks again for all your help.
Saturday, October 6, 2018 12:23 PM
"Alex will now want multiple dts with the same data. ie the Point b on the beam moves x = 4 , x = 5 ... and maybe some other things."
I don't need to multiply dts with the same data, but sum them up, point by point and add the result to a third dgv.
"So can we have a 3 dimensional datatable? Ie now it is 2 dimensions (row, column) I am guessing next will be multiple dts so we need (row, column, table index). Or just a list of datatables?"
Sound pretty interesting, but 2D datatables are enough for me at the moment. :)
In the simplest terms: I need to create 3 datagridviews, just like:
dgv1 > datatable1 (just like the one you shared on the code)
dgv2 > datatable2 (just like the one you shared on the code)
dgv3 = dgv1 + dgv2 does it mean that I just need to copy dgv3 = datatable1 + datatable2? I don't think so. I once tried to sum datatables and It was a total mess.
Should I need to open a new thread for that question? or is it fine on this one?
PS: I new you remembered my Listviews. haha :)
Saturday, October 6, 2018 12:39 PM
I haven't tried the code yet because I'm modifying a little bit the UI to make my windows form more intuitive, but checking the code and results, that's exactly what I needed.
I was working with Listviews and one of the problems that annoyed me the most when graphing what that the Point load (which would be "b" on the example I showed) wasn't considered the same point. So the chart X axis was something like:
0 1 2 3 4 b b 5 6 ... etc.
It was particularly awful for small beams. Now, with the code you shared it is clear that it won't happen.
Yes, I had to fight that. I think but not sure that when I added ax = CDec(dt.Rows(r)(0)) to the chart loop it then would plot by x location for both points at 4.0 (pt b). I don't recall for sure. The conversion to decimal threw it out of the plot by index along x axis to the plot by value as it was sort of binding to the datatable??? So you will have to figure all that.
PS there was also that starting the for loop for the data table at 0 and ending at 4.0 and next loop start 4.0 end 10.0. If those were not all decimal and just right then the chart intervals and x axis point values get out of wack. I am sure it will show up again?
PSS If you zoom in on the chart enough it may still have that plot problem? We just don't see it at this scale??
Ps3 No I changed the step to 1.0 and the chart is good at the point load b.
Saturday, October 6, 2018 12:47 PM
dgv3 = dgv1 + dgv2 does it mean that I just need to copy dgv3 = datatable1 + datatable2? I don't think so. I once tried to sum datatables and It was a total mess.
Should I need to open a new thread for that question? or is it fine on this one?
Oh it is ok to ask here. We open new questions for clarity. And also to get others interested.
You should just add the datatable values as req'd. You can do it like we add the dt to the chart series but now you just dt3(r)(c) = dt1(r)(c) + dt2(r)(c).
However Karen et al may have an easier way?
You can also just add the 3 data sets to one data table and datagridview. There is nothing magic about them. A datatable is an array more or less with lots of other features. YOu just have three sets of rows with a header inserted. Again Karen and Les know that better?
Saturday, October 13, 2018 3:33 PM
You should just add the datatable values as req'd. You can do it like we add the dt to the chart series but now you just dt3(r)(c) = dt1(r)(c) + dt2(r)(c).
Hi, Tommy.
I've been kinda busy and with several Internet connection problems so I hadn't been able to test this out and write reviews about it, but anyways, I'm back and I tested it.
I have this code:
        '''''''''''''''PARA DEFLEXION, CORTE Y MOMENTO DE CARGA 1''''''''''''''''''''''''''''''''''''''''

        '    Coeficientes de Extremo Izquierdo a Posición de Carga 1
        decAaC1 = Math.Sinh(dblCaracteristicaSistema * dblLongitud * 100) * Math.Cos(dblCaracteristicaSistema * dblPosicionCarga1 * 100) * Math.Cosh(dblCaracteristicaSistema * (dblLongitud - dblPosicionCarga1) * 100) - Math.Sin(dblCaracteristicaSistema * dblLongitud * 100) * Math.Cosh(dblCaracteristicaSistema * dblPosicionCarga1 * 100) * Math.Cos(dblCaracteristicaSistema * (dblLongitud - dblPosicionCarga1) * 100)
        decBbC1 = Math.Sinh(dblCaracteristicaSistema * dblLongitud * 100) * (Math.Cosh(dblCaracteristicaSistema * (dblLongitud - dblPosicionCarga1) * 100) * Math.Sin(dblCaracteristicaSistema * dblPosicionCarga1 * 100) - Math.Sinh(dblCaracteristicaSistema * (dblLongitud - dblPosicionCarga1) * 100) * Math.Cos(dblCaracteristicaSistema * dblPosicionCarga1 * 100)) + Math.Sin(dblCaracteristicaSistema * dblLongitud * 100) * (Math.Sinh(dblCaracteristicaSistema * dblPosicionCarga1 * 100) * Math.Cos(dblCaracteristicaSistema * (dblLongitud - dblPosicionCarga1) * 100) - Math.Cosh(dblCaracteristicaSistema * dblPosicionCarga1 * 100) * Math.Sin(dblCaracteristicaSistema * (dblLongitud - dblPosicionCarga1) * 100))
        '    Coeficientes de Extremo Derecho a Posición de Carga 1
        decCcC1 = Math.Sinh(dblCaracteristicaSistema * dblLongitud * 100) * Math.Cos(dblCaracteristicaSistema * (dblLongitud - dblPosicionCarga1) * 100) * Math.Cosh(dblCaracteristicaSistema * dblPosicionCarga1 * 100) - Math.Sin(dblCaracteristicaSistema * dblLongitud * 100) * Math.Cosh(dblCaracteristicaSistema * (dblLongitud - dblPosicionCarga1) * 100) * Math.Cos(dblCaracteristicaSistema * dblPosicionCarga1 * 100)
        decDdC1 = Math.Sinh(dblCaracteristicaSistema * dblLongitud * 100) * (Math.Cosh(dblCaracteristicaSistema * dblPosicionCarga1 * 100) * Math.Sin(dblCaracteristicaSistema * (dblLongitud - dblPosicionCarga1) * 100) - Math.Sinh(dblCaracteristicaSistema * dblPosicionCarga1 * 100) * Math.Cos(dblCaracteristicaSistema * (dblLongitud - dblPosicionCarga1) * 100)) + Math.Sin(dblCaracteristicaSistema * dblLongitud * 100) * (Math.Sinh(dblCaracteristicaSistema * (dblLongitud - dblPosicionCarga1) * 100) * Math.Cos(dblCaracteristicaSistema * dblPosicionCarga1 * 100) - Math.Cosh(dblCaracteristicaSistema * (dblLongitud - dblPosicionCarga1) * 100) * Math.Sin(dblCaracteristicaSistema * dblPosicionCarga1 * 100))
        '
        '

        ''''''''''''''''''''''''''''''''''''''''''''CALCULO CON 1 CARGA


        Dim i As Integer
        Dim XC1 As Decimal
        '
        If combobCantidadCargas.Text = "1" Then 'Existen solo 1 carga


            'prueba con dgv
            dtc1.Columns.Add("Punto")
            dtc1.Columns.Add("X (m)")
            dtc1.Columns.Add("Y (cm)")
            dtc1.Columns.Add("V (Kgf)")
            dtc1.Columns.Add("M (Kgf*m)")
            dtc1.Columns.Add("P (Kgf*cm2)")

            Dim dr1 As DataRow
            Dim dr3 As DataRow


            i = 0
            XC1 = 0

            While XC1 <= dblPosicionCarga1
                dr1 = dtc1.NewRow
                dr1(0) = XC1 / intervalo + 1
                dr1(1) = (XC1).ToString("0.00")
                dr1(2) = (((dblCarga1 * 10 * dblCaracteristicaSistema) / (dblBalasto * dblAncho) * 1 / ((Math.Sinh(dblCaracteristicaSistema * dblLongitud * 100)) ^ 2 - (Math.Sin(dblCaracteristicaSistema * dblLongitud * 100)) ^ 2) * (2 * Math.Cosh(dblCaracteristicaSistema * XC1 * 100) * Math.Cos(dblCaracteristicaSistema * XC1 * 100) * decAaC1 + (Math.Cosh(dblCaracteristicaSistema * XC1 * 100) * Math.Sin(dblCaracteristicaSistema * XC1 * 100) + Math.Sinh(dblCaracteristicaSistema * XC1 * 100) * Math.Cos(dblCaracteristicaSistema * XC1 * 100)) * decBbC1)).ToString("0.000"))
                dr1(3) = ((dblCarga1 * 1000 * 1 / ((Math.Sinh(dblCaracteristicaSistema * dblLongitud * 100)) ^ 2 - (Math.Sin(dblCaracteristicaSistema * dblLongitud * 100)) ^ 2) * ((Math.Cosh(dblCaracteristicaSistema * XC1 * 100) * Math.Sin(dblCaracteristicaSistema * XC1 * 100) + Math.Sinh(dblCaracteristicaSistema * XC1 * 100) * Math.Cos(dblCaracteristicaSistema * XC1 * 100)) * decAaC1 + (Math.Sinh(dblCaracteristicaSistema * XC1 * 100) * Math.Sin(dblCaracteristicaSistema * XC1 * 100)) * decBbC1)).ToString("0.00"))
                dr1(4) = (((dblCarga1 * 10 / dblCaracteristicaSistema) * 1 / (2 * ((Math.Sinh(dblCaracteristicaSistema * dblLongitud * 100)) ^ 2 - (Math.Sin(dblCaracteristicaSistema * dblLongitud * 100)) ^ 2)) * (2 * Math.Sinh(dblCaracteristicaSistema * XC1 * 100) * Math.Sin(dblCaracteristicaSistema * XC1 * 100) * decAaC1 + (Math.Cosh(dblCaracteristicaSistema * XC1 * 100) * Math.Sin(dblCaracteristicaSistema * XC1 * 100) - Math.Sinh(dblCaracteristicaSistema * XC1 * 100) * Math.Cos(dblCaracteristicaSistema * XC1 * 100)) * decBbC1)).ToString("0.00"))
                dr1(5) = (((dblCarga1 * 10 * dblCaracteristicaSistema) / (dblBalasto * dblAncho) * 1 / ((Math.Sinh(dblCaracteristicaSistema * dblLongitud * 100)) ^ 2 - (Math.Sin(dblCaracteristicaSistema * dblLongitud * 100)) ^ 2) * (2 * Math.Cosh(dblCaracteristicaSistema * XC1 * 100) * Math.Cos(dblCaracteristicaSistema * XC1 * 100) * decAaC1 + (Math.Cosh(dblCaracteristicaSistema * XC1 * 100) * Math.Sin(dblCaracteristicaSistema * XC1 * 100) + Math.Sinh(dblCaracteristicaSistema * XC1 * 100) * Math.Cos(dblCaracteristicaSistema * XC1 * 100)) * decBbC1)) * dblBalasto).ToString("0.000")
                dtc1.Rows.Add(dr1)

                i += 1
                XC1 = i * intervalo

            End While

            i = 0
            XC1 = dblPosicionCarga1

            While XC1 <= dblLongitud
                dr1 = dtc1.NewRow
                dr1(0) = XC1 / intervalo + 2
                dr1(1) = (XC1).ToString("0.00")
                dr1(2) = ((dblCarga1 * 10 * dblCaracteristicaSistema) / (dblBalasto * dblAncho) * 1 / ((Math.Sinh(dblCaracteristicaSistema * dblLongitud * 100)) ^ 2 - (Math.Sin(dblCaracteristicaSistema * dblLongitud * 100)) ^ 2) * (2 * Math.Cosh(dblCaracteristicaSistema * (dblLongitud - XC1) * 100) * Math.Cos(dblCaracteristicaSistema * (dblLongitud - XC1) * 100) * decCcC1 + (Math.Cosh(dblCaracteristicaSistema * (dblLongitud - XC1) * 100) * Math.Sin(dblCaracteristicaSistema * (dblLongitud - XC1) * 100) + Math.Sinh(dblCaracteristicaSistema * (dblLongitud - XC1) * 100) * Math.Cos(dblCaracteristicaSistema * (dblLongitud - XC1) * 100)) * decDdC1)).ToString("0.000")
                dr1(3) = (-dblCarga1 * 1000 * 1 / ((Math.Sinh(dblCaracteristicaSistema * dblLongitud * 100)) ^ 2 - (Math.Sin(dblCaracteristicaSistema * dblLongitud * 100)) ^ 2) * ((Math.Cosh(dblCaracteristicaSistema * (dblLongitud - XC1) * 100) * Math.Sin(dblCaracteristicaSistema * (dblLongitud - XC1) * 100) + Math.Sinh(dblCaracteristicaSistema * (dblLongitud - XC1) * 100) * Math.Cos(dblCaracteristicaSistema * (dblLongitud - XC1) * 100)) * decCcC1 + (Math.Sinh(dblCaracteristicaSistema * (dblLongitud - XC1) * 100) * Math.Sin(dblCaracteristicaSistema * (dblLongitud - XC1) * 100)) * decDdC1)).ToString("0.00")
                dr1(4) = ((dblCarga1 * 10 / dblCaracteristicaSistema) * 1 / (2 * ((Math.Sinh(dblCaracteristicaSistema * dblLongitud * 100)) ^ 2 - (Math.Sin(dblCaracteristicaSistema * dblLongitud * 100)) ^ 2)) * (2 * Math.Sinh(dblCaracteristicaSistema * (dblLongitud - XC1) * 100) * Math.Sin(dblCaracteristicaSistema * (dblLongitud - XC1) * 100) * decCcC1 + (Math.Cosh(dblCaracteristicaSistema * (dblLongitud - XC1) * 100) * Math.Sin(dblCaracteristicaSistema * (dblLongitud - XC1) * 100) - Math.Sinh(dblCaracteristicaSistema * (dblLongitud - XC1) * 100) * Math.Cos(dblCaracteristicaSistema * (dblLongitud - XC1) * 100)) * decDdC1)).ToString("0.00")
                dr1(5) = (dblBalasto * (dblCarga1 * 10 * dblCaracteristicaSistema) / (dblBalasto * dblAncho) * 1 / ((Math.Sinh(dblCaracteristicaSistema * dblLongitud * 100)) ^ 2 - (Math.Sin(dblCaracteristicaSistema * dblLongitud * 100)) ^ 2) * (2 * Math.Cosh(dblCaracteristicaSistema * (dblLongitud - XC1) * 100) * Math.Cos(dblCaracteristicaSistema * (dblLongitud - XC1) * 100) * decCcC1 + (Math.Cosh(dblCaracteristicaSistema * (dblLongitud - XC1) * 100) * Math.Sin(dblCaracteristicaSistema * (dblLongitud - XC1) * 100) + Math.Sinh(dblCaracteristicaSistema * (dblLongitud - XC1) * 100) * Math.Cos(dblCaracteristicaSistema * (dblLongitud - XC1) * 100)) * decDdC1)).ToString("0.000")
                dtc1.Rows.Add(dr1)

                i += 1
                XC1 = dblPosicionCarga1 + i * intervalo
            End While
End Sub
After the second Loop, I just tried to do dr3 = dr1 + dr1, but It shows an error.
I also tried dt3 = dt1 + dt1 and It's the same story.
I notice you used (r)(c) but those are previously declared variables? If so, how would you declare them? would (r) be datarow? so, in my case, it would be dr1?
Thanks in advance, Tommy.
Saturday, October 13, 2018 4:29 PM
You should just add the datatable values as req'd. You can do it like we add the dt to the chart series but now you just dt3(r)(c) = dt1(r)(c) + dt2(r)(c).
Hi, Tommy.
I've been kinda busy and with several Internet connection problems so I hadn't been able to test this out and write reviews about it, but anyways, I'm back and I tested it.
I have this code:
        '''''''''''''''PARA DEFLEXION, CORTE Y MOMENTO DE CARGA 1''''''''''''''''''''''''''''''''''''''''

        '    Coeficientes de Extremo Izquierdo a Posición de Carga 1
        decAaC1 = Math.Sinh(dblCaracteristicaSistema * dblLongitud * 100) * Math.Cos(dblCaracteristicaSistema * dblPosicionCarga1 * 100) * Math.Cosh(dblCaracteristicaSistema * (dblLongitud - dblPosicionCarga1) * 100) - Math.Sin(dblCaracteristicaSistema * dblLongitud * 100) * Math.Cosh(dblCaracteristicaSistema * dblPosicionCarga1 * 100) * Math.Cos(dblCaracteristicaSistema * (dblLongitud - dblPosicionCarga1) * 100)
        decBbC1 = Math.Sinh(dblCaracteristicaSistema * dblLongitud * 100) * (Math.Cosh(dblCaracteristicaSistema * (dblLongitud - dblPosicionCarga1) * 100) * Math.Sin(dblCaracteristicaSistema * dblPosicionCarga1 * 100) - Math.Sinh(dblCaracteristicaSistema * (dblLongitud - dblPosicionCarga1) * 100) * Math.Cos(dblCaracteristicaSistema * dblPosicionCarga1 * 100)) + Math.Sin(dblCaracteristicaSistema * dblLongitud * 100) * (Math.Sinh(dblCaracteristicaSistema * dblPosicionCarga1 * 100) * Math.Cos(dblCaracteristicaSistema * (dblLongitud - dblPosicionCarga1) * 100) - Math.Cosh(dblCaracteristicaSistema * dblPosicionCarga1 * 100) * Math.Sin(dblCaracteristicaSistema * (dblLongitud - dblPosicionCarga1) * 100))
        '    Coeficientes de Extremo Derecho a Posición de Carga 1
        decCcC1 = Math.Sinh(dblCaracteristicaSistema * dblLongitud * 100) * Math.Cos(dblCaracteristicaSistema * (dblLongitud - dblPosicionCarga1) * 100) * Math.Cosh(dblCaracteristicaSistema * dblPosicionCarga1 * 100) - Math.Sin(dblCaracteristicaSistema * dblLongitud * 100) * Math.Cosh(dblCaracteristicaSistema * (dblLongitud - dblPosicionCarga1) * 100) * Math.Cos(dblCaracteristicaSistema * dblPosicionCarga1 * 100)
        decDdC1 = Math.Sinh(dblCaracteristicaSistema * dblLongitud * 100) * (Math.Cosh(dblCaracteristicaSistema * dblPosicionCarga1 * 100) * Math.Sin(dblCaracteristicaSistema * (dblLongitud - dblPosicionCarga1) * 100) - Math.Sinh(dblCaracteristicaSistema * dblPosicionCarga1 * 100) * Math.Cos(dblCaracteristicaSistema * (dblLongitud - dblPosicionCarga1) * 100)) + Math.Sin(dblCaracteristicaSistema * dblLongitud * 100) * (Math.Sinh(dblCaracteristicaSistema * (dblLongitud - dblPosicionCarga1) * 100) * Math.Cos(dblCaracteristicaSistema * dblPosicionCarga1 * 100) - Math.Cosh(dblCaracteristicaSistema * (dblLongitud - dblPosicionCarga1) * 100) * Math.Sin(dblCaracteristicaSistema * dblPosicionCarga1 * 100))
        '
        '

        ''''''''''''''''''''''''''''''''''''''''''''CALCULO CON 1 CARGA


        Dim i As Integer
        Dim XC1 As Decimal
        '
        If combobCantidadCargas.Text = "1" Then 'Existen solo 1 carga


            'prueba con dgv
            dtc1.Columns.Add("Punto")
            dtc1.Columns.Add("X (m)")
            dtc1.Columns.Add("Y (cm)")
            dtc1.Columns.Add("V (Kgf)")
            dtc1.Columns.Add("M (Kgf*m)")
            dtc1.Columns.Add("P (Kgf*cm2)")

            Dim dr1 As DataRow
            Dim dr3 As DataRow


            i = 0
            XC1 = 0

            While XC1 <= dblPosicionCarga1
                dr1 = dtc1.NewRow
                dr1(0) = XC1 / intervalo + 1
                dr1(1) = (XC1).ToString("0.00")
                dr1(2) = (((dblCarga1 * 10 * dblCaracteristicaSistema) / (dblBalasto * dblAncho) * 1 / ((Math.Sinh(dblCaracteristicaSistema * dblLongitud * 100)) ^ 2 - (Math.Sin(dblCaracteristicaSistema * dblLongitud * 100)) ^ 2) * (2 * Math.Cosh(dblCaracteristicaSistema * XC1 * 100) * Math.Cos(dblCaracteristicaSistema * XC1 * 100) * decAaC1 + (Math.Cosh(dblCaracteristicaSistema * XC1 * 100) * Math.Sin(dblCaracteristicaSistema * XC1 * 100) + Math.Sinh(dblCaracteristicaSistema * XC1 * 100) * Math.Cos(dblCaracteristicaSistema * XC1 * 100)) * decBbC1)).ToString("0.000"))
                dr1(3) = ((dblCarga1 * 1000 * 1 / ((Math.Sinh(dblCaracteristicaSistema * dblLongitud * 100)) ^ 2 - (Math.Sin(dblCaracteristicaSistema * dblLongitud * 100)) ^ 2) * ((Math.Cosh(dblCaracteristicaSistema * XC1 * 100) * Math.Sin(dblCaracteristicaSistema * XC1 * 100) + Math.Sinh(dblCaracteristicaSistema * XC1 * 100) * Math.Cos(dblCaracteristicaSistema * XC1 * 100)) * decAaC1 + (Math.Sinh(dblCaracteristicaSistema * XC1 * 100) * Math.Sin(dblCaracteristicaSistema * XC1 * 100)) * decBbC1)).ToString("0.00"))
                dr1(4) = (((dblCarga1 * 10 / dblCaracteristicaSistema) * 1 / (2 * ((Math.Sinh(dblCaracteristicaSistema * dblLongitud * 100)) ^ 2 - (Math.Sin(dblCaracteristicaSistema * dblLongitud * 100)) ^ 2)) * (2 * Math.Sinh(dblCaracteristicaSistema * XC1 * 100) * Math.Sin(dblCaracteristicaSistema * XC1 * 100) * decAaC1 + (Math.Cosh(dblCaracteristicaSistema * XC1 * 100) * Math.Sin(dblCaracteristicaSistema * XC1 * 100) - Math.Sinh(dblCaracteristicaSistema * XC1 * 100) * Math.Cos(dblCaracteristicaSistema * XC1 * 100)) * decBbC1)).ToString("0.00"))
                dr1(5) = (((dblCarga1 * 10 * dblCaracteristicaSistema) / (dblBalasto * dblAncho) * 1 / ((Math.Sinh(dblCaracteristicaSistema * dblLongitud * 100)) ^ 2 - (Math.Sin(dblCaracteristicaSistema * dblLongitud * 100)) ^ 2) * (2 * Math.Cosh(dblCaracteristicaSistema * XC1 * 100) * Math.Cos(dblCaracteristicaSistema * XC1 * 100) * decAaC1 + (Math.Cosh(dblCaracteristicaSistema * XC1 * 100) * Math.Sin(dblCaracteristicaSistema * XC1 * 100) + Math.Sinh(dblCaracteristicaSistema * XC1 * 100) * Math.Cos(dblCaracteristicaSistema * XC1 * 100)) * decBbC1)) * dblBalasto).ToString("0.000")
                dtc1.Rows.Add(dr1)

                i += 1
                XC1 = i * intervalo

            End While

            i = 0
            XC1 = dblPosicionCarga1

            While XC1 <= dblLongitud
                dr1 = dtc1.NewRow
                dr1(0) = XC1 / intervalo + 2
                dr1(1) = (XC1).ToString("0.00")
                dr1(2) = ((dblCarga1 * 10 * dblCaracteristicaSistema) / (dblBalasto * dblAncho) * 1 / ((Math.Sinh(dblCaracteristicaSistema * dblLongitud * 100)) ^ 2 - (Math.Sin(dblCaracteristicaSistema * dblLongitud * 100)) ^ 2) * (2 * Math.Cosh(dblCaracteristicaSistema * (dblLongitud - XC1) * 100) * Math.Cos(dblCaracteristicaSistema * (dblLongitud - XC1) * 100) * decCcC1 + (Math.Cosh(dblCaracteristicaSistema * (dblLongitud - XC1) * 100) * Math.Sin(dblCaracteristicaSistema * (dblLongitud - XC1) * 100) + Math.Sinh(dblCaracteristicaSistema * (dblLongitud - XC1) * 100) * Math.Cos(dblCaracteristicaSistema * (dblLongitud - XC1) * 100)) * decDdC1)).ToString("0.000")
                dr1(3) = (-dblCarga1 * 1000 * 1 / ((Math.Sinh(dblCaracteristicaSistema * dblLongitud * 100)) ^ 2 - (Math.Sin(dblCaracteristicaSistema * dblLongitud * 100)) ^ 2) * ((Math.Cosh(dblCaracteristicaSistema * (dblLongitud - XC1) * 100) * Math.Sin(dblCaracteristicaSistema * (dblLongitud - XC1) * 100) + Math.Sinh(dblCaracteristicaSistema * (dblLongitud - XC1) * 100) * Math.Cos(dblCaracteristicaSistema * (dblLongitud - XC1) * 100)) * decCcC1 + (Math.Sinh(dblCaracteristicaSistema * (dblLongitud - XC1) * 100) * Math.Sin(dblCaracteristicaSistema * (dblLongitud - XC1) * 100)) * decDdC1)).ToString("0.00")
                dr1(4) = ((dblCarga1 * 10 / dblCaracteristicaSistema) * 1 / (2 * ((Math.Sinh(dblCaracteristicaSistema * dblLongitud * 100)) ^ 2 - (Math.Sin(dblCaracteristicaSistema * dblLongitud * 100)) ^ 2)) * (2 * Math.Sinh(dblCaracteristicaSistema * (dblLongitud - XC1) * 100) * Math.Sin(dblCaracteristicaSistema * (dblLongitud - XC1) * 100) * decCcC1 + (Math.Cosh(dblCaracteristicaSistema * (dblLongitud - XC1) * 100) * Math.Sin(dblCaracteristicaSistema * (dblLongitud - XC1) * 100) - Math.Sinh(dblCaracteristicaSistema * (dblLongitud - XC1) * 100) * Math.Cos(dblCaracteristicaSistema * (dblLongitud - XC1) * 100)) * decDdC1)).ToString("0.00")
                dr1(5) = (dblBalasto * (dblCarga1 * 10 * dblCaracteristicaSistema) / (dblBalasto * dblAncho) * 1 / ((Math.Sinh(dblCaracteristicaSistema * dblLongitud * 100)) ^ 2 - (Math.Sin(dblCaracteristicaSistema * dblLongitud * 100)) ^ 2) * (2 * Math.Cosh(dblCaracteristicaSistema * (dblLongitud - XC1) * 100) * Math.Cos(dblCaracteristicaSistema * (dblLongitud - XC1) * 100) * decCcC1 + (Math.Cosh(dblCaracteristicaSistema * (dblLongitud - XC1) * 100) * Math.Sin(dblCaracteristicaSistema * (dblLongitud - XC1) * 100) + Math.Sinh(dblCaracteristicaSistema * (dblLongitud - XC1) * 100) * Math.Cos(dblCaracteristicaSistema * (dblLongitud - XC1) * 100)) * decDdC1)).ToString("0.000")
                dtc1.Rows.Add(dr1)

                i += 1
                XC1 = dblPosicionCarga1 + i * intervalo
            End While
End Sub
After the second Loop, I just tried to do dr3 = dr1 + dr1, but It shows an error.
I also tried dt3 = dt1 + dt1 and It's the same story.
I notice you used (r)(c) but those are previously declared variables? If so, how would you declare them? would (r) be datarow? so, in my case, it would be dr1?
Thanks in advance, Tommy.
Hi Alexander,
It takes practice. You should start with simple exercises and then do you larger project.
A datatable is very similar to a datagridview. However when you refer to a cell in a datatable (dt) you just
x = dt(r)(c)
and
dt(r)(c) = x2
where r is the row and c is the column index values. A cell is value type by default (x) which can be numbers or strings etc.
In a datagridview (dgv) you do:
dim x as decimal
x = cdec( dgv.rows(r).cells(c).value )
To add a row to a datatable you declare an empty row with .NewRow like:
dr = dt.NewRow
where dr is just a temp row for the defined datatable dt. So if dt has 20 cols then dr is one row with 20 empty cols.
Then you fill dr:
dr(0) = XC1
where dr(1) means cell (column) one in the dr datarow. and
dr(1) = XC1 * 2
dr(2) = XC1 * 3
So you fill the temp row dr and then add the row to the datatable
dt.Rows.Add(dr)
For a dgv its:
DataGridView1.Rows.Add(XC1, XC1 * 2, XC1 * 3)
see the difference? see how its the same but just differenct syntax?
I am just going from memory did I do it right?
So if we have two data tables dt1 and dt2 and want to add cells and put the total in a third datatable dt3 then we just loop every cell
        For r As Integer = 0 To dt3.rows.count - 1
            For c As Integer = 0 To dt3.columns.count - 1

                dt3(r)(c) = dt1(r)(c) + dt2(r)(c)

            Next
        Next
PS You have to make dt3 first then run the loop above. There are other ways to do it.
So that line above adds the cells (r,c) in tables 1 and 2 and puts the result in cell (r,c) of table 3. And that assumes there are equal rows and cols in all the tables.
Comprende?
You may need to cdec() the values?
Give it a try and come back if ??s.
Plus, I am fairly sure there is some easier way to add the values or rows even but I dont know it without looking for it. Any how its good to do it the long way first (as I show).
Saturday, October 13, 2018 6:00 PM
PS Why don't you use a for loop like I showed in the chart example? I think you can get it to work. I recall there was some accuracy issue but I think it should work as I show? Much easier.
:)
Saturday, October 13, 2018 7:55 PM
I new it had some structure like that, but after several attemps I was more confused so I decided to ask. But this works for me just fine.
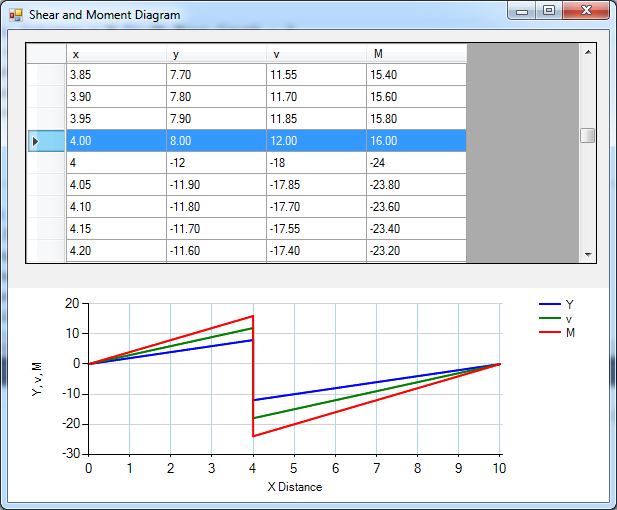
Btw, I tried the code you showed above in previous replies, but I changed the interval to a wider one (from 0.05 to 0.5) in order to see what happened with the break at 4.0 and this was the result:
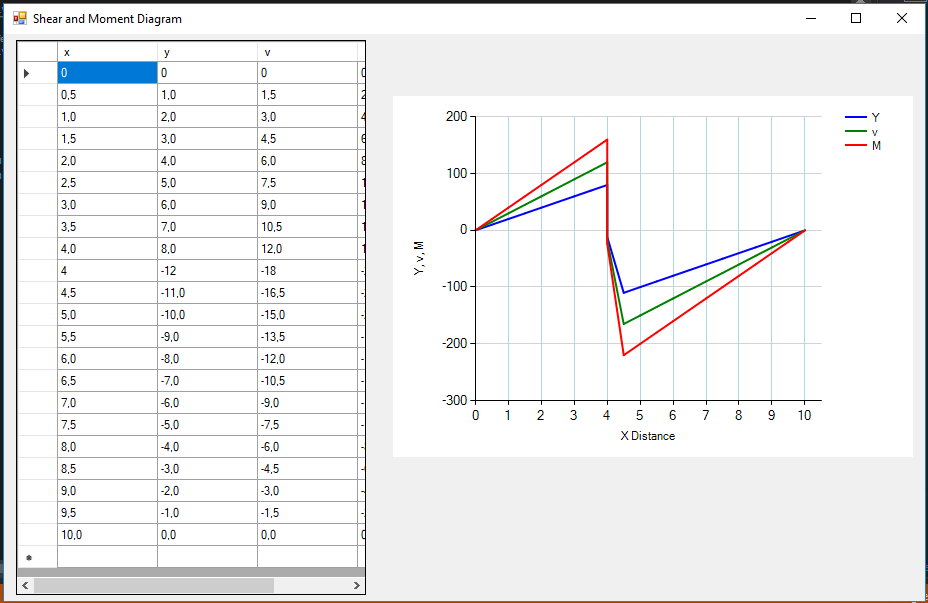
It also happens for small steps (0.05, 0.005, etc), but in those cases the error is unoticeable. When the step is 1.0, however, it does it perfectly. As I show on the next picture:
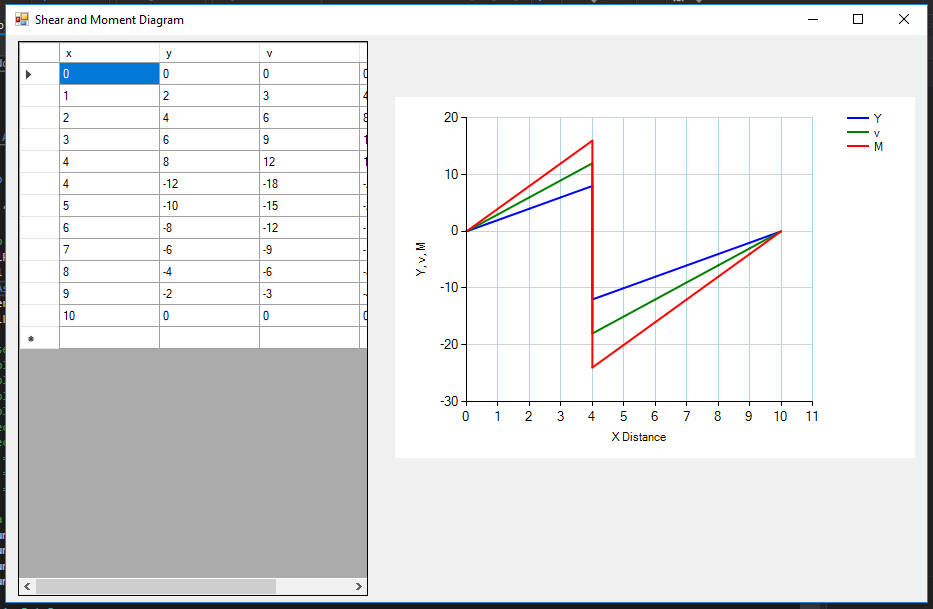
This is kinda bothering me. I will try to find a solution and report the results.
Thanks for all buddy
Saturday, October 13, 2018 7:56 PM
PS Why don't you use a for loop like I showed in the chart example? I think you can get it to work. I recall there was some accuracy issue but I think it should work as I show? Much easier.
:)
I had the While...End while structured already written with listviews, I just changed listviews to dgv. Nothing personal :)
Saturday, October 13, 2018 9:52 PM
"Btw, I tried the code you showed above in previous replies, but I changed the interval to a wider one (from 0.05 to 0.5) in order to see what happened with the break at 4.0 and this was the result:"
I don't know it seems to work with the example I posted above with xstep = 0.5.
This is the only change to the example code above.
Dim xstep As Decimal = CDec(0.5) 'step length
Hmmm, the data looks correct in the dgv. Same as I show here.
Must be something in the way the points are added to the chart series? You must be missing the second x = 4 y = -12 ? Did you change that part of the chart data series?
Plus I had to make everything decimal or it would not plot by value but by index, that makes it plot the second x =4 at 4.5 ?
Oh wait... your y axis is 0 to 200 ? Mine is 0 to 20. The values and chart should be the same with any x increment?
Sunday, October 14, 2018 2:15 AM
"Btw, I tried the code you showed above in previous replies, but I changed the interval to a wider one (from 0.05 to 0.5) in order to see what happened with the break at 4.0 and this was the result:"
I don't know it seems to work with the example I posted above with xstep = 0.5.
This is the only change to the example code above.
Dim xstep As Decimal = CDec(0.5) 'step lengthHmmm, the data looks correct in the dgv. Same as I show here.
Must be something in the way the points are added to the chart series? You must be missing the second x = 4 y = -12 ? Did you change that part of the chart data series?
Plus I had to make everything decimal or it would not plot by value but by index, that makes it plot the second x =4 at 4.5 ?
Oh wait... your y axis is 0 to 200 ? Mine is 0 to 20. The values and chart should be the same with any x increment?
Tommy, I found the issue. The problem arises when dblPosicionCarga1 is not multiple to *xstep. *
When dblPosicionCarga1 is, for instance, equal to 4.30 and xtep is 0.20, from 0 to 10. The chart will plot an that little deviation. However, you notice that the break number is not repeated, nor the slope is alterred. So it's just a little error that can be easily avoided by forcng dblPosicionCarga1 and xstep to be multiple to each other.
I'm glad to tell you I'm working fine with DataTables, Datagridviews and charts. I must thank you for all the help and guidance you have given to me. I will update my other posts with relevant information I find on the completion of my project. :)
Best regards