הערה
הגישה לדף זה מחייבת הרשאה. באפשרותך לנסות להיכנס או לשנות מדריכי כתובות.
הגישה לדף זה מחייבת הרשאה. באפשרותך לנסות לשנות מדריכי כתובות.
Question
Thursday, April 24, 2014 2:33 AM
I Wrote a number of programs in vb6 to among other thing graph up to 4 set of data on the same graph using a picture box using line (x1,y1)-(x2,y2) using pixels or twips. Then mouse movement would display the values under the cursor. I would have 4 different Y axis. each data set had about 840 values. (hours in amonth) The Y valus were scaled to fit the height of the picturebox. This program also uses rs232 serial communicaions to talk to industrial equipment. It is now time to rewite this program using vb2012 from Visual Studio 2012. I have been unable to find a workable solution to do the graph in vb.net. 1.) is there a way to do this in vb.net? 2.) if not vb what language should i be using? Warren
All replies (10)
Thursday, April 24, 2014 2:58 AM ✅Answered
Yes there is a workable solution to do the graph in vb.net. It would require you to become proficient with the ChartControl which could be time consuming depending on your abilities.
Although coders will say this or that can not be done with the ChartControl usually it's because their proficiency with the ChartControl is limited and therefore they can't conceive of a way to do this or that with the ChartControl IMO and from my experience with questions about it on these threads and the forum for the ChartControl.
For example you want 4 y axes which may be unnecessary. As I've provided code to someone on how to show points in 4 different levels of a chart without using 4 y axes. Although the someone did not want to use it cause it required math to separate stuff along the axes. Even though the math was simple although it required about an hour for me to figure it out.
And you can display tooltips for values under a point. I'm not certain why you would want to do that for any pixel anywhere on the chart control though.
Maybe this thread can give you an idea or maybe not.
Create a y-axis at different scales with Windows Charts
Hello. I'm old and retired. I like to program if you could call what I do programming. However I'd like to code for you! If you've got the dime then I've got the time. Call me, landline, @ BR-549.
Thursday, April 24, 2014 4:12 AM ✅Answered
Another suggestion would be to create a custom control for the graph. You can do all of your drawing in a similar fashion to what you did in VB6 by overriding the OnPaint method in your custom control and using the methods on e.Graphics to draw your lines and points, as well as any info text which is based on the mouse position.
Here is a very simple example that you can build upon. To use this sample, just start a new Windows Forms Application project and paste this coded over the default Form1 code:
Public Class Form1
    Private Graph As New GraphControl With {.Dock = DockStyle.Fill}

    Private Sub Form1_Load(sender As Object, e As EventArgs) Handles MyBase.Load
        Me.Size = New Size(1280, 720)
        Controls.Add(Graph)
        Graph.DataPoints = New PointF() {New PointF(10, 10), New PointF(20, 30), New PointF(30, 35), New PointF(40, 40)}
    End Sub
End Class

Public Class GraphControl
    Inherits Control

    Public Property XAxisMax As Single = 50.0!
    Public Property YAxisMax As Single = 50.0!
    Public Property XStep As Single = 5.0!
    Public Property YStep As Single = 5.0!

    Public Property DataPoints As PointF()

    Private graphBounds As RectangleF
    Private centerFormat As New System.Drawing.StringFormat With {.Alignment = StringAlignment.Center}

    Public Sub New()
        BackColor = Color.White
        DoubleBuffered = True
    End Sub

    Protected Overrides Sub OnMouseMove(e As MouseEventArgs)
        MyBase.OnMouseMove(e)
        Invalidate()
    End Sub

    Protected Overrides Sub OnPaint(e As PaintEventArgs)
        MyBase.OnPaint(e)

        e.Graphics.DrawLine(Pens.Black, graphBounds.Left, graphBounds.Top, graphBounds.Left, graphBounds.Bottom)
        e.Graphics.DrawLine(Pens.Beige, graphBounds.Left, graphBounds.Bottom, graphBounds.Right, graphBounds.Bottom)

        Dim xlinestep As Single = graphBounds.Width / (XAxisMax + 1)
        Dim ylinestep As Single = graphBounds.Height / (YAxisMax + 1)

        For i As Integer = 0 To XAxisMax
            e.Graphics.DrawString(i.ToString, Font, Brushes.Black, (graphBounds.Left + (xlinestep * i)), graphBounds.Bottom + Font.Height, centerFormat)
        Next

        For i As Integer = 0 To YAxisMax
            e.Graphics.DrawString(i.ToString, Font, Brushes.Black, graphBounds.Left - Font.Height, graphBounds.Bottom - (ylinestep * i))
        Next

        If DataPoints IsNot Nothing Then
            For Each p As PointF In DataPoints
                Dim pbounds As New RectangleF(graphBounds.Left + (p.X * xlinestep - 3), graphBounds.Bottom - (p.Y * ylinestep - 3), 6, 6)
                e.Graphics.FillEllipse(Brushes.CornflowerBlue, pbounds)
                Dim mouseloc As Point = PointToClient(MousePosition)
                If pbounds.Contains(mouseloc) Then
                    e.Graphics.DrawString(p.ToString, Font, Brushes.Black, pbounds.X, pbounds.Y - Font.Height)
                End If
            Next
        End If
    End Sub

    Protected Overrides Sub OnSizeChanged(e As EventArgs)
        MyBase.OnSizeChanged(e)
        graphBounds = New RectangleF(32, 0, ClientSize.Width - 32, ClientSize.Height - 32)
        Invalidate()
    End Sub
End Class
Hopefully this will give you an idea of how to get started with your own custom control. Note that this sample adds the control to the form in code just for simplicity, but if you Build the application you will see that GraphControl appears at the top of you toolbox and can be added to the form at design time.
There are lots of other method on the Control that you can override as well. Just type "Overrides" and hit space to see your options. Commonly a custom control will override OnMouseUp/Down or the keyboard methods to handle input to the control.
Explore the members of the Graphics instance as well as the members of System.Drawing and System.Drawing.Drawing2D for additional things you can do with GDI, and make use of ControlPaint and TextRenderer when applicable.
Reed Kimble - "When you do things right, people won't be sure you've done anything at all"
Thursday, April 24, 2014 4:15 AM ✅Answered | 1 vote
You can also draw your own graphics as you did in vb6. You just have to learn the new ways. Its not that hard. You should also compare with the chart control. Why re-invent the wheel?
Pretty much anything you can do with vb6 you can do with vs2012.
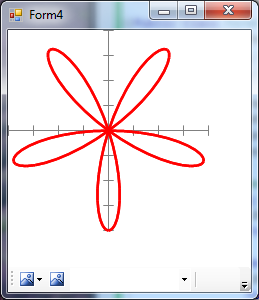
Here is a very simple graph example.
Imports System.Drawing.Drawing2D

Public Class Form4
    Private Sub Form4_Paint(sender As Object, e As PaintEventArgs) Handles Me.Paint
        Dim x, y, old_x, old_y As Single
        Dim r, t, dt

        With e.Graphics
            .SmoothingMode = SmoothingMode.AntiAlias
            .ScaleTransform(50, 50)
            .TranslateTransform(2, 2)

            ' Draw axes.
            Using p As New Pen(Color.Gray, 0)
                .DrawLine(p, -2, 0, 2, 0)
                For x = -2 To 2 Step 0.5
                    .DrawLine(p, x, -0.1F, x, 0.1F)
                Next x
                .DrawLine(p, 0, -2, 0, 2)
                For y = -2 To 2 Step 0.5
                    .DrawLine(p, -0.1F, y, 0.1F, y)
                Next y

                ' Draw the parametric curve.
                dt = Math.PI / 100

                p.Color = Color.Red
                p.Width = 0.05
                Do While t <= 2 * Math.PI
                    r = 2 * Math.Sin(5 * t)
                    x = r * Math.Cos(t)
                    y = r * Math.Sin(t)
                    .DrawLine(p, old_x, old_y, _
                        x, y)
                    old_x = x
                    old_y = y
                    t = t + dt
                Loop
                .DrawLine(p, old_x, old_y, 0, 0)
            End Using
        End With
    End Sub
Thursday, April 24, 2014 4:35 AM
You can also draw your own graphics as you did in vb6. You just have to learn the new ways. Its not that hard. You should also compare with the chart control. Why re-invent the wheel?
Pretty much anything you can do with vb6 you can do with vs2012.
Here is a very simple graph example.
Imports System.Drawing.Drawing2D

Public Class Form4
    Private Sub Form4_Paint(sender As Object, e As PaintEventArgs) Handles Me.Paint
        Dim x, y, old_x, old_y As Single
        Dim r, t, dt

        With e.Graphics
            .SmoothingMode = SmoothingMode.AntiAlias
            .ScaleTransform(50, 50)
            .TranslateTransform(2, 2)

            ' Draw axes.
            Using p As New Pen(Color.Gray, 0)
                .DrawLine(p, -2, 0, 2, 0)
                For x = -2 To 2 Step 0.5
                    .DrawLine(p, x, -0.1F, x, 0.1F)
                Next x
                .DrawLine(p, 0, -2, 0, 2)
                For y = -2 To 2 Step 0.5
                    .DrawLine(p, -0.1F, y, 0.1F, y)
                Next y

                ' Draw the parametric curve.
                dt = Math.PI / 100

                p.Color = Color.Red
                p.Width = 0.05
                Do While t <= 2 * Math.PI
                    r = 2 * Math.Sin(5 * t)
                    x = r * Math.Cos(t)
                    y = r * Math.Sin(t)
                    .DrawLine(p, old_x, old_y, _
                        x, y)
                    old_x = x
                    old_y = y
                    t = t + dt
                Loop
                .DrawLine(p, old_x, old_y, 0, 0)
            End Using
        End With
    End Sub
Nice code tommytwotrain!
Lies will become truths and truths will become lies. 666 baby!
Thursday, April 24, 2014 6:11 AM
Yea the twips is a good sample good to remember for the next generation. It was a brilliant idea from somebody at Microsoft made for the future. However, that future was short. it was only used in VB6 so it died because of those who did not understand the brilliant idea from that employee.
Now we use in VB again the general standard pixel instead of that. For the rest I think the replies in this thread all worth to mark as answer.
Success
Cor
Thursday, April 24, 2014 6:42 AM | 1 vote
Nice code tommytwotrain!
Gee thanks Monkey.
I could not resist fancying it up a little more for you.
Imports System.Drawing.Drawing2D

Public Class Form6
    Private WithEvents Timer1 As New System.Windows.Forms.Timer With {.Interval = 70}

    Private Sub Form6_Load(sender As Object, e As EventArgs) Handles Me.Load
        Me.DoubleBuffered = True
        Me.BackgroundImageLayout = ImageLayout.Zoom
        Me.BackColor = Color.White
        Timer1.Start()

    End Sub

    Private Sub Timer1_Tick(sender As Object, e As EventArgs) Handles Timer1.Tick
        Static Rotation As Single = 0
        Rotation += 2
        If Rotation > 359 Then Rotation = 0

        Static ScaleFactor As Single = 0.5
        Static increment As Single = 0.1
        ScaleFactor += increment
        If ScaleFactor > 2 Then
            increment = -increment
        End If
        If ScaleFactor < 0.2 Then increment = -increment

        Dim x, y, old_x, old_y As Single
        Dim t As Single
        Dim m_bitmap As Bitmap = New Bitmap(200, 200)

        Using g As Graphics = Graphics.FromImage(m_bitmap)
            With g
                .Clear(Color.White)
                .SmoothingMode = SmoothingMode.AntiAlias

                'calc offest to the center of the image at its current location
                .TranslateTransform(m_bitmap.Width / 2.0, m_bitmap.Height / 2.0)
                .ScaleTransform(50 * ScaleFactor, 50 * ScaleFactor)
                .RotateTransform(Rotation)

                Using p As New Pen(Color.Gray, 0)
                    ' Draw axes.
                    .DrawLine(p, -2, 0, 2, 0)
                    For x = -2 To 2 Step 0.5
                        .DrawLine(p, x, -0.1F, x, 0.1F)
                    Next x
                    .DrawLine(p, 0, -2, 0, 2)
                    For y = -2 To 2 Step 0.5
                        .DrawLine(p, -0.1F, y, 0.1F, y)
                    Next y

                    p.Color = Color.Red
                    p.Width = 0.05
                    Do While t <= 2 * Math.PI
                        x = 2 * Math.Sin(5 * t) * Math.Cos(t)
                        y = 2 * Math.Sin(5 * t) * Math.Sin(t)
                        .DrawLine(p, old_x, old_y, x, y)
                        old_x = x
                        old_y = y
                        t += Math.PI / 100
                    Loop
                    .DrawLine(p, old_x, old_y, 0, 0)

                End Using
            End With
        End Using
        Me.BackgroundImage = m_bitmap

    End Sub
End Class
Sunday, April 27, 2014 11:32 PM
Thank you for your reply. I have been working with yours and tommytwotrains examples. Spending a lot of time trying to figure out what 'e' means. Not in the help section of vb-help . Am I correct in assuming that the code will Auto size to the screen if the height and width is gotten programmatically?
Not sure how you changed the coordinate system. VB6 was screen.scale(0,height)-(width,0)
Don't understand why tommytwotrain used "Imports System Drawing.Drawing2D" where you did not. not being critical just trying to gain an understanding.
Have not got to the "overrides" yet just trying to figure how what you wrote works. none of the books that i have on 2010vb are real helpful. I am beginning to think, at 67yr old, i would be wiser to pay someone to write what I need as i may not live long enough to learn what i need to know.!!!
Monday, April 28, 2014 12:07 AM
This requires the imports statement in tommytwotrains code. Usually if you comment out an imports statement you will see a line show an error in code.
".SmoothingMode = SmoothingMode.AntiAlias"
Although for some reason if you look in Visual Studios references like when you add a reference to a program you will see about 10 or so default references checked. They are not all necessary and I believe but am not certain that your executable is "tighter" (smaller, more concise) if they are not all used. As I think they are compiled into the program if they are used. But then you would need to know why they may or may not be required also.
System.Drawing is checked in mine by default. But Drawing2D has to be imported in order to use it.
La vida loca
Monday, April 28, 2014 12:44 AM | 1 vote
Thank you for your reply. I have been working with yours and tommytwotrains examples. Spending a lot of time trying to figure out what 'e' means. Not in the help section of vb-help . Am I correct in assuming that the code will Auto size to the screen if the height and width is gotten programmatically?
Not sure how you changed the coordinate system. VB6 was screen.scale(0,height)-(width,0)
Don't understand why tommytwotrain used "Imports System Drawing.Drawing2D" where you did not. not being critical just trying to gain an understanding.
Have not got to the "overrides" yet just trying to figure how what you wrote works. none of the books that i have on 2010vb are real helpful. I am beginning to think, at 67yr old, i would be wiser to pay someone to write what I need as i may not live long enough to learn what i need to know.!!!
e is a graphics surface that you can draw on. In an event like paint the sub routine is passed various applicable things for that event. So in paint you have e As PaintEventArgs where the PaintEventArgs are a group of things. .graphics is a variable in the e painteventargs group which has a pointer to the graphics surface. So you can draw to it just like you did in vb6:
e.graphics.drawline(x1,y1,x2,y2)
If the paint event is for a picturebox then the line draws on the picturebox. In .net you dont have the Autoredraw setting. Instead you are responsible for updating the graphics as needed. In .net the paint event fires when the form needs updating so if you draw there you have the e.graphics made and the timing of when to update the form is all done for you. Of course there are many ways to do it. I is tricky to learn but well worth it.
**Am I correct in assuming that the code will Auto size to the screen if the height and width is gotten programmatically? **
Not really. Some controls have auto size for bitmaps. But when it comes to drawing like a graph, you need to scale it to fit the drawing window.
Not sure how you changed the coordinate system. VB6 was screen.scale(0,height)-(width,0)
I used transforms. Basically like the scale statement.
Don't understand why tommytwotrain used "Imports System Drawing.Drawing2D" where you did not. not being critical just trying to gain an understanding.
As Monkey showed some of the grapics statements are in the drawing "namespace". You may need to add a project reference to them. Sort of like adding a .ocx file in vb6. Or maybe like adding an API call.
Its not that bad. Monkey's example is more advanced. Part of the game is learning to use Microsofts documentation.
Friday, February 20, 2015 5:52 AM | 1 vote
Tommy this is great help, thanks a lot...