הערה
הגישה לדף זה מחייבת הרשאה. באפשרותך לנסות להיכנס או לשנות מדריכי כתובות.
הגישה לדף זה מחייבת הרשאה. באפשרותך לנסות לשנות מדריכי כתובות.
Question
Wednesday, May 27, 2015 8:23 PM
Hi Friends,
As in following vb.net code I am creating chart and I want to change the chartype dynamically/runtime please help me how I can achive this.
my code as followed
Dim xglobal_table As DataTable
Dim ChartArea1 As ChartArea = New ChartArea()
Dim Legend1 As Legend = New Legend()
Dim Series1 As Series = New Series()
Dim Chart1 = New Chart()
Me.Controls.Add(Chart1)
ChartArea1.Name = "ChartArea1"
Chart1.ChartAreas.Add(ChartArea1)
Legend1.Name = "Legend1"
Chart1.Legends.Add(Legend1)
Chart1.Location = New System.Drawing.Point(200, 40)
Chart1.Name = "Missing indexes"
Series1.ChartArea = "ChartArea1"
Series1.Legend = "Legend1"
Series1.Name = "Missingindexes"
Chart1.Series.Add(Series1)
Chart1.Size = New System.Drawing.Size(800, 400)
Chart1.Series("Missingindexes").ChartType = SeriesChartType.Line
Chart1.Series("Missingindexes").XValueMember = "Database.schema.table"
Chart1.Series("Missingindexes").YValueMembers = "index_advantage"
Chart1.DataSource = dt_table
thank you.
regards,
asad
asad
All replies (5)
Thursday, May 28, 2015 11:56 AM ✅Answered
To change the chart dynamically you simply draw it again with the new settings.
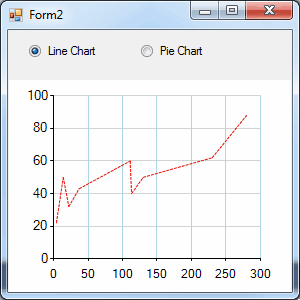
Option Strict On
Imports System.Windows.Forms.DataVisualization.Charting

Public Class Form2
    Private Sub Form2_Load(sender As Object, e As EventArgs) Handles MyBase.Load
        RadioButton1.Checked = True

    End Sub
    Private Sub RadioButton1_CheckedChanged(sender As Object, e As EventArgs) Handles RadioButton1.CheckedChanged
        DrawChart()
    End Sub
    Public Sub DrawChart()
        'setup the chart
        With Chart1.ChartAreas(0)
            .AxisX.MajorGrid.LineColor = Color.LightBlue
            .AxisY.MajorGrid.LineColor = Color.LightGray

            .AxisX.Minimum = 0
            .AxisX.Maximum = 300
            .AxisX.Interval = 50

            .AxisY.Minimum = 0
            .AxisY.Maximum = 100
            .AxisY.Interval = 20

        End With

        Chart1.Series.Clear()
        Chart1.Series.Add("first")

        With Chart1.Series(0)
            .IsVisibleInLegend = False
            If RadioButton1.Checked Then
                .ChartType = DataVisualization.Charting.SeriesChartType.Line
            Else
                .ChartType = DataVisualization.Charting.SeriesChartType.Pie
            End If

            .Color = Color.Red
            .BorderDashStyle = ChartDashStyle.Dash
            .IsVisibleInLegend = False

            Dim xvals As List(Of Single) = New List(Of Single)({4, 14, 22, 37, 111, 113, 130, 230, 280})
            Dim yvals As List(Of Single) = New List(Of Single)({22, 50, 32, 43, 60, 40, 50, 62, 88})

            .Points.DataBindXY(xvals, yvals)

        End With
    End Sub
End Class
Thursday, May 28, 2015 5:58 AM
Asad,
I see you got already 9 hours no reply, that is strange for this forum.
Probably it is because the chart is not really the hobby of many programmers, in fact is it as well no question for this forum.
Therefore try the forum for windows forms form controls.
https://social.msdn.microsoft.com/Forums/windows/en-US/home?forum=winforms
Or maybe can a moderator move it to that one.
Success
Cor
Thursday, May 28, 2015 6:03 AM
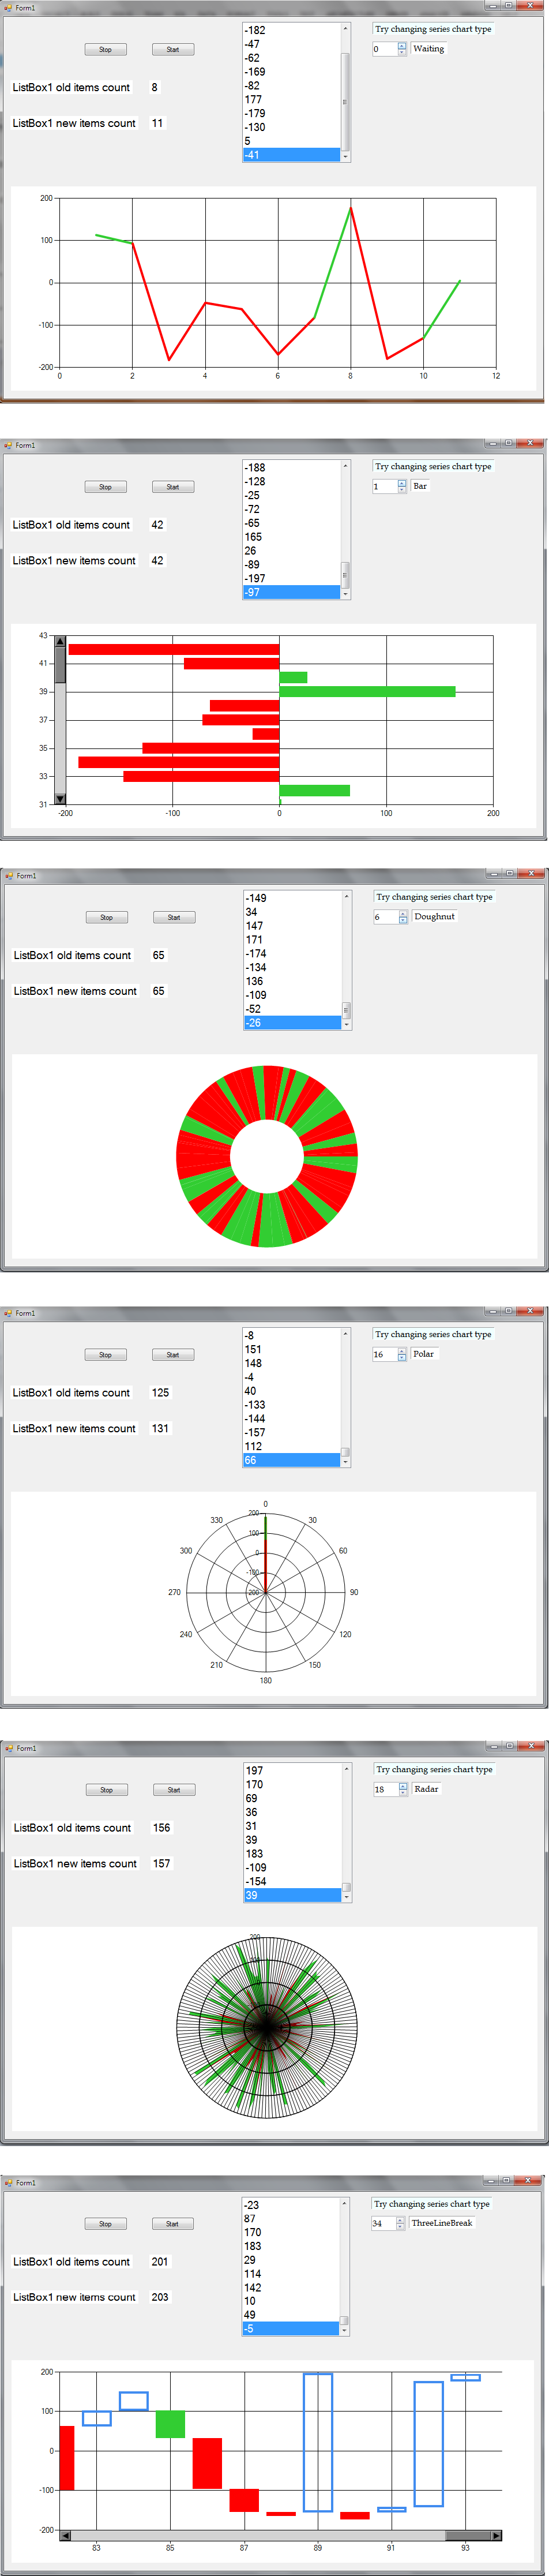
I suppose this may help. There is both a List(Of SeriesChartType) (used to test with initially) and a Dictionary(Of String, SeriesChartType) (used for final test for displaying the chart type name being used) in the code. The NumericUpDown sub handles altering a series ChartType.
If a series chart type is altered to a chart type that does not perhaps support whatever the series is used for then I suppose an error would occur. That did not happen with the data being provided to this series.
Option Strict On

Imports System.Windows.Forms.DataVisualization.Charting

Public Class Form1

    Dim Generate As New Random
    Dim IncreaseWidth As Integer = 0
    Dim Count As Integer = 0
    Dim Chart1HorizontalScroll As Integer = 0

    Dim ListBox1OldItemsCount As Integer = 0
    Dim ListBox1NewItemsCount As Integer = 1

    Dim Timer1IntervalChanger As Integer = 0

    Dim ChartSeriesTypeList As New List(Of SeriesChartType)
    Dim ChartSeriesTypeDict As New Dictionary(Of String, SeriesChartType)

    Private Sub Form1_Load(sender As Object, e As EventArgs) Handles MyBase.Load
        Me.Location = New Point(CInt((Screen.PrimaryScreen.WorkingArea.Width / 2) - (Me.Width / 2)), CInt((Screen.PrimaryScreen.WorkingArea.Height / 2) - (Me.Height / 2)))
        Label3.Text = "0"
        Label4.Text = "0"
        Chart1.ChartAreas(0).AxisX.ScaleView.Size = 10
        Chart1.ChartAreas(0).AxisX.ScrollBar.Size = 20
        Chart1.ChartAreas(0).AxisX.ScrollBar.ButtonStyle = ScrollBarButtonStyles.SmallScroll
        Chart1.ChartAreas(0).AxisX.ScrollBar.IsPositionedInside = True
        Chart1.ChartAreas(0).AxisX.ScrollBar.BackColor = Color.LightGray
        Chart1.ChartAreas(0).AxisX.ScrollBar.ButtonColor = Color.Gray
        Chart1.Series("Example1").BorderWidth = 4 ' Set the lines width
        Timer1.Interval = 100
        Timer2.Interval = 500
        Timer3.Interval = 100
        Timer1.Start()
        Timer2.Start()
        Timer3.Start()


        ChartSeriesTypeList.Add(SeriesChartType.Area)
        ChartSeriesTypeList.Add(SeriesChartType.Bar)
        ChartSeriesTypeList.Add(SeriesChartType.BoxPlot)
        ChartSeriesTypeList.Add(SeriesChartType.Bubble)
        ChartSeriesTypeList.Add(SeriesChartType.Candlestick)
        ChartSeriesTypeList.Add(SeriesChartType.Column)
        ChartSeriesTypeList.Add(SeriesChartType.Doughnut)
        ChartSeriesTypeList.Add(SeriesChartType.ErrorBar)
        ChartSeriesTypeList.Add(SeriesChartType.FastLine)
        ChartSeriesTypeList.Add(SeriesChartType.FastPoint)
        ChartSeriesTypeList.Add(SeriesChartType.Funnel)
        ChartSeriesTypeList.Add(SeriesChartType.Kagi)
        ChartSeriesTypeList.Add(SeriesChartType.Line)
        ChartSeriesTypeList.Add(SeriesChartType.Pie)
        ChartSeriesTypeList.Add(SeriesChartType.Point)
        ChartSeriesTypeList.Add(SeriesChartType.PointAndFigure)
        ChartSeriesTypeList.Add(SeriesChartType.Polar)
        ChartSeriesTypeList.Add(SeriesChartType.Pyramid)
        ChartSeriesTypeList.Add(SeriesChartType.Radar)
        ChartSeriesTypeList.Add(SeriesChartType.Range)
        ChartSeriesTypeList.Add(SeriesChartType.RangeBar)
        ChartSeriesTypeList.Add(SeriesChartType.RangeColumn)
        ChartSeriesTypeList.Add(SeriesChartType.Renko)
        ChartSeriesTypeList.Add(SeriesChartType.Spline)
        ChartSeriesTypeList.Add(SeriesChartType.SplineArea)
        ChartSeriesTypeList.Add(SeriesChartType.SplineRange)
        ChartSeriesTypeList.Add(SeriesChartType.StackedArea)
        ChartSeriesTypeList.Add(SeriesChartType.StackedArea100)
        ChartSeriesTypeList.Add(SeriesChartType.StackedBar)
        ChartSeriesTypeList.Add(SeriesChartType.StackedBar100)
        ChartSeriesTypeList.Add(SeriesChartType.StackedColumn)
        ChartSeriesTypeList.Add(SeriesChartType.StackedColumn100)
        ChartSeriesTypeList.Add(SeriesChartType.StepLine)
        ChartSeriesTypeList.Add(SeriesChartType.Stock)
        ChartSeriesTypeList.Add(SeriesChartType.ThreeLineBreak)


        ChartSeriesTypeDict.Add("Area", SeriesChartType.Area)
        ChartSeriesTypeDict.Add("Bar", SeriesChartType.Bar)
        ChartSeriesTypeDict.Add("BoxPlot", SeriesChartType.BoxPlot)
        ChartSeriesTypeDict.Add("Bubble", SeriesChartType.Bubble)
        ChartSeriesTypeDict.Add("Candlestick", SeriesChartType.Candlestick)
        ChartSeriesTypeDict.Add("Column", SeriesChartType.Column)
        ChartSeriesTypeDict.Add("Doughnut", SeriesChartType.Doughnut)
        ChartSeriesTypeDict.Add("ErrorBar", SeriesChartType.ErrorBar)
        ChartSeriesTypeDict.Add("FastLine", SeriesChartType.FastLine)
        ChartSeriesTypeDict.Add("FastPoint", SeriesChartType.FastPoint)
        ChartSeriesTypeDict.Add("Funnel", SeriesChartType.Funnel)
        ChartSeriesTypeDict.Add("Kagi", SeriesChartType.Kagi)
        ChartSeriesTypeDict.Add("Line", SeriesChartType.Line)
        ChartSeriesTypeDict.Add("Pie", SeriesChartType.Pie)
        ChartSeriesTypeDict.Add("Point", SeriesChartType.Point)
        ChartSeriesTypeDict.Add("PointAndFigure", SeriesChartType.PointAndFigure)
        ChartSeriesTypeDict.Add("Polar ", SeriesChartType.Polar)
        ChartSeriesTypeDict.Add("Pyramid", SeriesChartType.Pyramid)
        ChartSeriesTypeDict.Add("Radar", SeriesChartType.Radar)
        ChartSeriesTypeDict.Add("Range", SeriesChartType.Range)
        ChartSeriesTypeDict.Add("RangeBar", SeriesChartType.RangeBar)
        ChartSeriesTypeDict.Add("RangeColumn", SeriesChartType.RangeColumn)
        ChartSeriesTypeDict.Add("Renko", SeriesChartType.Renko)
        ChartSeriesTypeDict.Add("Spline", SeriesChartType.Spline)
        ChartSeriesTypeDict.Add("SplineArea", SeriesChartType.SplineArea)
        ChartSeriesTypeDict.Add("SplineRange", SeriesChartType.SplineRange)
        ChartSeriesTypeDict.Add("StackedArea", SeriesChartType.StackedArea)
        ChartSeriesTypeDict.Add("StackedArea100", SeriesChartType.StackedArea100)
        ChartSeriesTypeDict.Add("StackedBar", SeriesChartType.StackedBar)
        ChartSeriesTypeDict.Add("StackedBar100", SeriesChartType.StackedBar100)
        ChartSeriesTypeDict.Add("StackedColumn", SeriesChartType.StackedColumn)
        ChartSeriesTypeDict.Add("StackedColumn100", SeriesChartType.StackedColumn100)
        ChartSeriesTypeDict.Add("StepLine", SeriesChartType.StepLine)
        ChartSeriesTypeDict.Add("Stock", SeriesChartType.Stock)
        ChartSeriesTypeDict.Add("ThreeLineBreak", SeriesChartType.ThreeLineBreak)

        NumericUpDown1.Minimum = 0
        NumericUpDown1.Maximum = ChartSeriesTypeDict.Count - 1
        NumericUpDown1.Value = 0
        NumericUpDown1.Increment = 1
    End Sub

    Private Sub Chart1_DoubleClick(sender As Object, e As EventArgs) Handles Chart1.DoubleClick
        If Count = 0 Then Timer3.Stop()
        If Count = 1 Then Timer3.Start()
        Count = Count + 1
        If Count = 2 Then Count = 0
    End Sub

    Private Sub Timer1_Tick(sender As Object, e As EventArgs) Handles Timer1.Tick

        If Timer1IntervalChanger = 10 Then Timer1IntervalChanger = 0

        If Timer1IntervalChanger = 0 Then
            Timer1.Interval = Generate.Next(100, 2001)
        End If

        ListBox1.Items.Add(Generate.Next(-200, 201).ToString)
        ListBox1.SelectedIndex = ListBox1.Items.Count - 1

        Timer1IntervalChanger += 1

    End Sub

    Private Sub Timer2_Tick(sender As Object, e As EventArgs) Handles Timer2.Tick

        Label3.Text = ListBox1OldItemsCount.ToString
        ListBox1NewItemsCount = ListBox1.Items.Count
        Label4.Text = ListBox1NewItemsCount.ToString
        If ListBox1NewItemsCount > 1 Then
            If ListBox1OldItemsCount <> ListBox1NewItemsCount Then
                For i = ListBox1OldItemsCount To ListBox1NewItemsCount - 1
                    Chart1.Series("Example1").Points.AddY(CInt(ListBox1.Items.Item(i)))
                    For Each Point As DataPoint In Chart1.Series("Example1").Points
                        If Point.YValues(0) > 0 Then
                            Point.Color = Color.LimeGreen
                        ElseIf Point.YValues(0) < 0 Then
                            Point.Color = Color.Red
                        End If
                    Next
                Next
                ListBox1OldItemsCount = ListBox1NewItemsCount
            End If
        End If

        Timer2.Interval = Generate.Next(100, 3001)

    End Sub

    Private Sub Button1_Click(sender As Object, e As EventArgs) Handles Button1.Click
        Timer1.Stop()
        Timer2.Stop()
        Timer3.Stop()
    End Sub

    Private Sub Button2_Click(sender As Object, e As EventArgs) Handles Button2.Click
        Timer1.Start()
        Timer2.Start()
        Timer3.Start()
    End Sub

    Private Sub Timer3_Tick(sender As Object, e As EventArgs) Handles Timer3.Tick
        If Chart1HorizontalScroll = 0 Then
            If Chart1.ChartAreas(0).AxisX.Maximum > Chart1.ChartAreas(0).AxisX.ScaleView.Size Then
                Chart1.ChartAreas(0).AxisX.ScaleView.Scroll(Chart1.ChartAreas(0).AxisX.Maximum)
            End If
        End If
    End Sub

    Private Sub NumericUpDown1_ValueChanged(sender As Object, e As EventArgs) Handles NumericUpDown1.ValueChanged
        Try
            Chart1.Series("Example1").ChartType = ChartSeriesTypeDict.Values(CInt(NumericUpDown1.Value))
            Label6.Text = ChartSeriesTypeDict.Keys(CInt(NumericUpDown1.Value))
        Catch ex As Exception
        End Try
    End Sub

End Class
La vida loca
Thursday, May 28, 2015 6:56 AM
thank you for reply, actually the above giving error.
asad
Thursday, May 28, 2015 7:10 AM
thank you for reply, actually the above giving error.
asad
I expect an error will occur if the chart type used is not capable for the what the chart series does.
You do not provide what the error is. You do not provide the code you use.
Also the button  in the toolstrip at the top of a post being edited is used for inserting code into a code block for display in a post.
La vida loca