Metrics for Azure NetApp Files
Azure NetApp Files provides metrics on allocated storage, actual storage usage, volume IOPS, and latency. By analyzing these metrics, you can gain a better understanding on the usage pattern and volume performance of your NetApp accounts.
Ways to access metrics
Azure NetApp Files metrics are natively integrated into Azure monitor. From within the Azure portal, you can find metrics for Azure NetApp Files capacity pools and volumes from two locations:
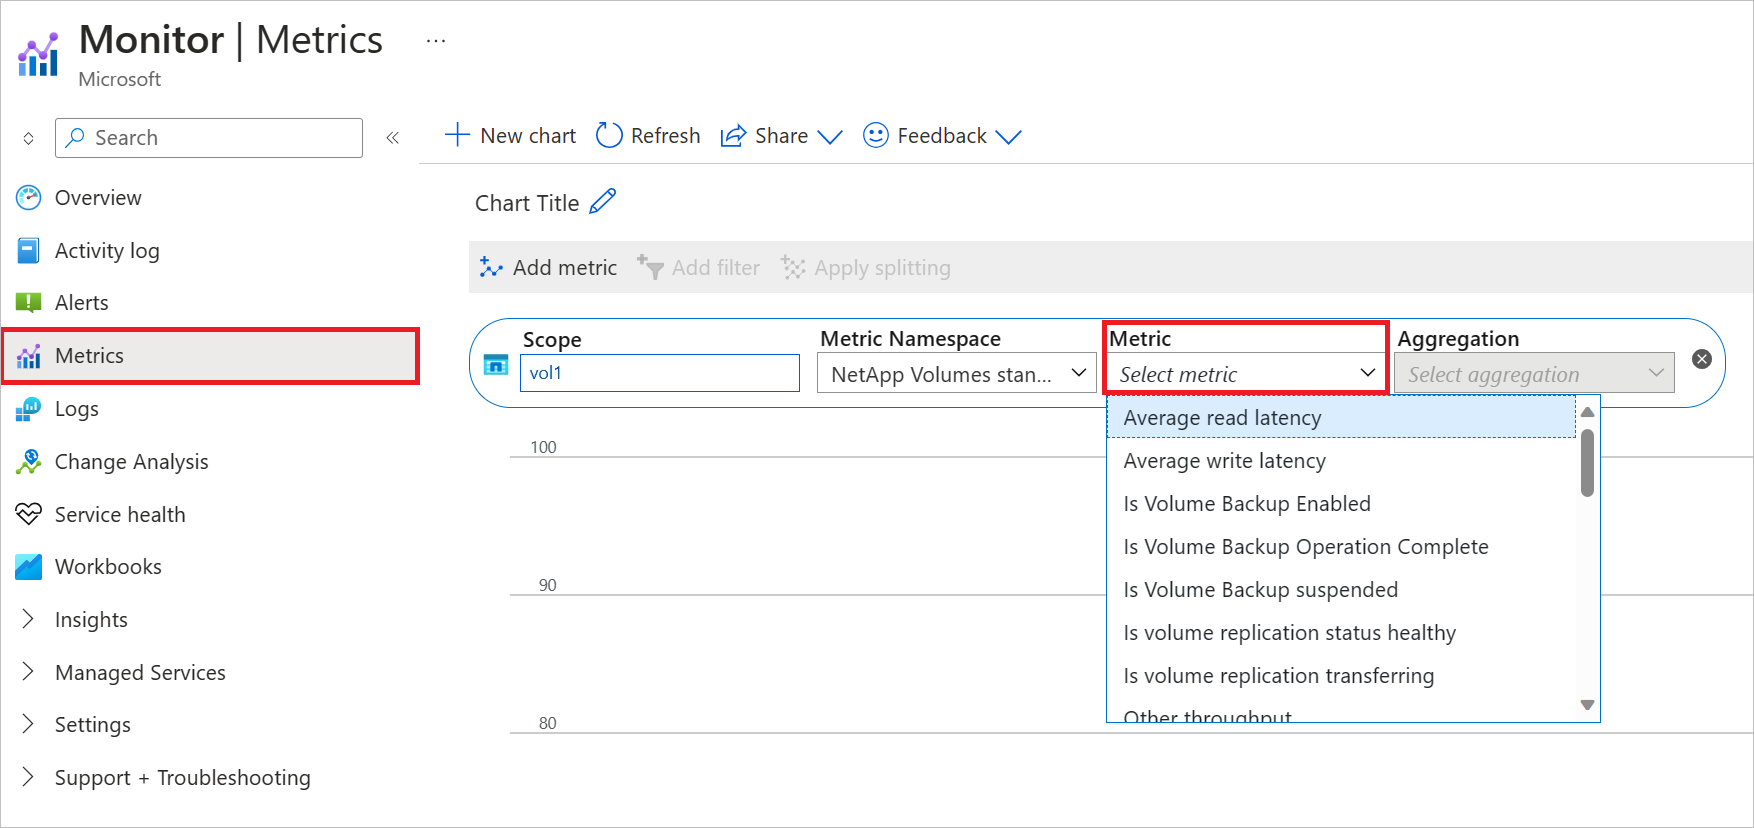
From Azure monitor, select Metrics, select a capacity pool or volume. Then select Metric to view the available metrics:
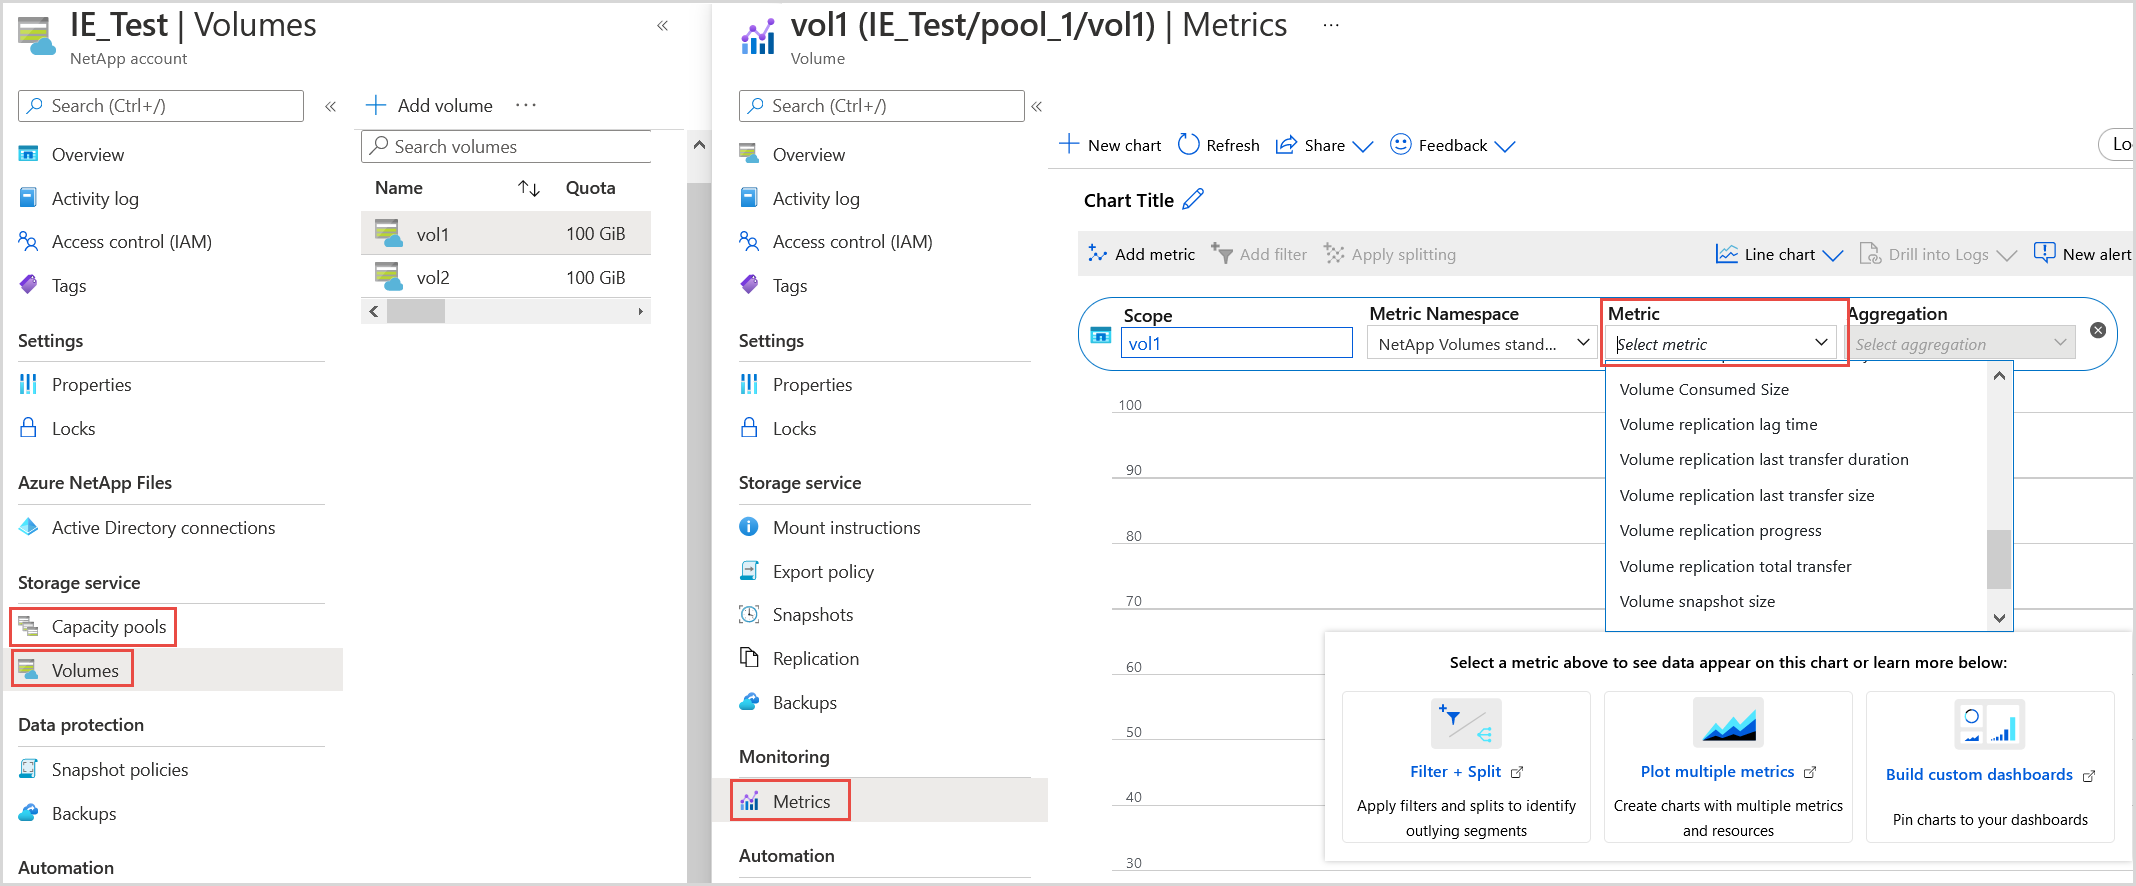
From the Azure NetApp Files capacity pool or volume, select Metrics. Then select Metric to view the available metrics:


Usage metrics for capacity pools
Pool Allocated Size
The provisioned size of the pool.Pool Allocated to Volume Size
The total of volume quota (GiB) in a given capacity pool (that is, the total of the volumes' provisioned sizes in the capacity pool).
This size is the size you selected during volume creation.Pool Consumed Size
The total of logical space (GiB) used across volumes in a capacity pool.Total Snapshot Size for the Pool
The sum of snapshot size from all volumes in the pool.
Usage metrics for volumes
Percentage Volume Consumed Size
The percentage of the volume consumed, including snapshots.
Aggregation metrics (for example, min, max) aren't supported for percentage volume consumed size.Volume Allocated Size
The provisioned size of a volumeVolume Quota Size
The quota size (GiB) the volume is provisioned with.Volume Consumed Size
Logical size of the volume (used bytes).
This size includes logical space used by active file systems and snapshots.Volume Snapshot Size
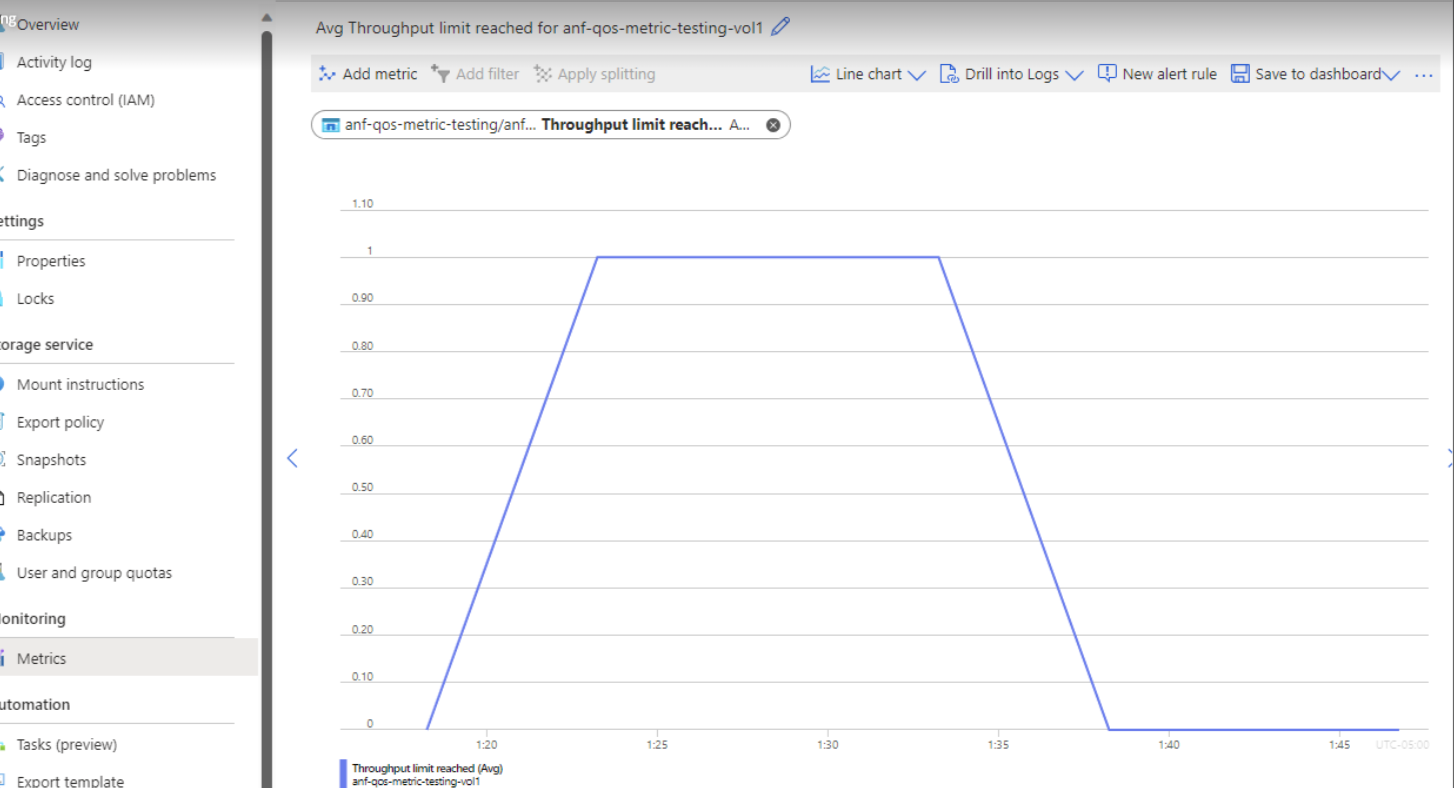
The size of all snapshots in a volume.Throughput limit reached
Throughput limit reached is a boolean metric that denotes the volume is hitting its QoS limits. The value 1 means that the volume has reached its maximum throughput, and throughput for this volume will be throttled. The value 0 means this limit hasn't yet been reached.
Note
The Throughput limit reached metrics is collected every 5 minutes and is displayed as a hit if it has been collected in the last 5 minutes.
If the volume is hitting the throughput limit, it's not sized appropriately for the application's demands. To resolve throughput issues:
Resize the volume:
Increase the volume size to allocate more throughput to the volume so it's not throttled.
Modify the service level:
The Premium and Ultra service levels in Azure NetApp Files cater to workloads with higher throughput requirements. Moving the volume to a capacity pool in a higher service level automatically increases these limits for the volume.
Change the workloads/application:
Consider repurposing the volume and delegating a different volume with a larger size and/or in a higher service level to meet your application requirements. If it's an NFS volume, consider changing mount options to reduce data flow if your application supports those changes.

Performance metrics for volumes
Note
Volume latency for Average Read Latency and Average Write Latency is measured within the storage service and does not include network latency.
- Average Read Latency
The average time for reads from the volume in milliseconds. - Average Write Latency
The average time for writes from the volume in milliseconds. - Read IOPS
The number of reads to the volume per second. - Write IOPS
The number of writes to the volume per second.
Volume replication metrics
Note
- Network transfer size (for example, the Volume replication total transfer metrics) might differ from the source or destination volumes of a cross-region replication. This behavior is a result of efficient replication engine being used to minimize the network transfer cost.
- Volume replication metrics are currently populated for replication destination volumes and not the source of the replication relationship.
Is volume replication status healthy
The condition of the replication relationship. A healthy state is denoted by1. An unhealthy state is denoted by0.Is volume replication transferring
Whether the status of the volume replication is ‘transferring’.Volume replication lag time
Lag time is the actual amount of time the replication lags behind the source. It indicates the age of the replicated data in the destination volume relative to the source volume.
Note
When assessing the health status of the volume replication, consider the volume replication lag time. If the lag time is greater than the replication schedule, the replication volume will not catch up to the source. To resolve this issue, adjust the replication speed or the replication schedule.
Volume replication last transfer duration
The amount of time in seconds it took for the last transfer to complete.Volume replication last transfer size
The total number of bytes transferred as part of the last transfer.Volume replication progress
The total amount of data transferred for the current transfer operation.Volume replication total transfer
The cumulative bytes transferred for the relationship.
Throughput metrics for capacity pools
Pool allocated throughput
Sum of the throughput of all the volumes belonging to the pool.Provisioned throughput for the pool
Provisioned throughput of this pool.
Throughput metrics for volumes
Read throughput
Read throughput in bytes per second.Total throughput
Sum of all throughput in bytes per second.Write throughput
Write throughput in bytes per second.Other throughput
Other throughput (that isn't read or write) in bytes per second.
Volume backup metrics
Is Volume Backup Enabled
Shows whether backup is enabled for the volume.1is enabled.0is disabled.Is Volume Backup Operation Complete
Shows whether the last volume backup or restore operation is successfully completed.1is successful.0is unsuccessful.Is Volume Backup Suspended
Shows whether the backup policy is suspended for the volume.1isn't suspended.0is suspended.Volume Backup Bytes
The total bytes backed up for this volume.Volume Backup Last Transferred Bytes
The total bytes transferred for the last backup or restore operation.Volume Backup Operation Last Transferred Bytes
Total bytes transferred for last backup operation.Volume Backup Restore Operation Last Transferred Bytes
Total bytes transferred for last backup restore operation.
Cool access metrics
Volume cool tier size
Volume footprint for the cool tier.Volume cool tier data read size
Data read in usingGETper volume.Volume cool tier data write size
Data tiered out usingPUTper volume.
Next steps
משוב
בקרוב: במהלך 2024, נפתור בעיות GitHub כמנגנון המשוב לתוכן ונחליף אותו במערכת משוב חדשה. לקבלת מידע נוסף, ראה: https://aka.ms/ContentUserFeedback.
שלח והצג משוב עבור