הערה
גישה לעמוד זה דורשת אישור. אתה יכול לנסות להיכנס או לשנות תיקיות.
גישה לעמוד זה דורשת אישור. אתה יכול לנסות לשנות מדריכים.
In this tutorial, you deploy WebLogic Server (WLS) on Azure Virtual Machines (VMs) and integrate with Elastic Cloud (Elasticsearch). You also configure Elastic Custom Logs to capture log data from WLS. Finally, you use Kibana to search and analyze WLS logs. While each component is documented individually, this tutorial demonstrates how they integrate seamlessly to provide a robust log management solution for WLS on Azure.

In this tutorial, you learn how to:
- Create an Elastic on Azure instance.
- Deploy WLS on Azure.
- Configure Elastic Custom Logs to integrate WLS logs.
- Search WebLogic Server logs from Kibana.
Prerequisites
- An active Azure subscription. If you don't have an Azure subscription, create a free account.
- The ability to deploy one of the WLS on Virtual Machines Azure Applications listed at What are solutions for running Oracle WebLogic Server on Azure Virtual Machines?
- A terminal for SSH access to virtual machines.
Deploy WLS on Azure
Provision WebLogic Server by following the steps in What are solutions for running Oracle WebLogic Server on Azure Virtual Machines? Both "Deploy Oracle WebLogic Server With Administration Server on a Single Node" and "Deploy Oracle WebLogic Server Cluster on Microsoft Azure IaaS" are compatible with Elastic on Azure. This tutorial uses WebLogic on VM as an example.
Note
The default VM size might not have sufficient memory for the Elastic agent. Ensure that the selected VM size has at least 2.5 GB of memory. Standard_A2_v2 is the minimum sufficient size
After filling in the required information, select Create to initiate the WLS deployment on Azure. The deployment typically takes about 30 minutes. After deployment, go to Outputs and record the value of adminConsoleURL, which is the URL for accessing the Administration Console.
Understand WebLogic logs
WebLogic Server subsystems use logging services to track events such as application deployment and subsystem failures. These logs enable server instances to communicate their status and respond to specific events, providing detailed insights that can help in troubleshooting and monitoring. WebLogic's logging services enable you to report errors, listen for log messages from particular subsystems, and capture system status updates. For more detailed information on WebLogic logging services, see Understanding WebLogic Logging Services.
This tutorial focuses on configuring the following key WebLogic logs:
Server Log Files: Typically found in the logs directory beneath the server instance's root. The path is usually as DOMAIN_NAME/servers/SERVER_NAME/logs/SERVER_NAME.log.
Domain Log Files: These logs provide an overview of domain status and are stored in the Administration Server's logs directory. The default path is DOMAIN_NAME/servers/ADMIN_SERVER_NAME/logs/DOMAIN_NAME.log.
HTTP Access Logs: By default, HTTP access logs share the server log's directory and rotation policy. The default path is DOMAIN_NAME/servers/SERVER_NAME/logs/1access.log.
You can configure and manage these logs to facilitate the integration with monitoring tools like Elastic on Azure, enabling centralized log analysis and alerting on WebLogic Server instances.
While the offer deploys, you can skip to and follow the steps in the section Create an Elasticsearch on Azure instance. Return here when the offer is finished deploying.
Connect to the WLS machine
To access the virtual machine running WebLogic Server (WLS), use the steps in Connect to the virtual machine. In this tutorial, you're connecting to the machine that hosts the WebLogic Administration Server, named adminVM.
Create an Elasticsearch on Azure instance
Elastic Cloud (Elasticsearch) for Azure is an Azure Native ISV Services you can get from Azure Marketplace and deploy with the Azure portal. Azure Native ISV Services enable you to easily provision, manage, and tightly integrate independent software vendor (ISV) software and services on Azure. Elastic Cloud - Azure Native ISV Service is developed and managed by Microsoft and Elastic. You create, provision, and manage Elastic resources through the Azure portal. Elastic owns and runs the SaaS application including the Elastic accounts created. For an overview of Elastic Cloud (Elasticsearch) see What is Elastic Cloud (Elasticsearch) - An Azure Native ISV Service?
Create Elastic on Azure
To create an Elastic application, follow the steps in QuickStart: Get started with Elastic.
In the first step of the section Create resource, use the following steps for substitutions:
In the Basics pane, under Plan Details, use the following steps:
- For Resource group, fill in a unique resource group name. This tutorial uses
elkrg1030. - For Resource name, fill in a unique name for your Elastic instance. You can use the same value you used for Resource group.
- For Region, select your desired region.
- Keep the default values for other fields.
- For Resource group, fill in a unique resource group name. This tutorial uses
In the Logs & metrics pane, select Send subscription activity logs and Send Azure resource logs for all defined resources to monitor the Azure resources. However, this tutorial focuses solely on WLS logs and doesn't cover infrastructure logs.
You can skip the sections Azure OpenAI configuration and Tags.
Follow the remaining steps in the article.
After the deployment succeeds, continue to the next section in this article.
Launch Kibana
After Elastic is deployed on Azure, open the Elastic resource from the Azure portal. Locate the Kibana URL, next to the label Deployment URL, as shown in the following screenshot:

When you launch Kibana, you're prompted to sign in by selecting an Azure account. Choose the Azure account used for creating the Elastic deployment, then review and accept the requested Elasticsearch permissions.

After you're signed in, the browser navigates to Kibana's welcome page, as shown in the following screenshot:

Configure Elastic Custom Logs and Integrate WLS Logs
Use the following steps to set up custom log integration for WebLogic Server on Kibana:
Use the following steps to navigate to Kibana's integration setup:
On the Kibana welcome page, find Get started by adding integrations and then select Add integrations.
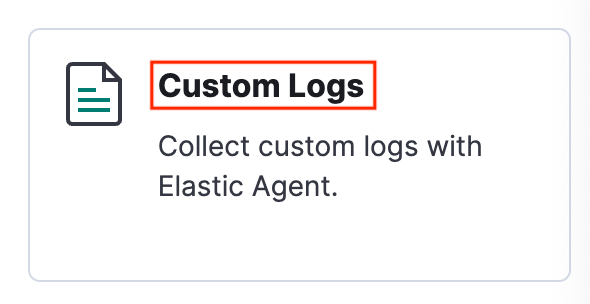
Search for Custom Logs and then select it.
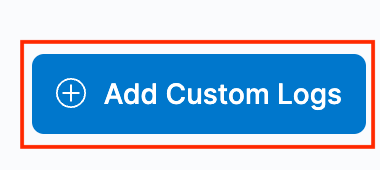
Select Add Custom Logs to view instructions for installing the Elastic Agent and adding integrations.
Use the following steps to install the Elastic Agent:
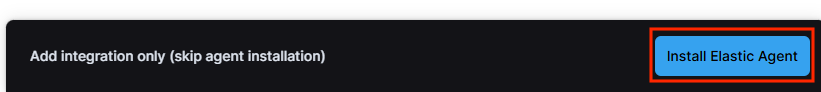
Select Install Elastic Agent, which brings up the steps for installation.
SSH into the WLS machine and then switch to root privileges by using the following command:
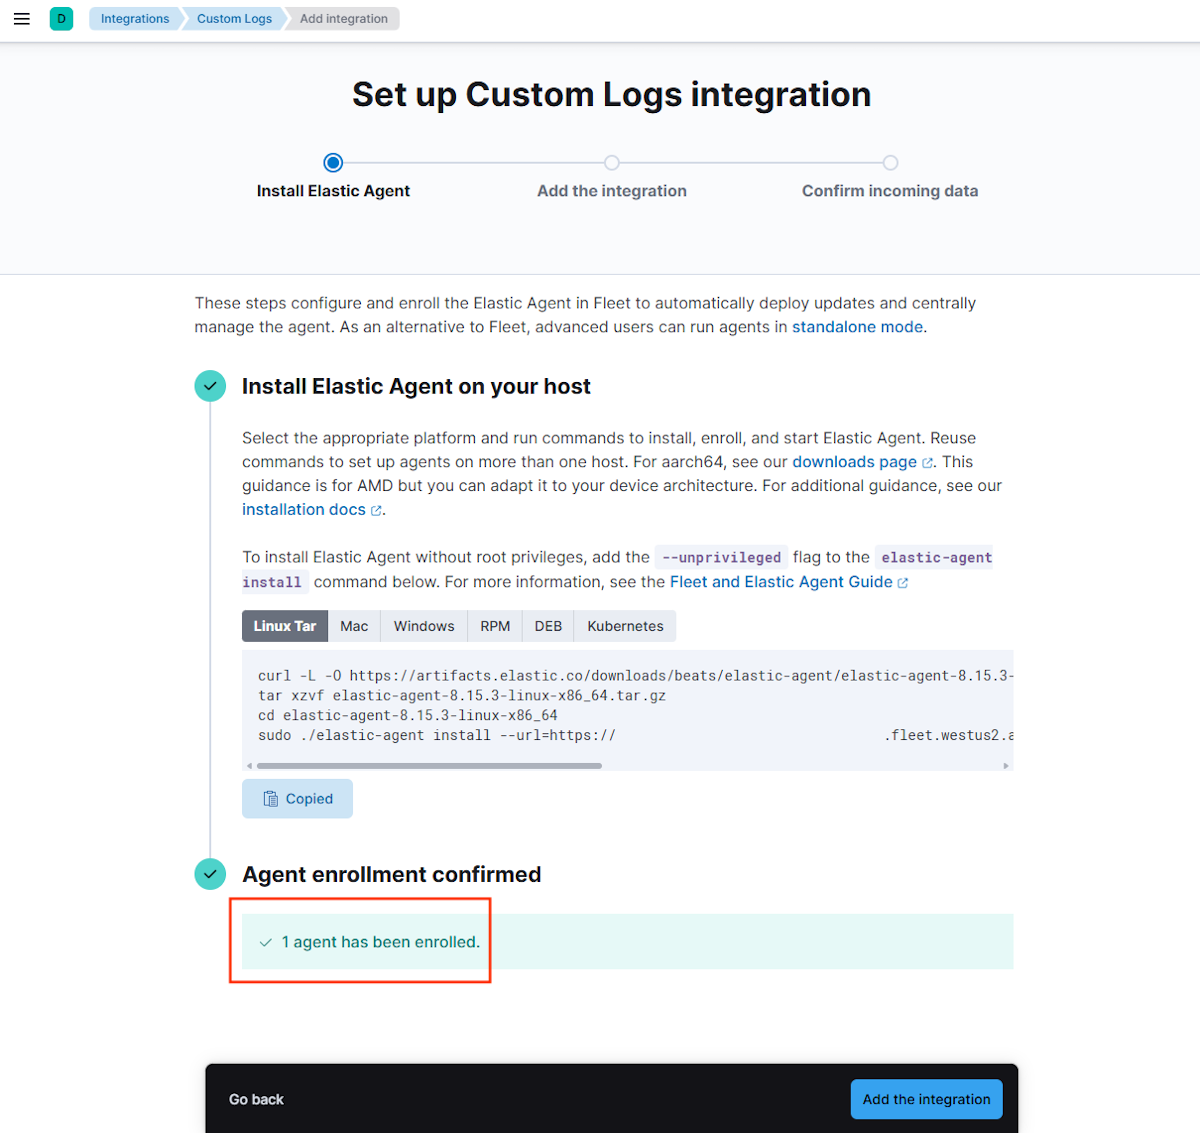
sudo su -From Kibana, copy the Linux Tar command from the Install Elastic Agent on your host section and execute it on the WLS machine.
In the machine terminal, confirm the installation by entering y when prompted, as shown in the following example:
Elastic Agent will be installed at /opt/Elastic/Agent and will run as a service. Do you want to continue? [Y/n]:yLook for the text
Elastic Agent has been successfully installed.This text indicates a successful installation. If you don't see this text, troubleshoot and resolve the problem before continuing.
Verify agent enrollment. In Kibana, confirm Agent enrollment under Confirm agent enrollment.
Use the following steps to add the integration for WLS domain logs:
Select Add the integration.
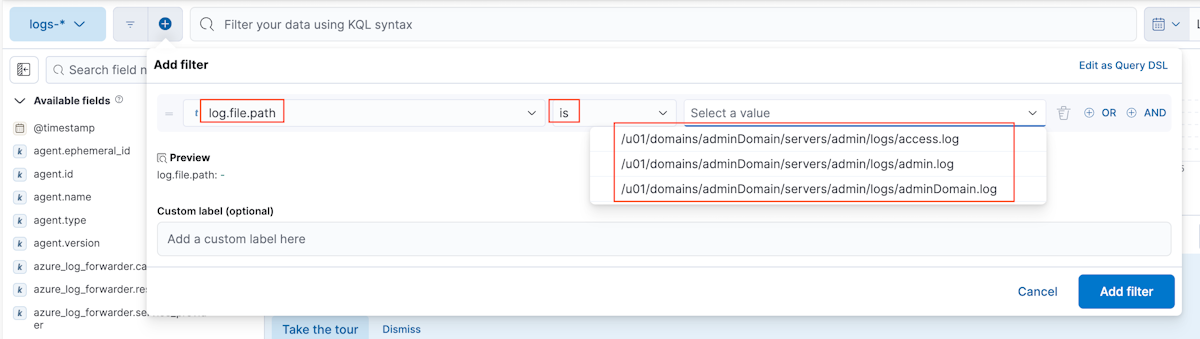
Under Custom log file, set the following properties:
- For Log file path, use /u01/domains/adminDomain/servers/admin/logs/adminDomain.log.
- For Dataset name, use generic.
Expand Advanced options. For Custom configurations, set the following properties:
- For multiline.type, use pattern.
- For multiline.pattern, use '^####'.
- For multiline.negate, use true.
- For multiline.match, use after.
Expand Advanced options. For Integration name, fill in log-weblogic-domain-log.
Select Confirm incoming data to preview the logs. Then, select View assets -> Assets -> Views -> Logs to view the domain logs in Kibana.
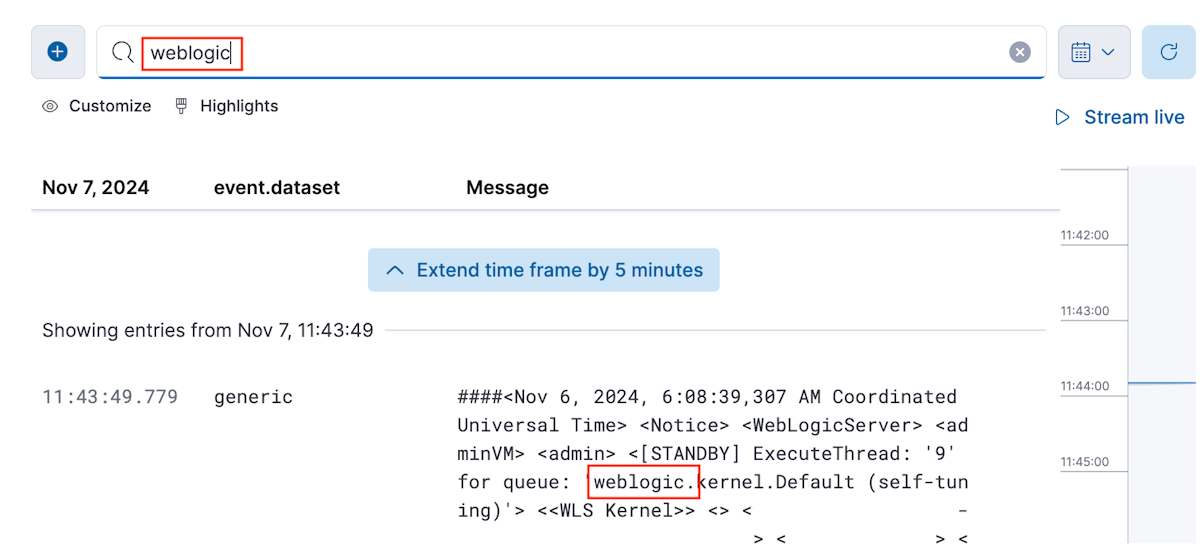
In the textarea containing the text Search for log messages, enter the string weblogic and press Enter. You should see log messages containing the string weblogic.
Use the following steps to add integrations for server logs and HTTP access logs:
In Kibana, search for Integrations and then select it.
Select Installed integrations > Custom Logs > Add Custom Logs.
Enter the appropriate configurations from the following lists for each log type - server, and HTTP access logs. After filling out all configuration fields, select Save and continue then Save and deploy changes.
For server log, use the following values:
For Integration settings > Integration name, use log-weblogic-server-log.
For Custom log file > Log file path, use /u01/domains/adminDomain/servers/admin/logs/admin.log.
For Custom log file > Advanced options > Custom configurations, use the following values:
- For multiline.type, use pattern.
- For multiline.pattern, use '^####'.
- For multiline.negate, use true.
- For multiline.match, use after.
For Where to add this integration? > Existing hosts, use My first agent policy.
For HTTP access logs, use the following values:
- For Integration settings > Integration name, use log-http-access-log.
- For Custom log file > Log file path, use /u01/domains/adminDomain/servers/admin/logs/access.log.
- For Custom log file > Advanced options > Custom configurations, no configuration is provided.
- For Where to add this integration? > Existing hosts, use My first agent policy.


Search WLS Logs in Kibana
After integrating, use the following steps to begin analyzing the logs within Kibana:
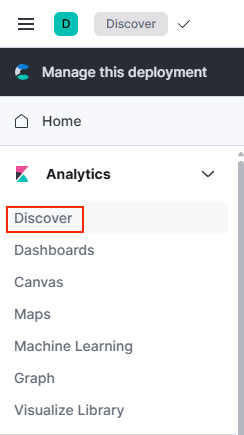
To access the Discover page, open the hamburger menu. Then, under Analytics, select Discover.
To select the log index, in the Discover page, select logs-*.
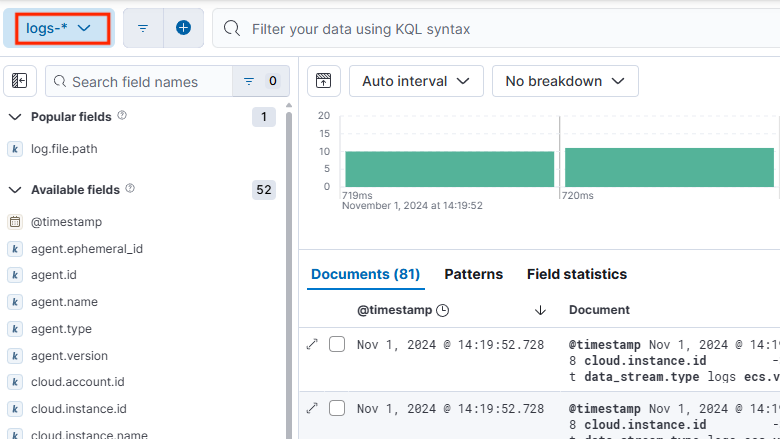
Search and filter the WLS logs. For more information on using Discover, see Discover in the Kibana documentation.


Note
If you're running a WLS cluster, you need to install the Elastic Agent on each VM and configure custom logs on the corresponding hosts.
Clean up resources
If you're no longer using the WLS or Elastic stack, you can clean them up by following the steps in this section.
Clean up WLS
Use the following steps to clean up WLS:
On the Azure portal home page, select Resource groups.
In the Filter for any field... text field, enter the name of the resource group in which you created the WLS deployment.
When the list displays your resource group, select it.
From the Resource group overview, select Delete resource group.
In the Are you sure you want to delete section, type the name of the resource group and then select Delete. You can continue to work with the Azure portal while the resource group and its contents are deleted.
Clean up Elastic on Azure
Follow the same steps as in the preceding section to delete Elastic on Azure, but use the resource group name of the Elastic on Azure deployment as the resource group to delete.
Next step
Continue your migration journey by exploring WebLogic Server to Azure Virtual Machines.