Access data through Excel
Azure DevOps Services | Azure DevOps Server 2022 - Azure DevOps Server 2019
You can access data through Excel, generate reports, and then publish the charts to Power BI or use the Excel file as a basis for Power BI reports. At this time, you need alternate credentials enabled to access data Analytics via Excel.
Note
The Analytics service is automatically enabled and supported in production for all Azure DevOps Services. Power BI integration and access to the OData feed of the Analytics Service are generally available. We encourage you to use it and give us feedback.
Available data is version-dependent. The latest supported version is v2.0, and the latest preview version is v4.0-preview. For more information, see OData API versioning.
Note
The Analytics service is automatically installed and supported in production for all new project collections for Azure DevOps Server 2020 and later versions. Power BI integration and access to the OData feed of the Analytics Service are generally available. We encourage you to use it and give us feedback. If you upgraded from Azure DevOps Server 2019, then you can install the Analytics service during upgrade.
Available data is version-dependent. The latest supported version is v2.0, and the latest preview version is v4.0-preview. For more information, see OData API versioning.
Note
The Analytics service is in preview for Azure DevOps Server 2019. You can enable or install it for a project collection. Power BI integration and access to the OData feed of the Analytics Service are in Preview. We encourage you to use it and give us feedback.
Available data is version-dependent. The latest supported version is v2.0, and the latest preview version is v4.0-preview. For more information, see OData API versioning.
Open Excel 2016 or later, including Excel for Microsoft 365.
If you're using an earlier version of Excel, install the Power Query add-in from Microsoft Power Query for Excel.
Create a blank workbook.
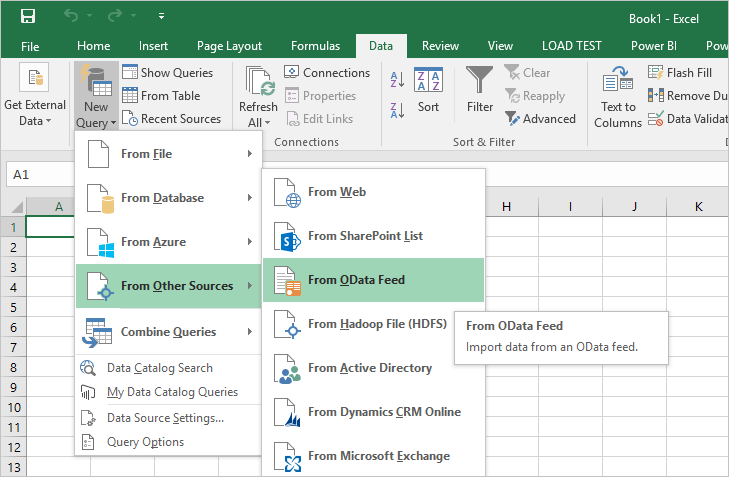
In the Data tab, select New Query > From Other Sources > From OData Feed.
Enter the URL in the following format and select OK:
https://analytics.dev.azure.com/{Organization_Name}/_odata/{version}/If the OrganizationName is fabrikam and the version is v1.0, then the URL is
https://analytics.dev.azure.com/fabrikam/_odata/v1.0/.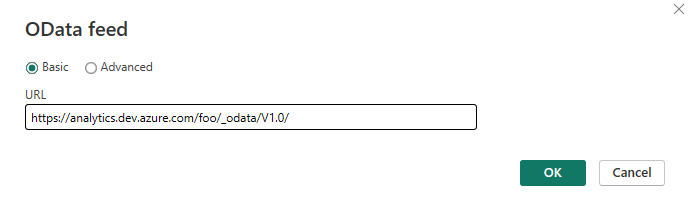
Note
Alternatively, you can enter the URL with the ProjectName specified which trims the results by the specified project across all entities related to that project.
https://analytics.dev.azure.com/{OrganizationName}/{ProjectName}/_odata/{version}/https://{ServerName}:{Port}/tfs/{CollectionName}/_odata/{version}/If the CollectionName is fabrikam and the version is v1.0, then the URL is
https://{ServerName}:{Port}/tfs/fabrikam/_odata/{v1.0}/.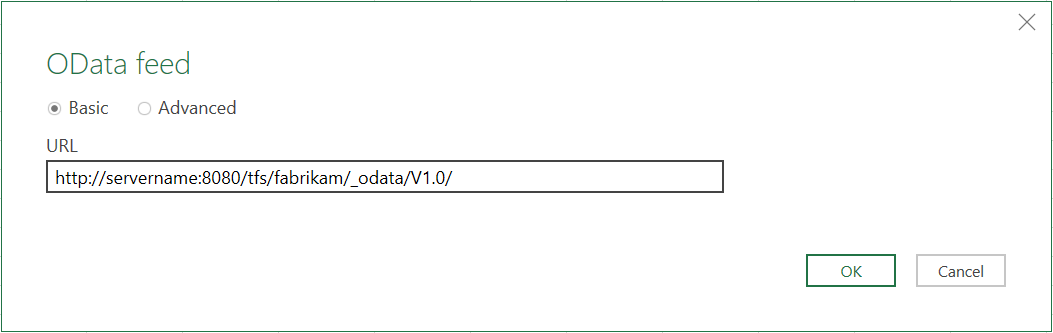
Note
Alternatively, you can enter the URL with the ProjectName specified which trims the results by the specified project across all entities related to that project.
https://{ServerName}:{Port}/tfs/{CollectionName}/{ProjectName}/_odata/{version}/You're prompted to authenticate against the service. If you haven't already, see Client authentication options.
Either select a single entity to retrieve the data for or check Select multiple items and choose the data to return.
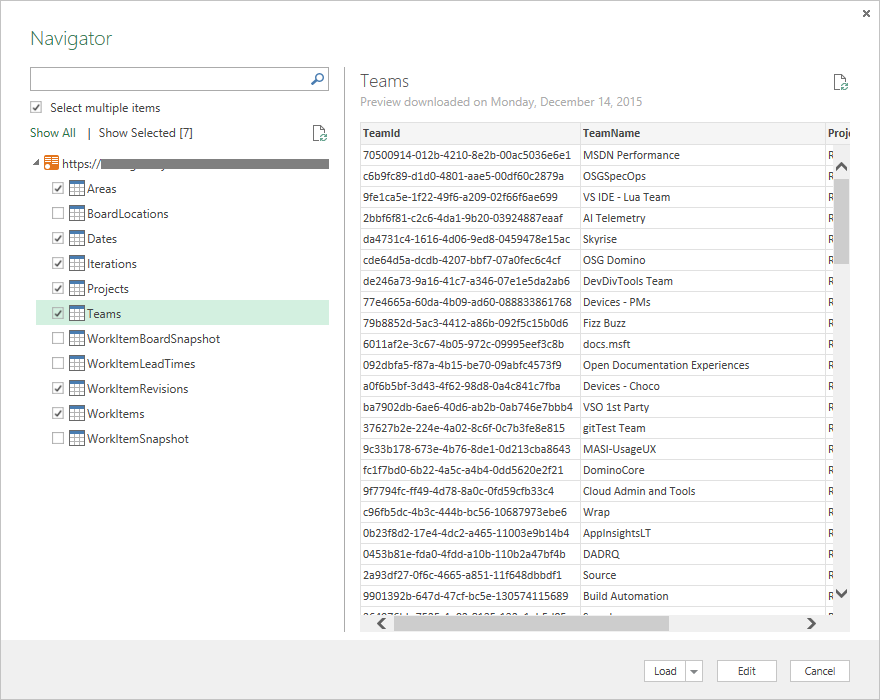
At this point, if you select Load, Excel loads all the data in each entity into Power Query. But, it might be more data than you need or more than Excel can handle.
Do the following steps to filter the data:
- Select the entity you want to filter and choose Edit to open the Query Editor.
- For each column you want to filter, select the column and set your filter criteria.
- Once you apply all necessary filters, select Close & Apply in the upper left corner.
This action loads only the filtered data into Power Query, making it more manageable and relevant to your needs.
Important
Do not select any entity with the name Snapshot in it. These entities contain the state of every work item for every day since each work item was created. For repositories of any size, this leads to tens or hundreds of millions of work items, which doesn't load correctly. To perform trend analysis, narrow the scope of data being retrieved to specific items and time frames, and pull this information in with a separate OData query.
As an alternative to loading the data into Power Query, you can choose the drop-down arrow next to Load and select Load To. This action provides the following options:
- Load the data to a table in Power Query
- Create a connection without loading the data, deferring the data load until later
- Load the data to a worksheet, which loads one entity per worksheet
- Load the data to a model, which you can select with the other options, to load the data into PowerPivot
For more information, see the Excel documentation.
Handling relationships
By default, when basic data is returned from Analytics, the data is related as shown in the following figure:

The Tags, Teams, and Users aren't related to any of the other data due to the nature of their relationships. These entities are either connected by many-to-many relationships, which are challenging to handle in these models, or by multiple relationships between entities. For example, users and work items are related through fields like Assigned To, Created By, and Changed By.
Handling multiple relationships can be done fairly simply. For example, in the default model, you can edit the query, select the AssignedTo column of the WorkItems table, and expand the column to include all data from the Users table. Repeat this process for the CreatedBy and ChangedBy columns as well. This approach avoids having multiple links from one table to another, which isn't allowed.