Packet core dashboards
The packet core dashboards provide a flexible way to monitor key statistics relating to your deployment in real time. They also allow you to view information on firing alerts, allowing you to quickly react to emerging issues.
The packet core dashboards are powered by Grafana, an open-source, metric analytics and visualization suite. For more information, see the Grafana documentation.
Access the packet core dashboards
Tip
When signing in, if you see a warning in your browser that the connection isn't secure, you might be using a self-signed certificate to attest access to your local monitoring tools. We recommend following Modify the local access configuration in a site to configure a custom HTTPS certificate signed by a globally known and trusted certificate authority.
Microsoft Entra ID
To sign in to the packet core dashboards if you enabled Microsoft Entra authentication:
- In your browser, enter https://<local monitoring domain>/grafana, where <local monitoring domain> is the domain name for your local monitoring tools that you set up in Configure domain system name (DNS) for local monitoring IP.
- Follow the prompts to sign in with your account credentials.
Local username and password
To sign in to the packet core dashboards if you enabled local username and password authentication:
In your browser, enter https://<local monitoring IP>/grafana, where <local monitoring IP> is the IP address for accessing the local monitoring tools that you set up in Management network.
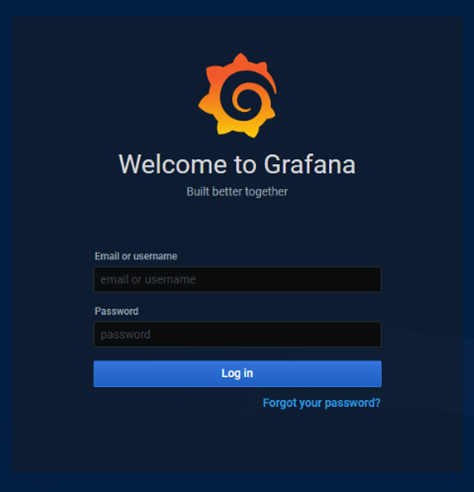
Sign in using your credentials.
If you're accessing the packet core dashboards for the first time after installing or upgrading the packet core instance, you should fill in the fields with the default username and password. Afterwards, follow the prompts to set up a new password that you will use from the next time you sign in.
- Email or username: admin
- Password: admin
Once you're signed in to the packet core dashboards, you can hover over your user icon in the left pane to access the options to sign out or change your password.
Use the packet core dashboards
We'll go through the common concepts and operations you'll need to understand before you can use the packet core dashboards. If you need more information on using Grafana, see the Grafana documentation.
Dashboards
You can access the following packet core dashboards:
Tip
Some packet core dashboards display different panels depending on whether the packet core instance supports 5G, 4G, or combined 4G and 5G user equipment (UEs).
The Overview dashboard displays important key performance indicators (KPIs), including the number of connected devices, throughput, and any alerts firing in the system.
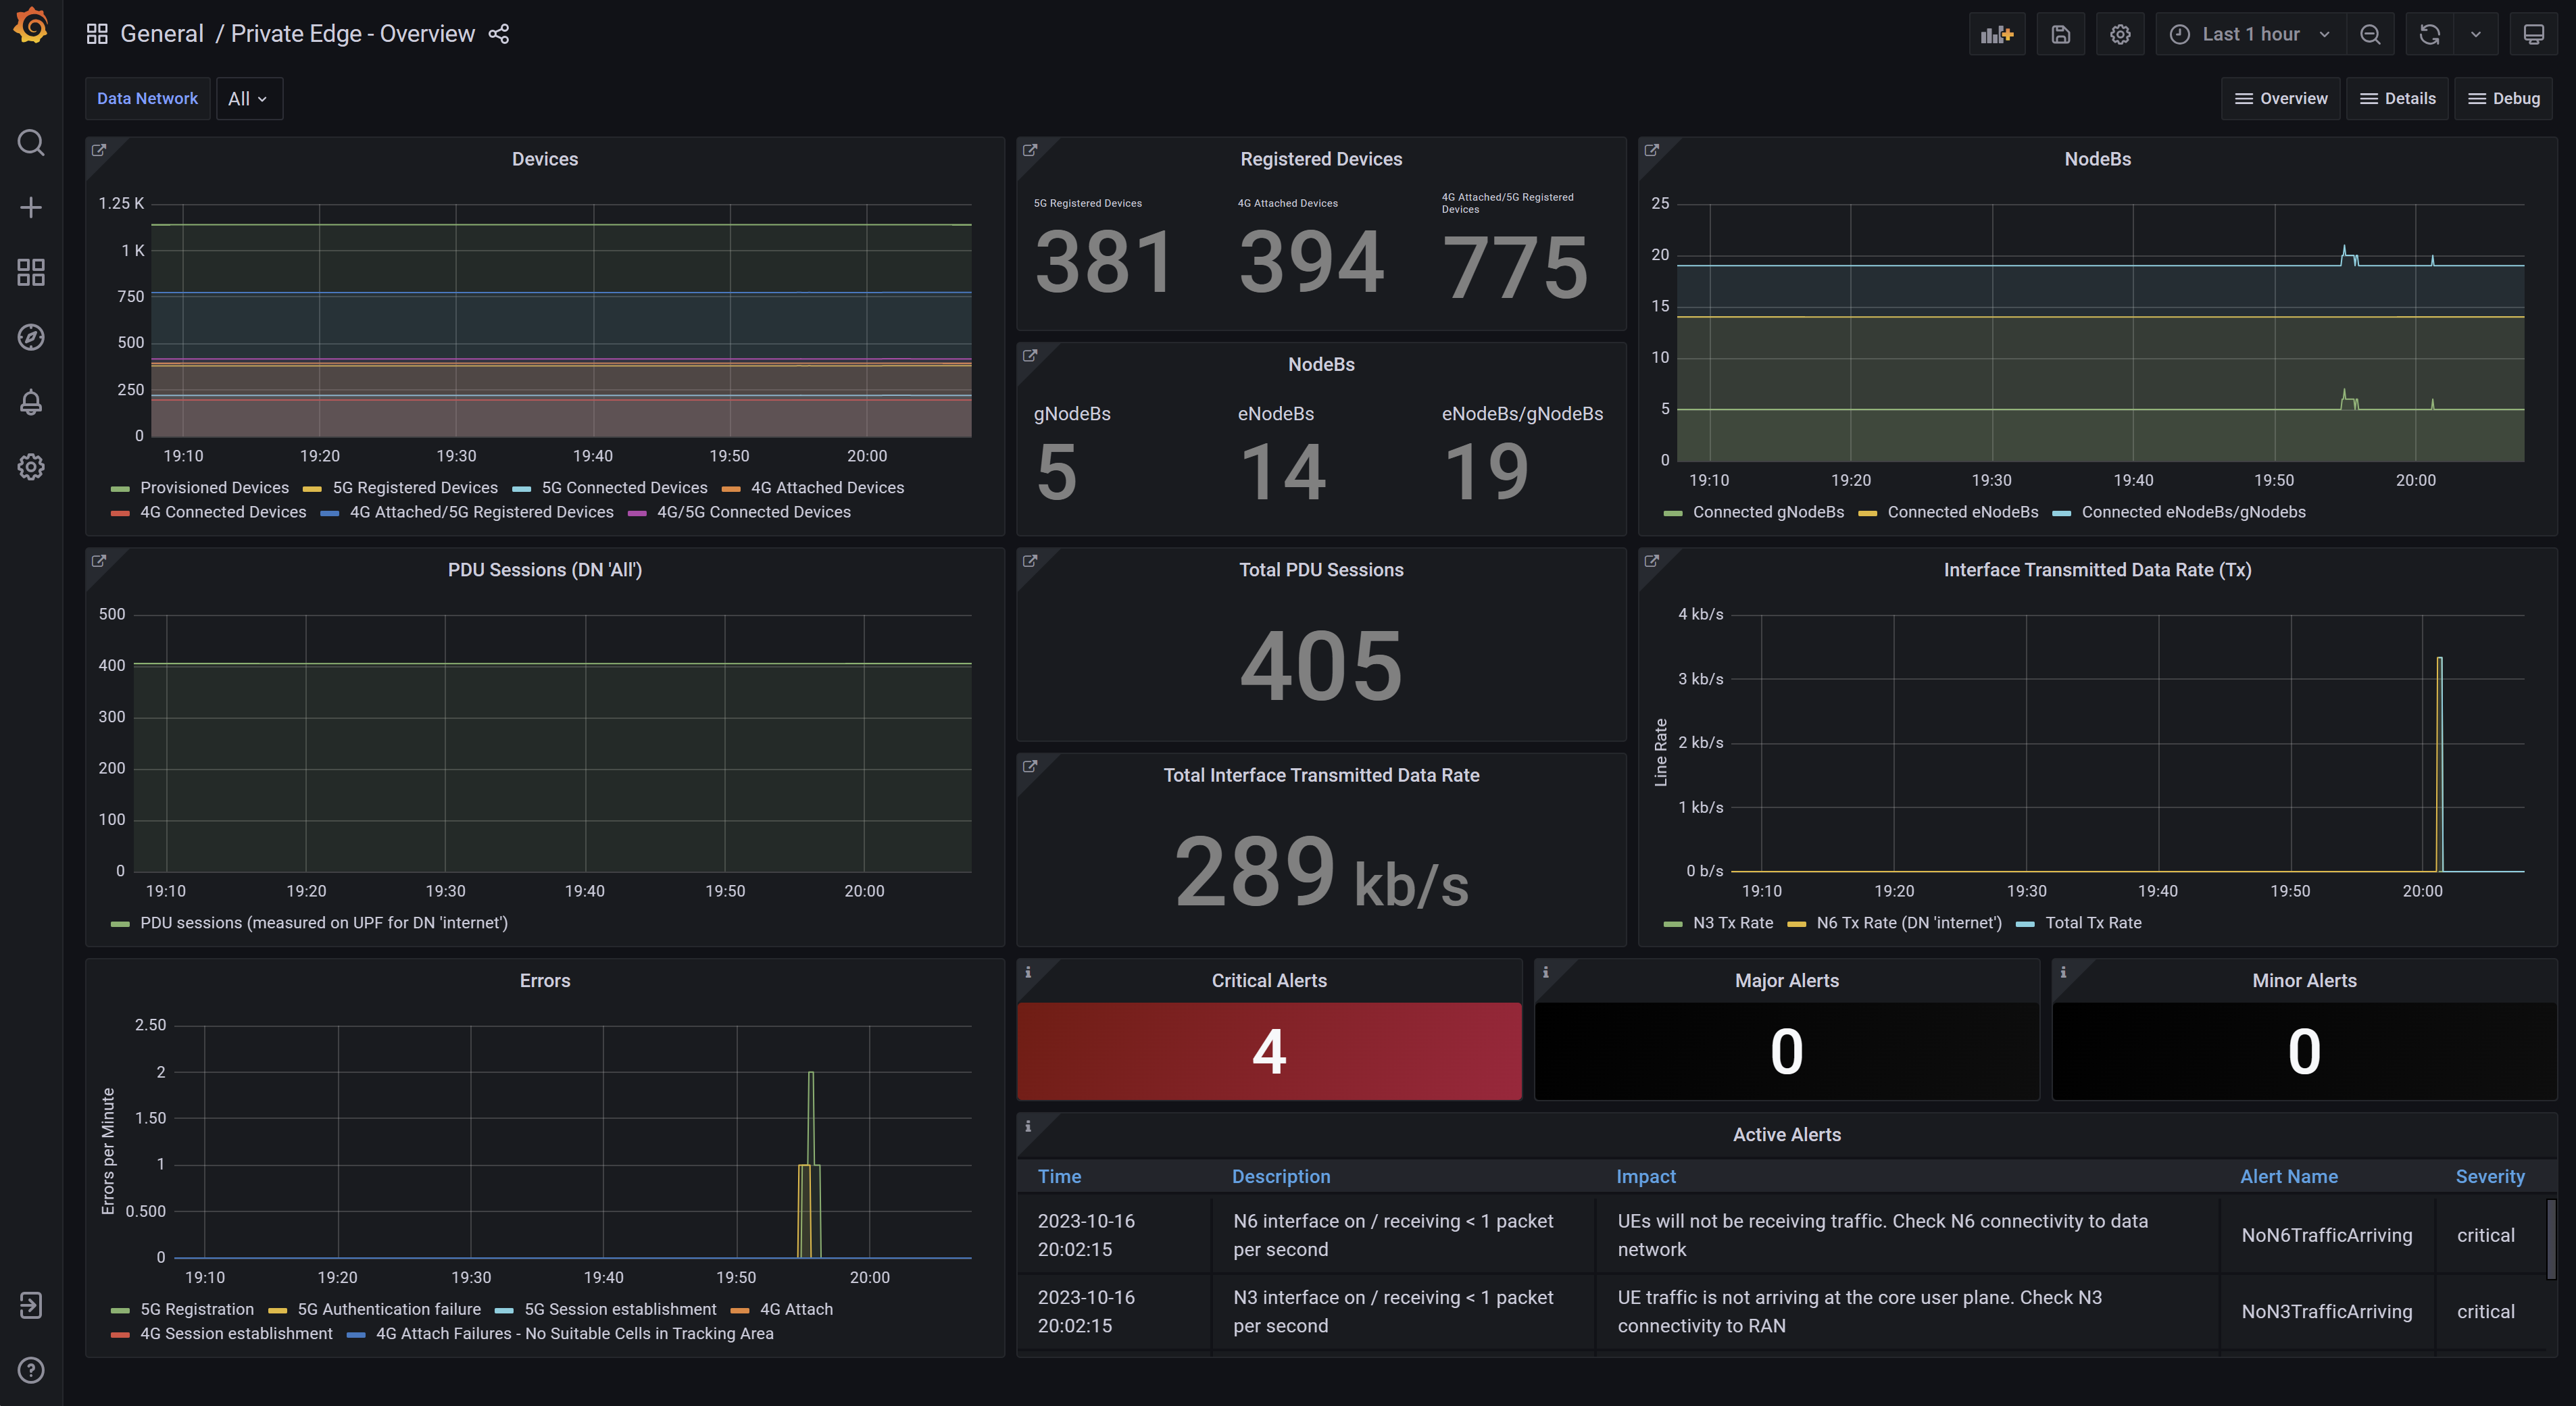
If you have configured 4G and 5G on a single packet core, the Overview dashboard displays 4G and 5G KPIs individually and combined.
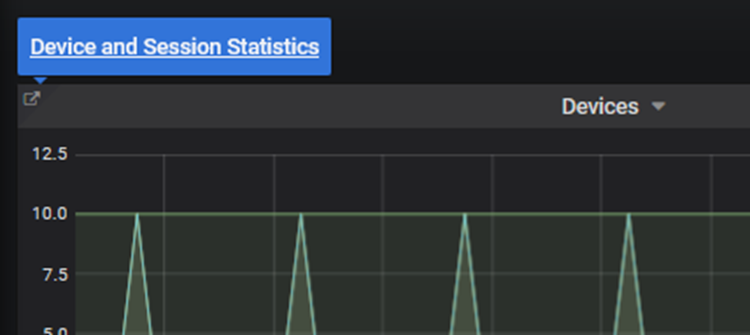
Each panel on the overview dashboard links to another dashboard with detailed statistics about the KPI shown. You can access the link by hovering your cursor over the upper-left corner of the panel. You can then select the link in the pop-up.
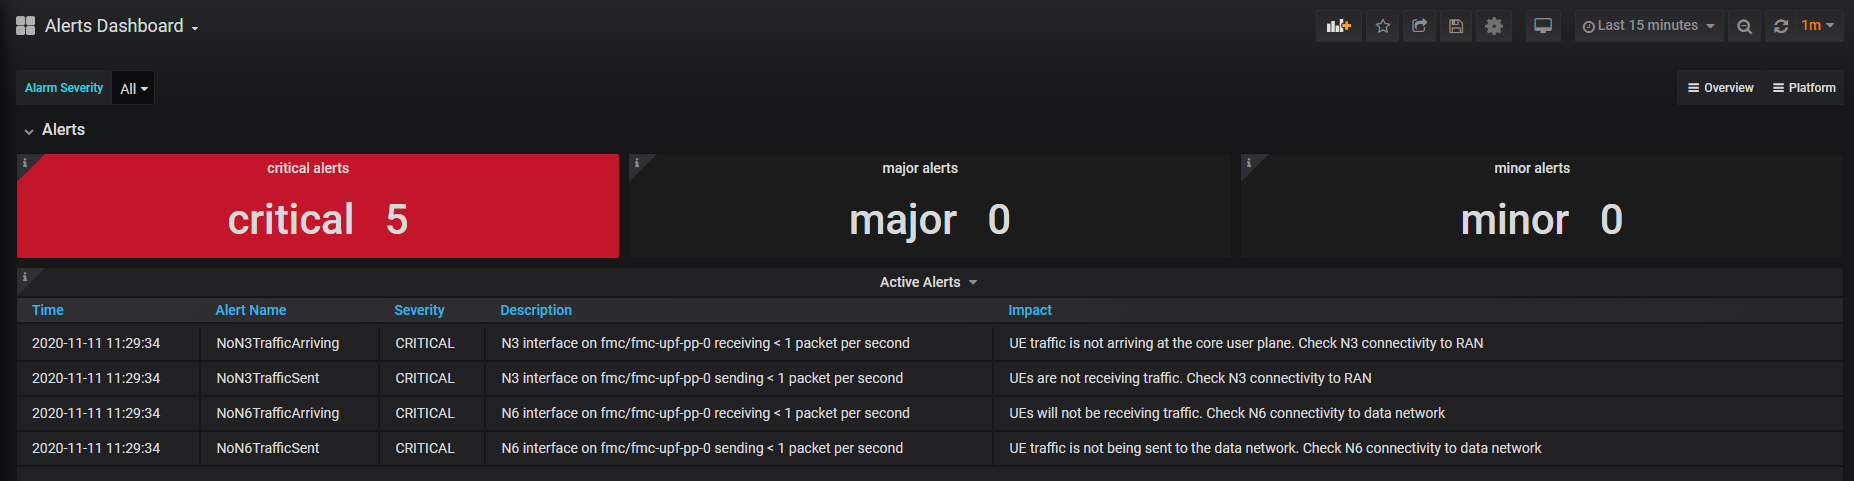
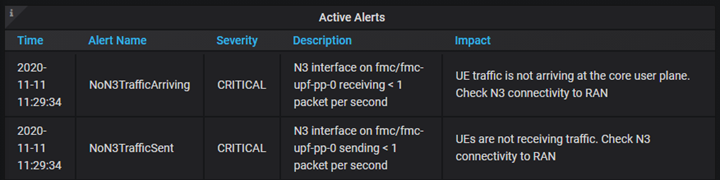
The Alerts dashboard provides descriptions and information on the severity and effect of each currently firing alert. The Alarm Severity selector in the upper-left hand corner of the Alerts dashboard allows you to filter out alerts of certain severity levels.
The Device and Session Statistics dashboard provides information about the device and session procedures being processed by the packet core instance.

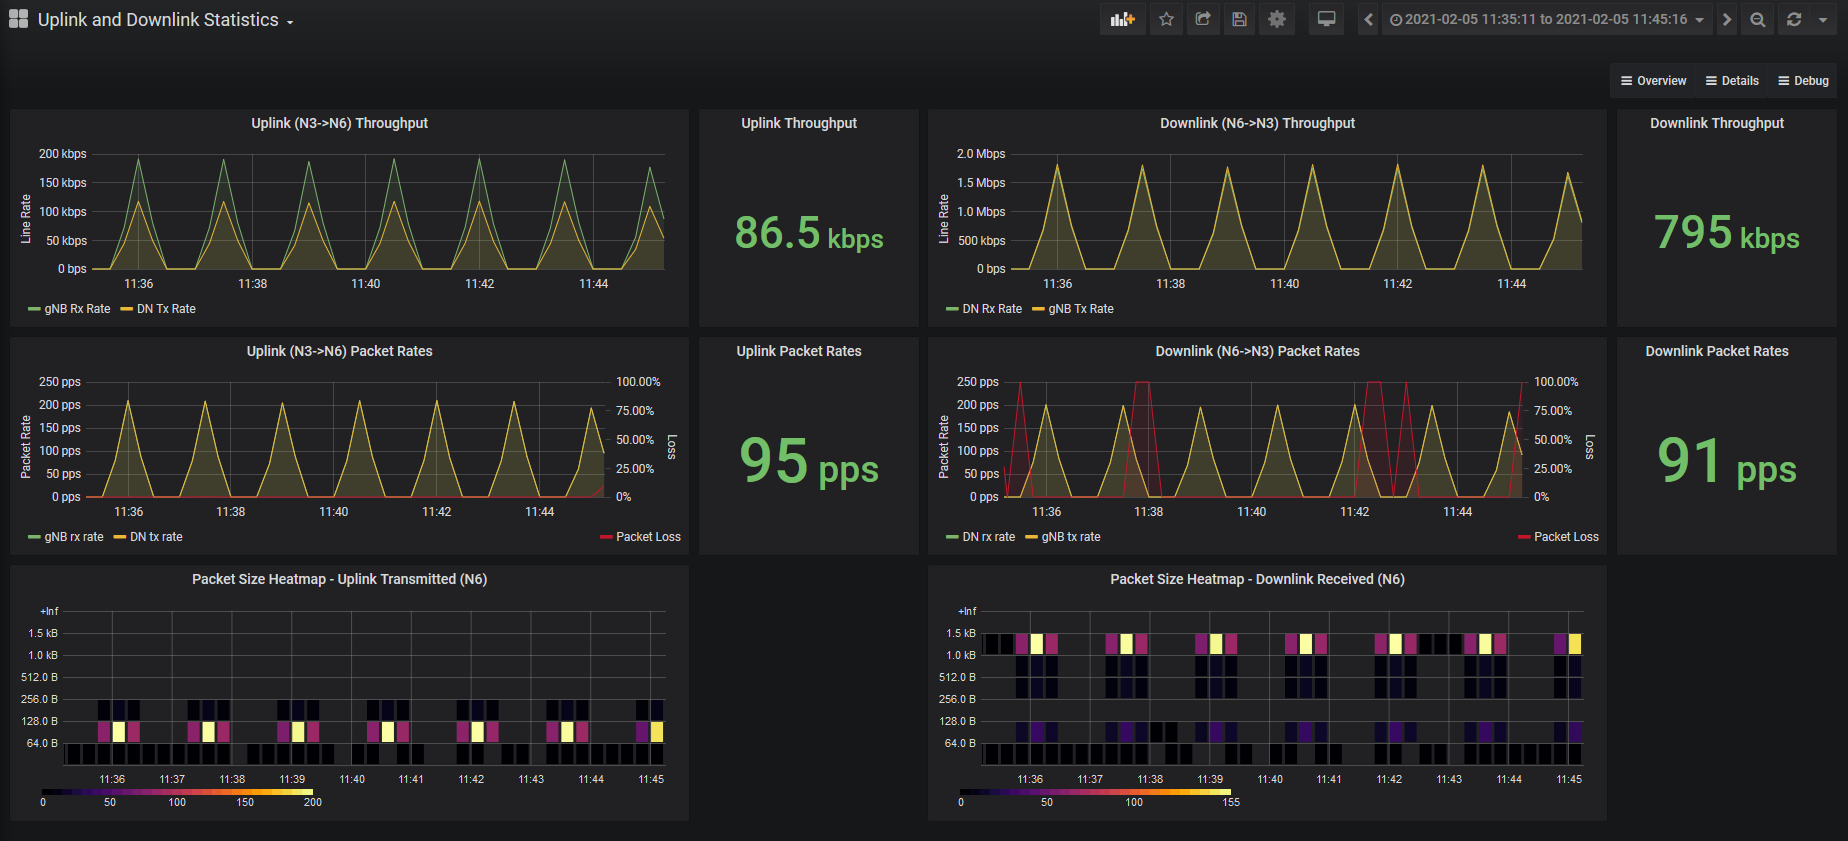
The Uplink and Downlink Statistics dashboard provides detailed statistics on the user plane traffic being handled by the packet core instance.
The Debug dashboards show detailed breakdowns of the request and response statistics for the packet core instance's interfaces.
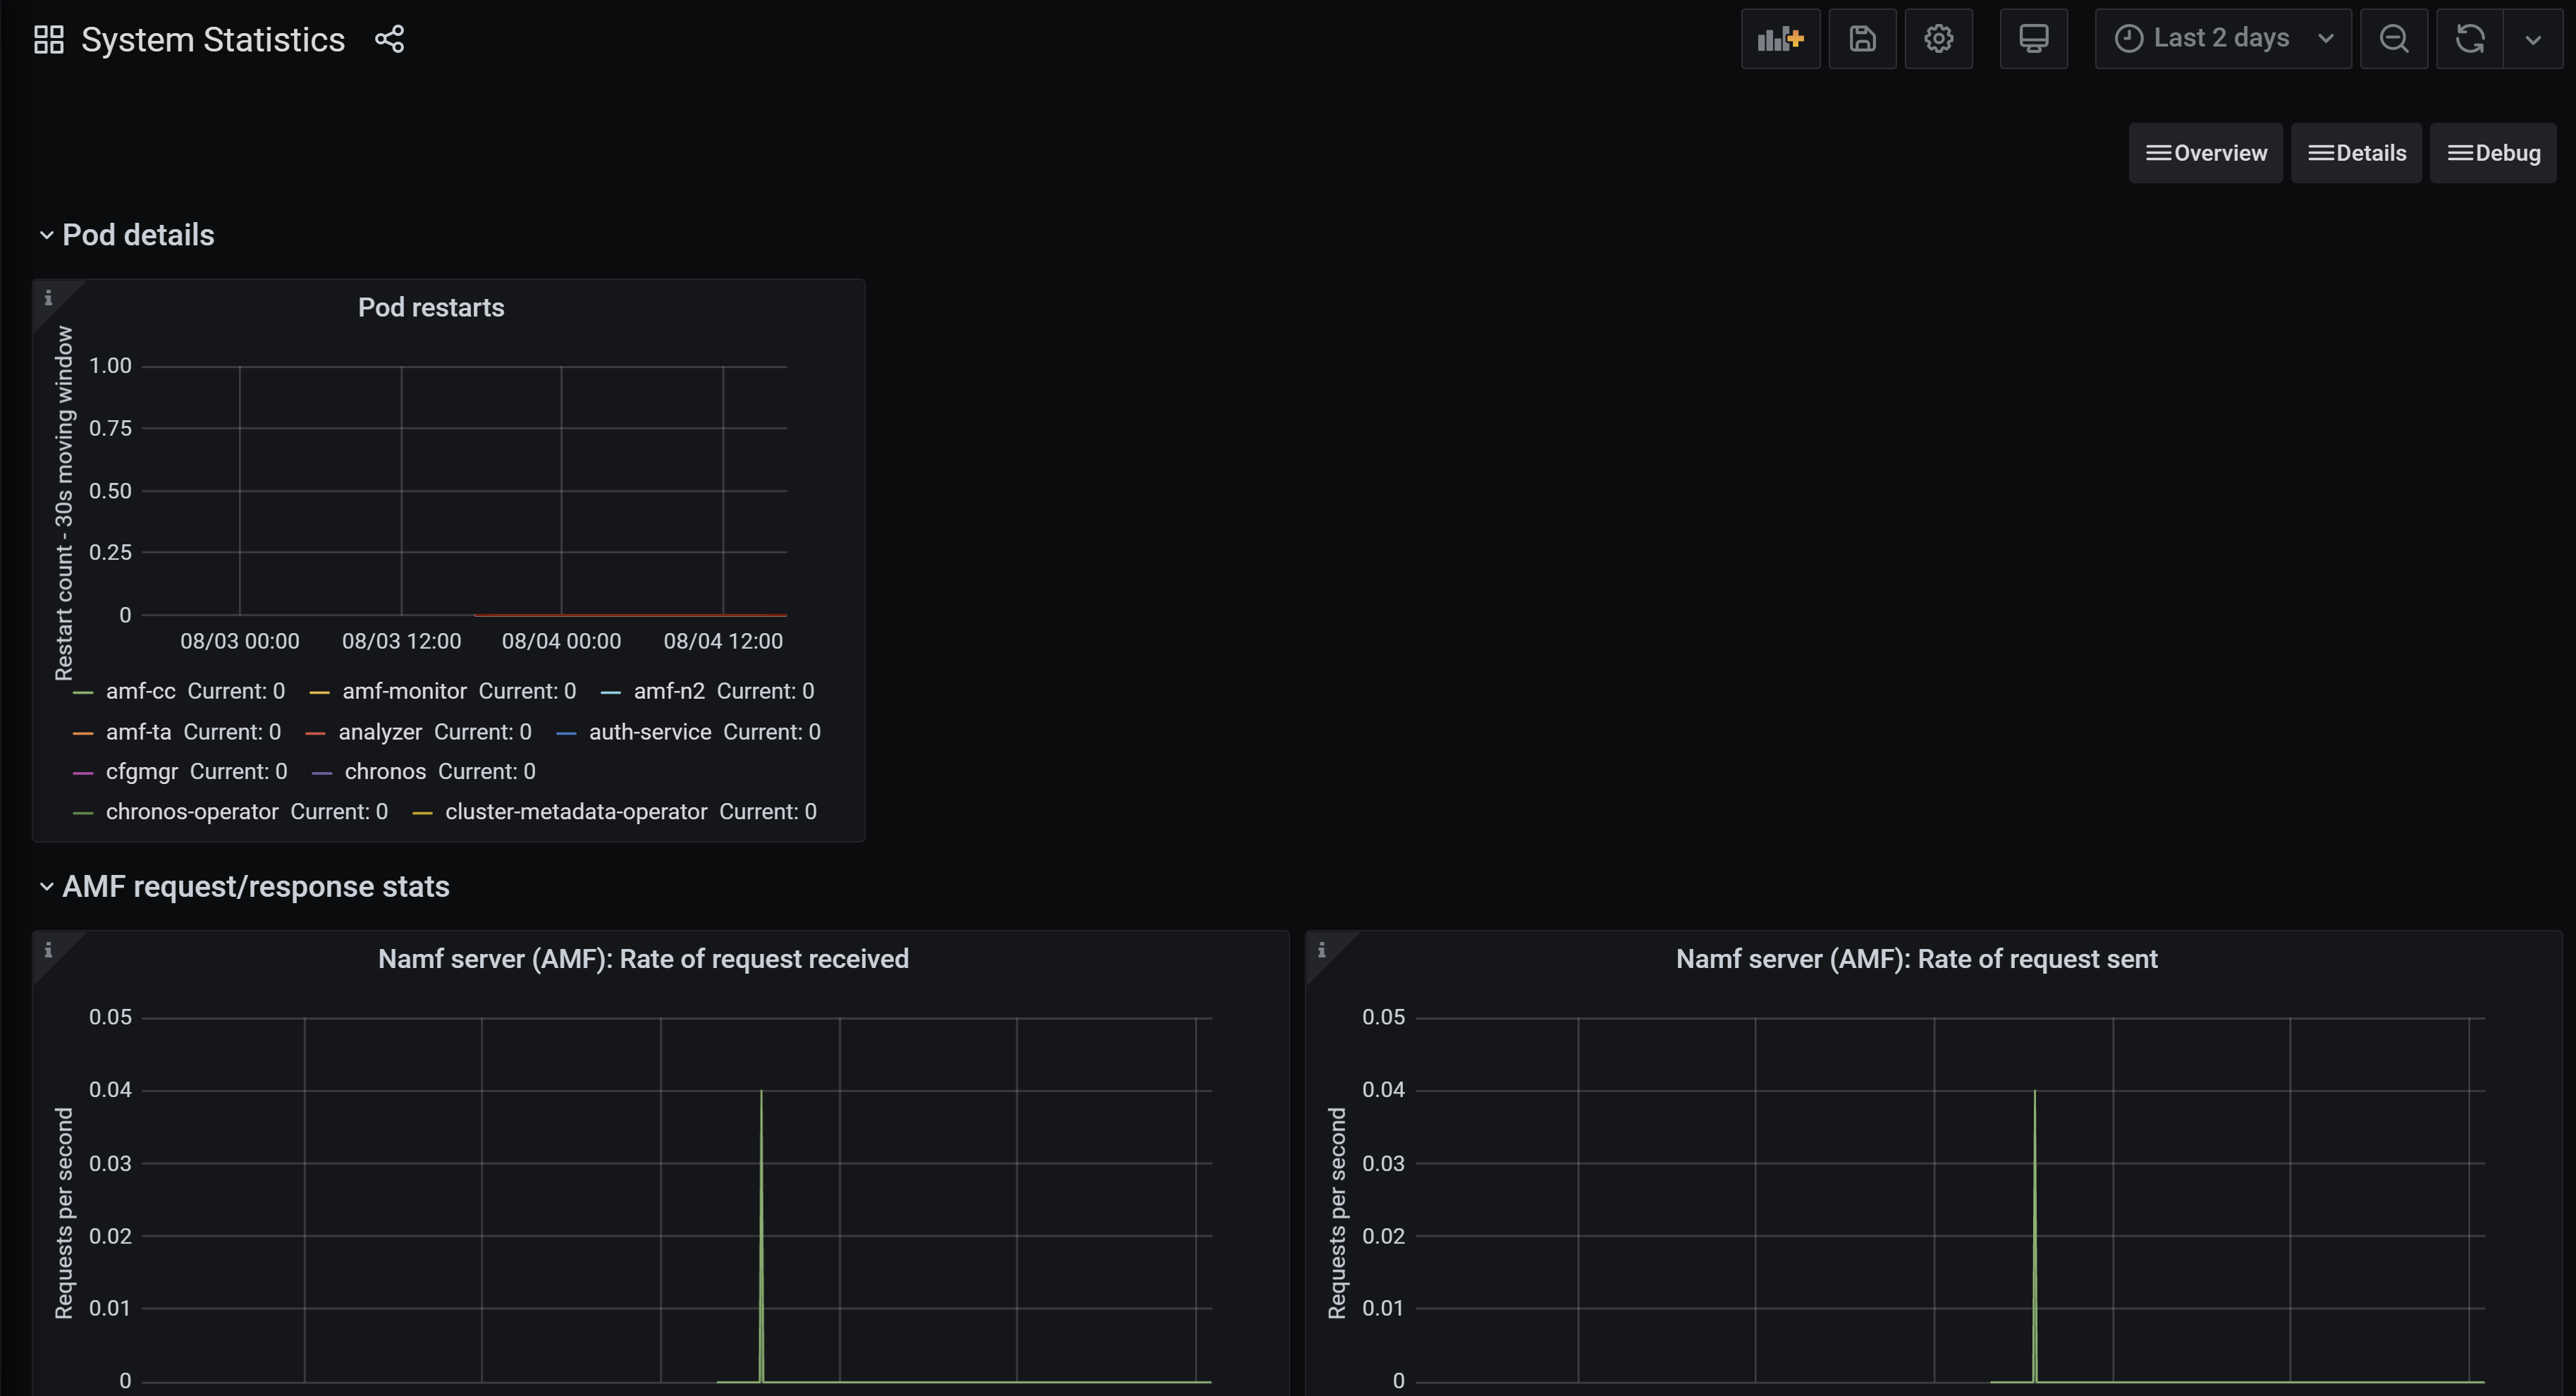
- The System Statistics dashboard contains low-level detail about pod restarts and 5G interface operations.
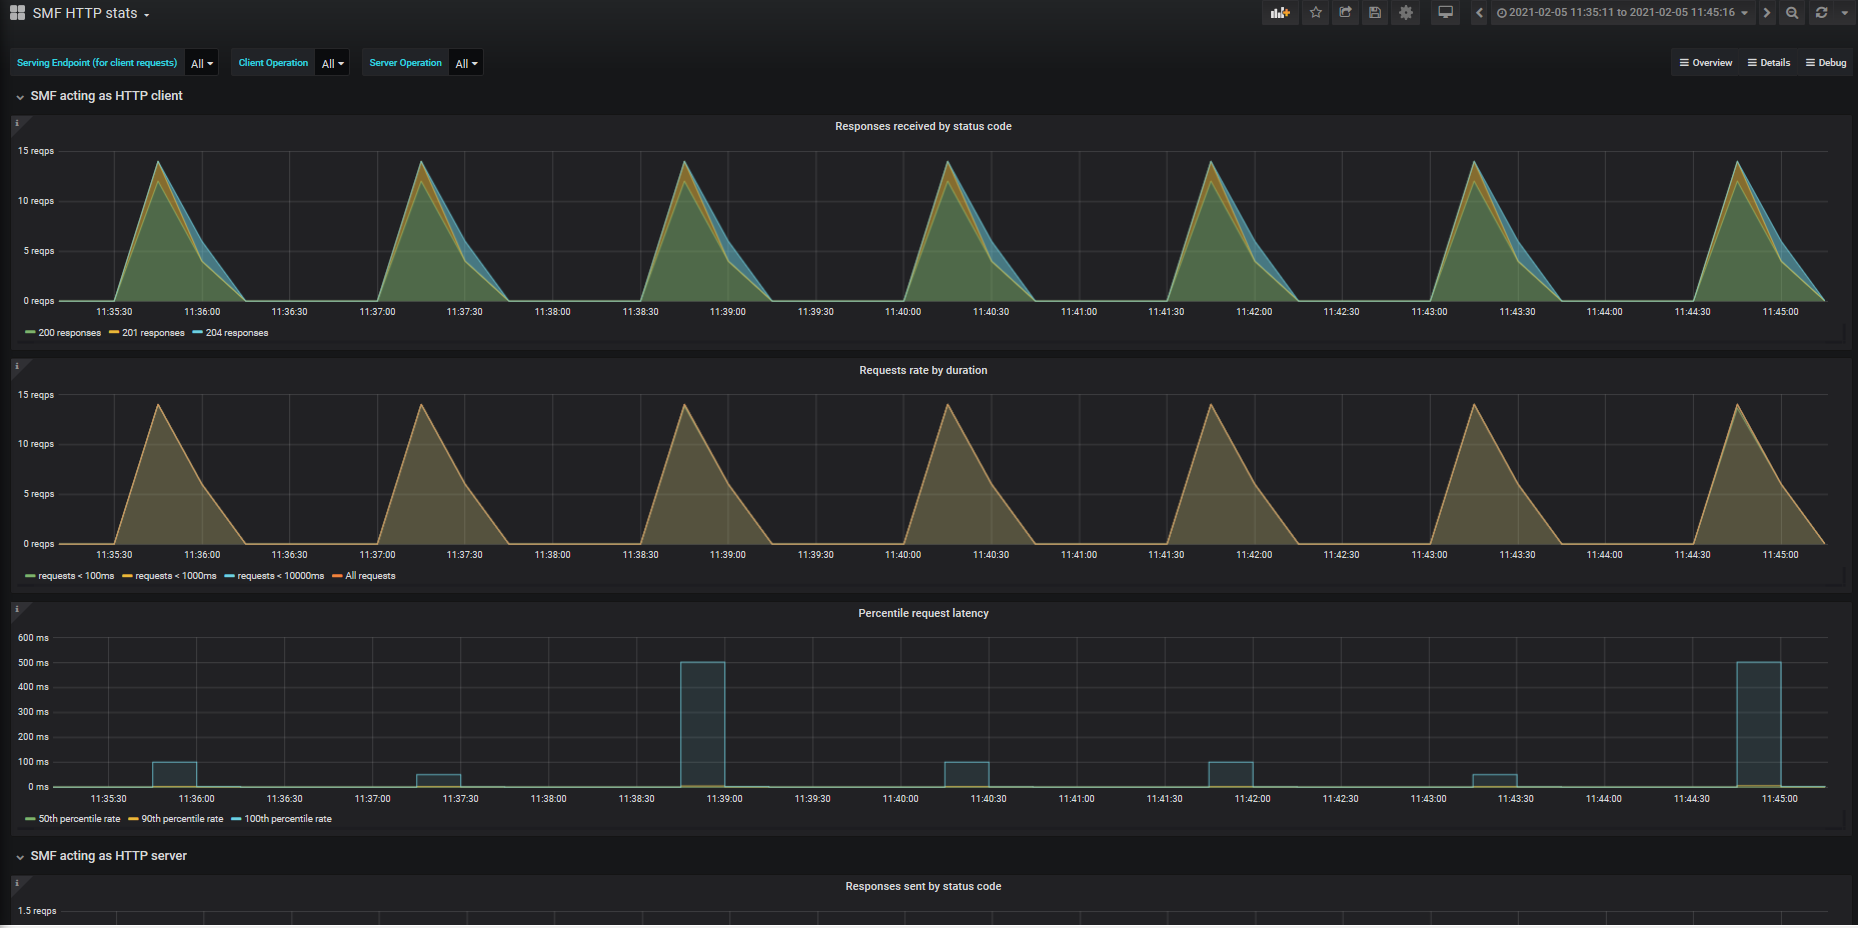
- The HTTP stats dashboard for each network function shows statistics for the HTTP requests and responses shown by that network function. You can use the Serving Endpoint, Client Operation, and Server Operation filters to control which operations are shown.
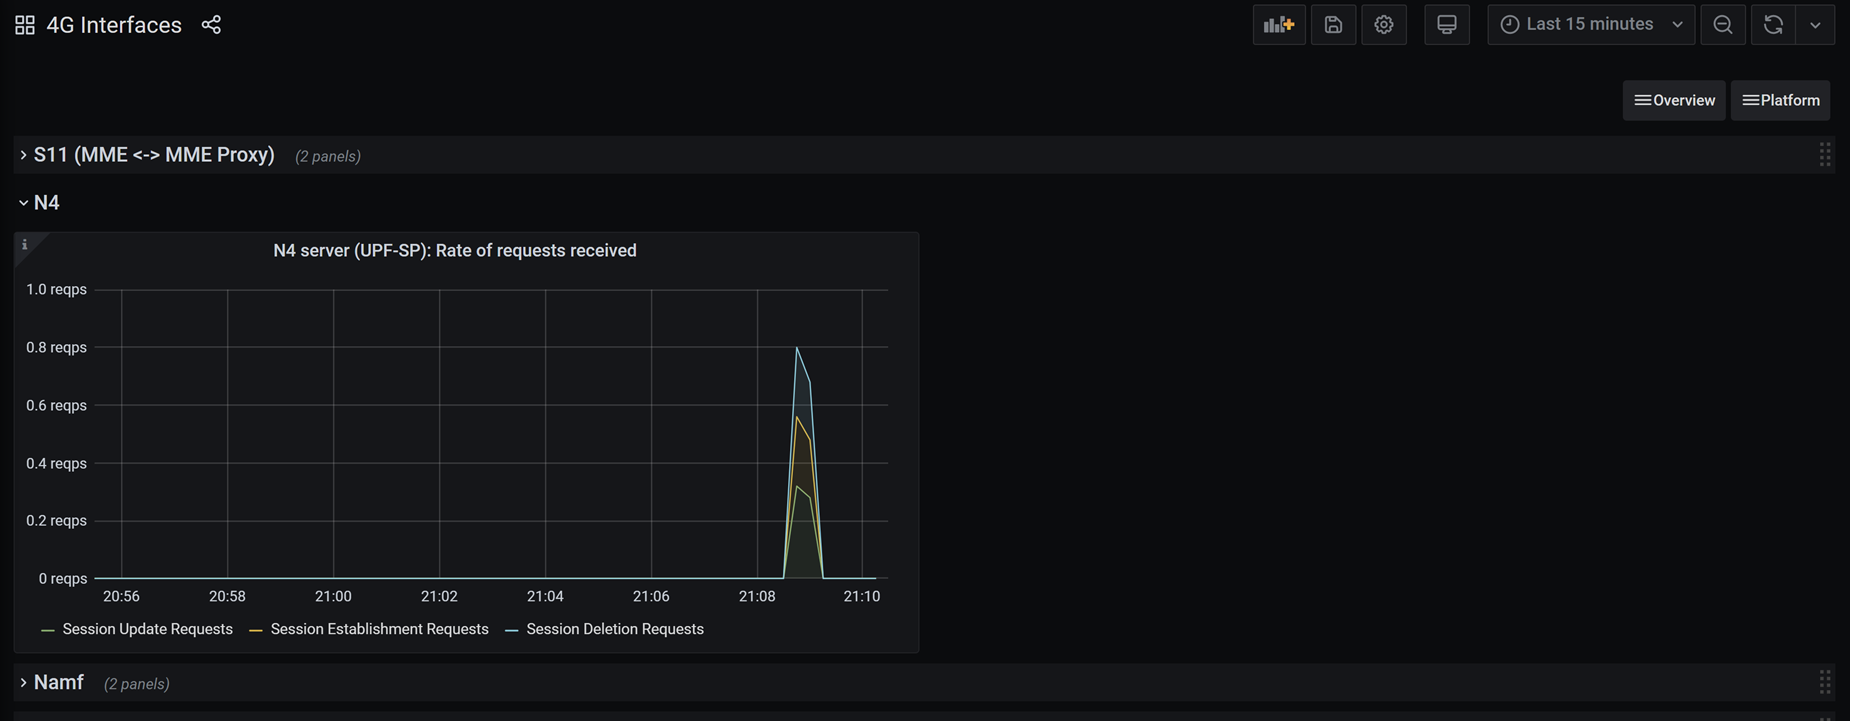
- The 4G Interfaces dashboard displays request and response statistics recorded by each of the packet core instance's 4G interfaces. Note that this dashboard is only available for packet core instances supporting 4G devices.


Filter by data network
Some packet core dashboards can be filtered to show statistics for specific data networks on certain panels.
Where supported, at the top left of the dashboard, a Data Network dropdown displays all the data networks for the deployment. Selecting one or more checkboxes next to the data network names applies a filter to the panels that support it. By default all data networks are displayed.

Panels and rows
Each dashboard contains panels and rows.
Each statistic is displayed in a panel. The packet core dashboards use the types of panel described in Types of panel.
Panels are organized into rows. Each dashboard has a minimum of one row. You can show and hide individual rows by selecting the header of the row.
Types of panel
The packet core dashboards use the following types of panel. For all panels, you can select the i icon in the upper-left corner to display more information about the statistic(s) covered by the panel.
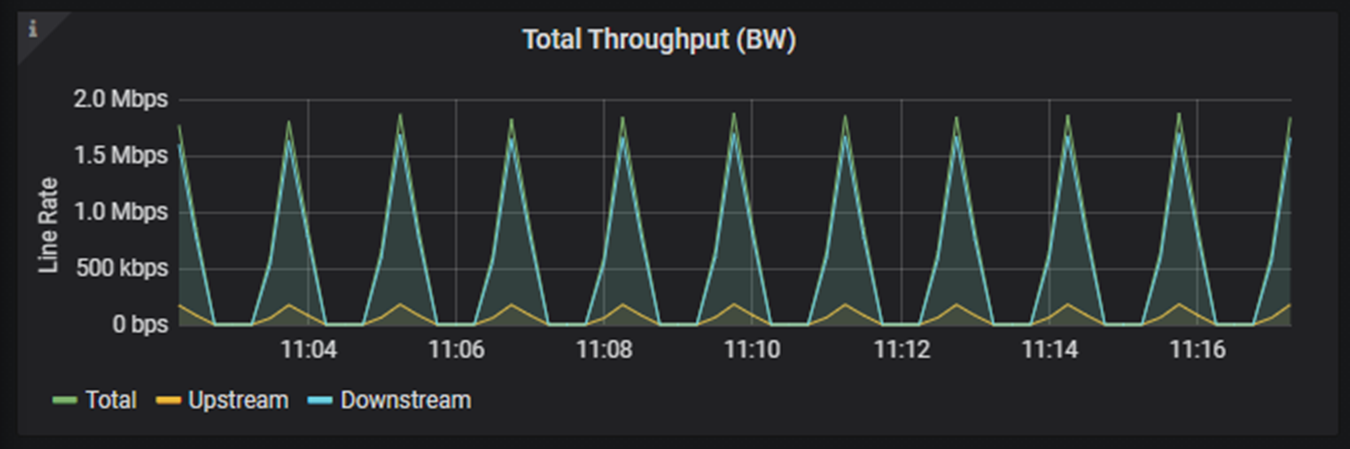
Graph panels are used to display multiple statistics and/or recent changes in a statistic. When you move the mouse over a graph panel, hover help shows the value of the statistic at that moment in time.
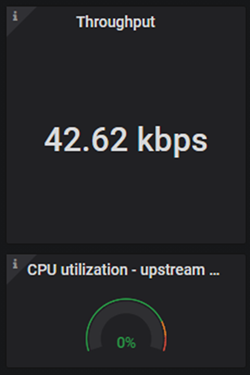
Single stat panels (called "Singlestat" panels in the Grafana documentation) display a single statistic. The statistic might be presented as a simple count or as a gauge. These panels indicate whether a single statistic has exceeded a threshold by their color.
- The value displayed on a gauge single stat panel is shown in green at normal operational levels, amber when approaching a threshold, and red when the threshold has been breached.
- The entirety of a count single stat panel will turn red if a threshold is breached.
- Table panels display statistics or alerts in a table.
Switch between dashboards
You can access the lists of available dashboards and switch between them using the drop-down dashboard links on the upper right of each dashboard. Dashboards are grouped by the level of information that they provide.
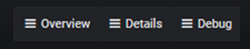
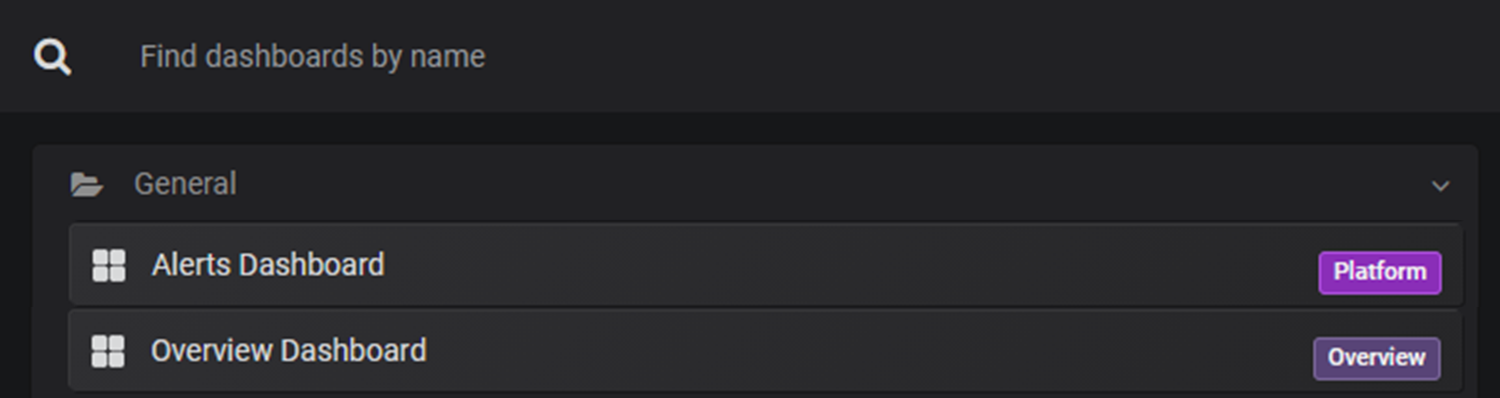
You can also switch between dashboards by selecting the dashboard picker. It's located in the upper-left of the screen and displays the name of the dashboard that you currently have open.

You can choose to use the search bar to find a dashboard by name or select from the list of recently viewed dashboards.
Adjust the time range
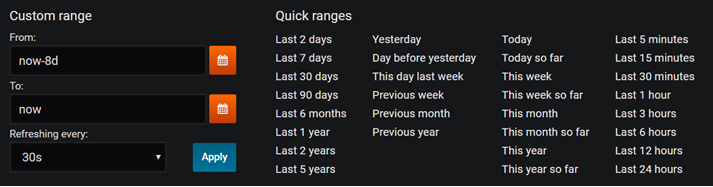
The Time picker in the top right-hand corner of each packet core dashboard allows you to adjust the time range for which the dashboard will display statistics. You can use the time picker to retrieve diagnostics for historical problems. You can choose a relative time range (such as the last 15 minutes), or an absolute time range (such as statistics for a particular month). You can also use the Refresh dashboard icon to configure how regularly the statistics displayed on the dashboard will be updated. For detailed information on using the time range controls, see Time range controls in the Grafana documentation.
Next steps
משוב
בקרוב: במהלך 2024, נפתור בעיות GitHub כמנגנון המשוב לתוכן ונחליף אותו במערכת משוב חדשה. לקבלת מידע נוסף, ראה: https://aka.ms/ContentUserFeedback.
שלח והצג משוב עבור