הערה
הגישה לדף זה מחייבת הרשאה. באפשרותך לנסות להיכנס או לשנות מדריכי כתובות.
הגישה לדף זה מחייבת הרשאה. באפשרותך לנסות לשנות מדריכי כתובות.
The Agents page in the Monitor hub gives you a centralized view of agent activity and health across your Microsoft Fabric items. Use it to quickly identify, filter, and resolve agent issues.
Any Fabric user can open the Monitor hub, but you only see activities for Fabric items you have permission to view.
Important
Monitor agents in the Monitor hub is currently in preview.
See the Supplemental Terms of Use for Microsoft Azure Previews for legal terms that apply to Azure features that are in beta, preview, or otherwise not yet released into general availability.
Agent monitoring doesn't require any opt-in. All columns on the Agents page are available automatically, based on metrics collected when you create an agent.
Prerequisites
Before you begin, ensure that you have the following prerequisites:
- Access to Fabric and permission to open the Monitor hub.
- At least one Data Agent or Operations agent that you have permission to view.
Open agent monitoring
To view agent activity in your workspace:
- Sign in to Microsoft Fabric.
- Open Monitor from the navigation pane. Switch to the new Monitor hub experience if you're still in the classic view.
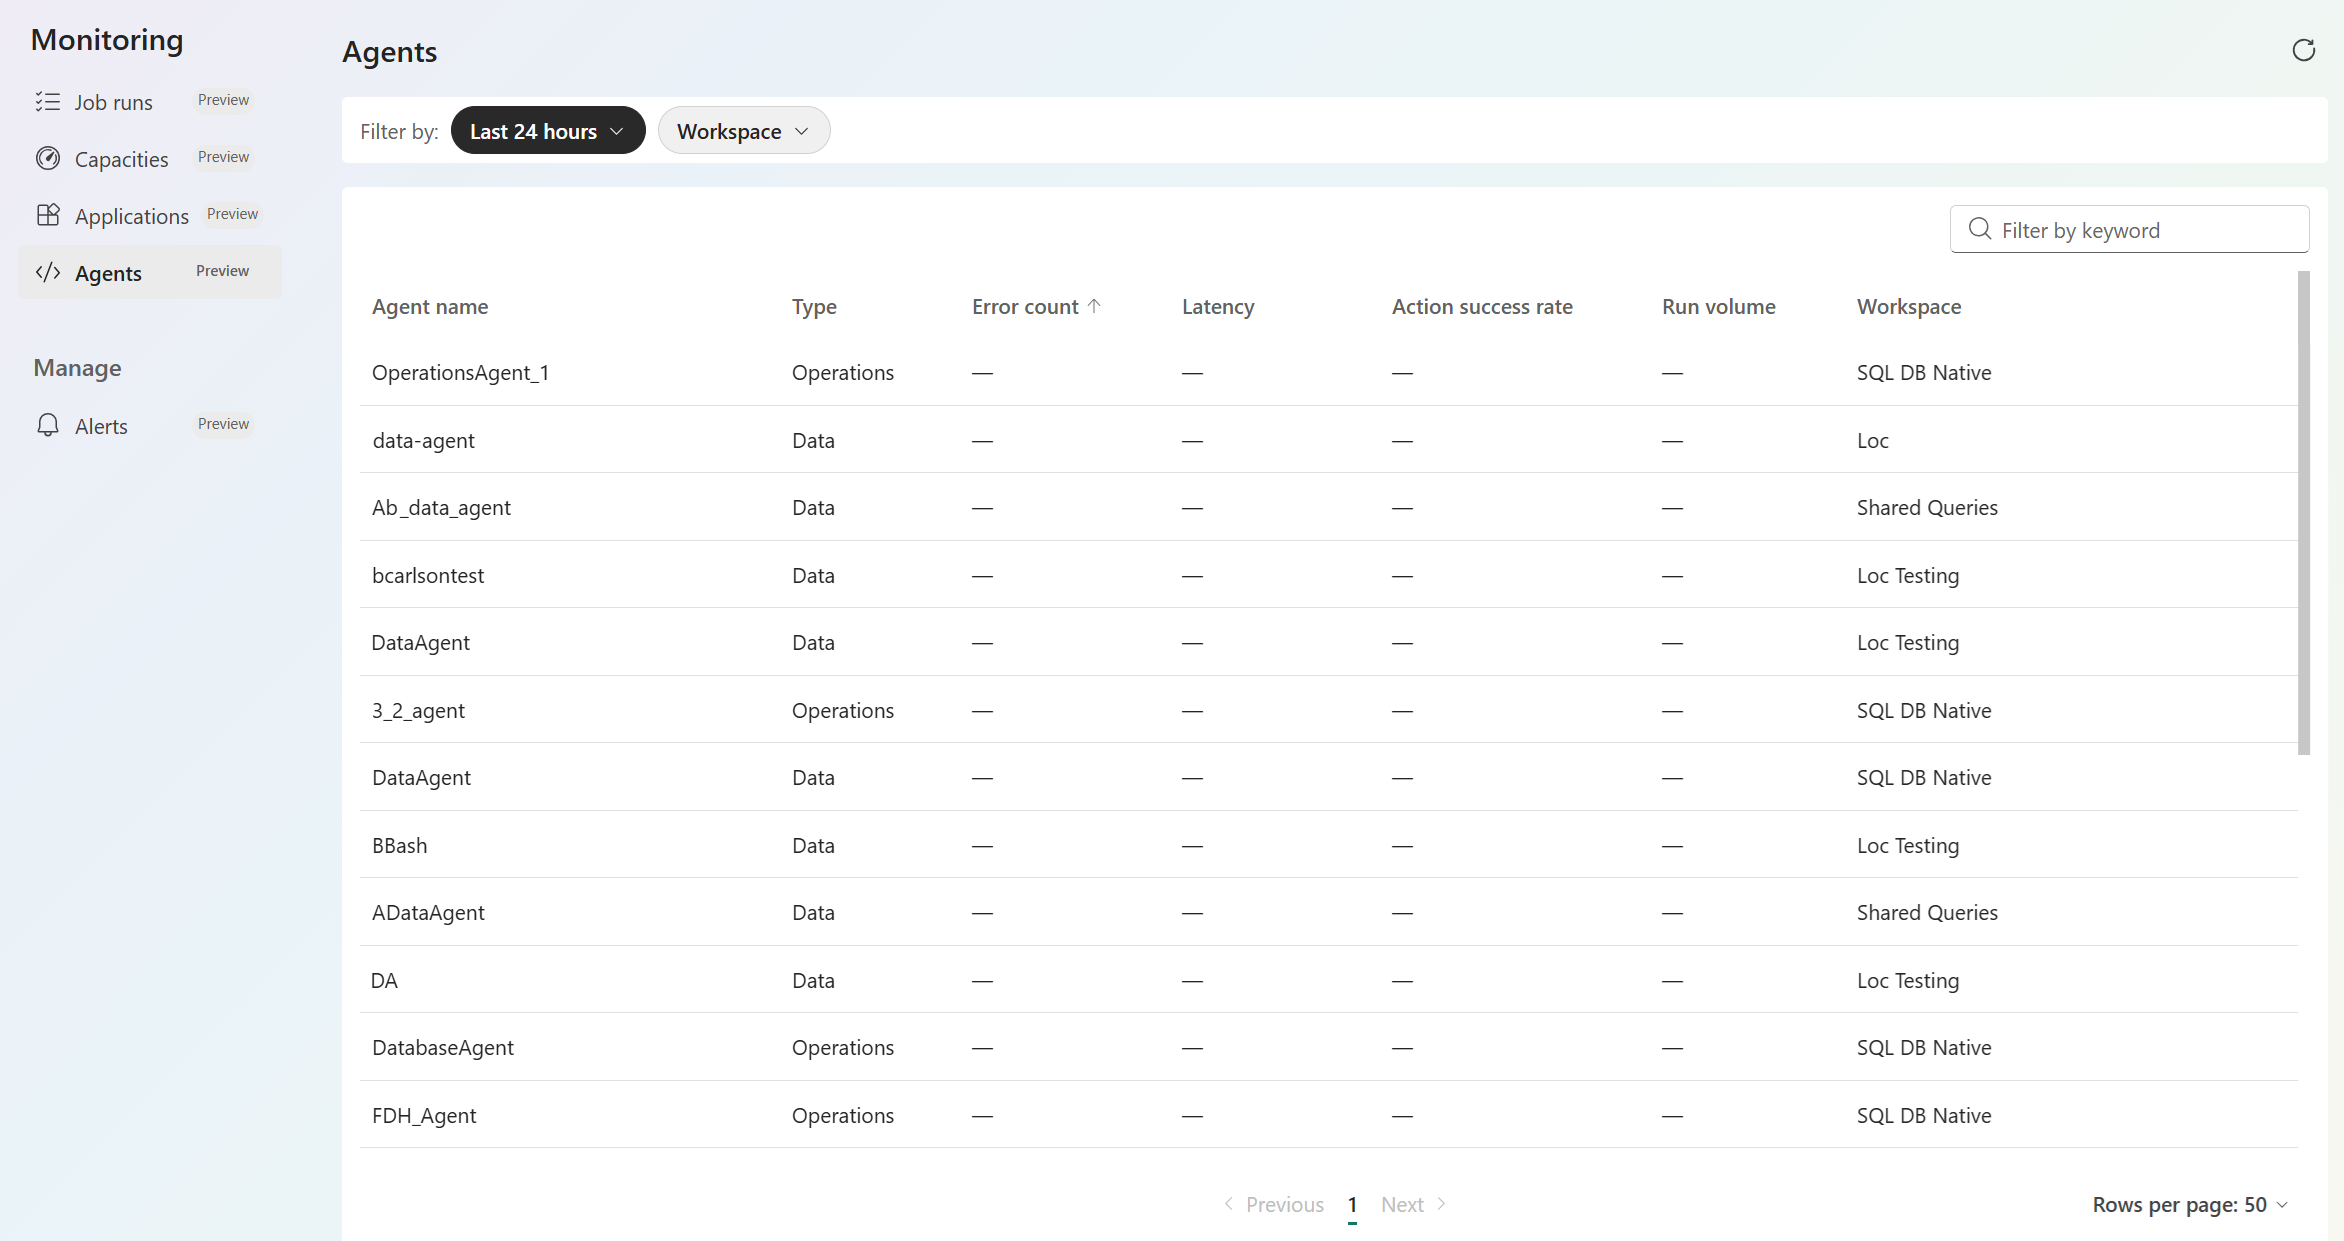
- Select Agents. The page shows a list of agents, along with activity and health metrics for each one. Hover over a column header to see a tooltip that explains what the metric means.
Sort and filter the Agents view
Use the following options to find the agents you're interested in.
Sort and customize columns: Select a column header to sort the list. Use Manage columns to add, remove, or reorder columns. Hover over a column header to see a tooltip describing what that metric measures.
Use the filter drop-down menus: Filter by Item type or Workspace to find a group of agents.
Filter by keyword: Type text in the search box to list only those agents that contain the text.
Tip
Keyword search checks only items loaded on the current page. The filter drop-down menus don't have this limitation. If your items span multiple pages, use the drop-down menus to narrow the list first.
Refresh the list: The page retrieves agent data when it loads and doesn't update continuously. Select the Reload icon in the upper right to see the latest activity and health.
Get agent details
Selecting an agent in the list takes you to a different destination depending on the agent type:
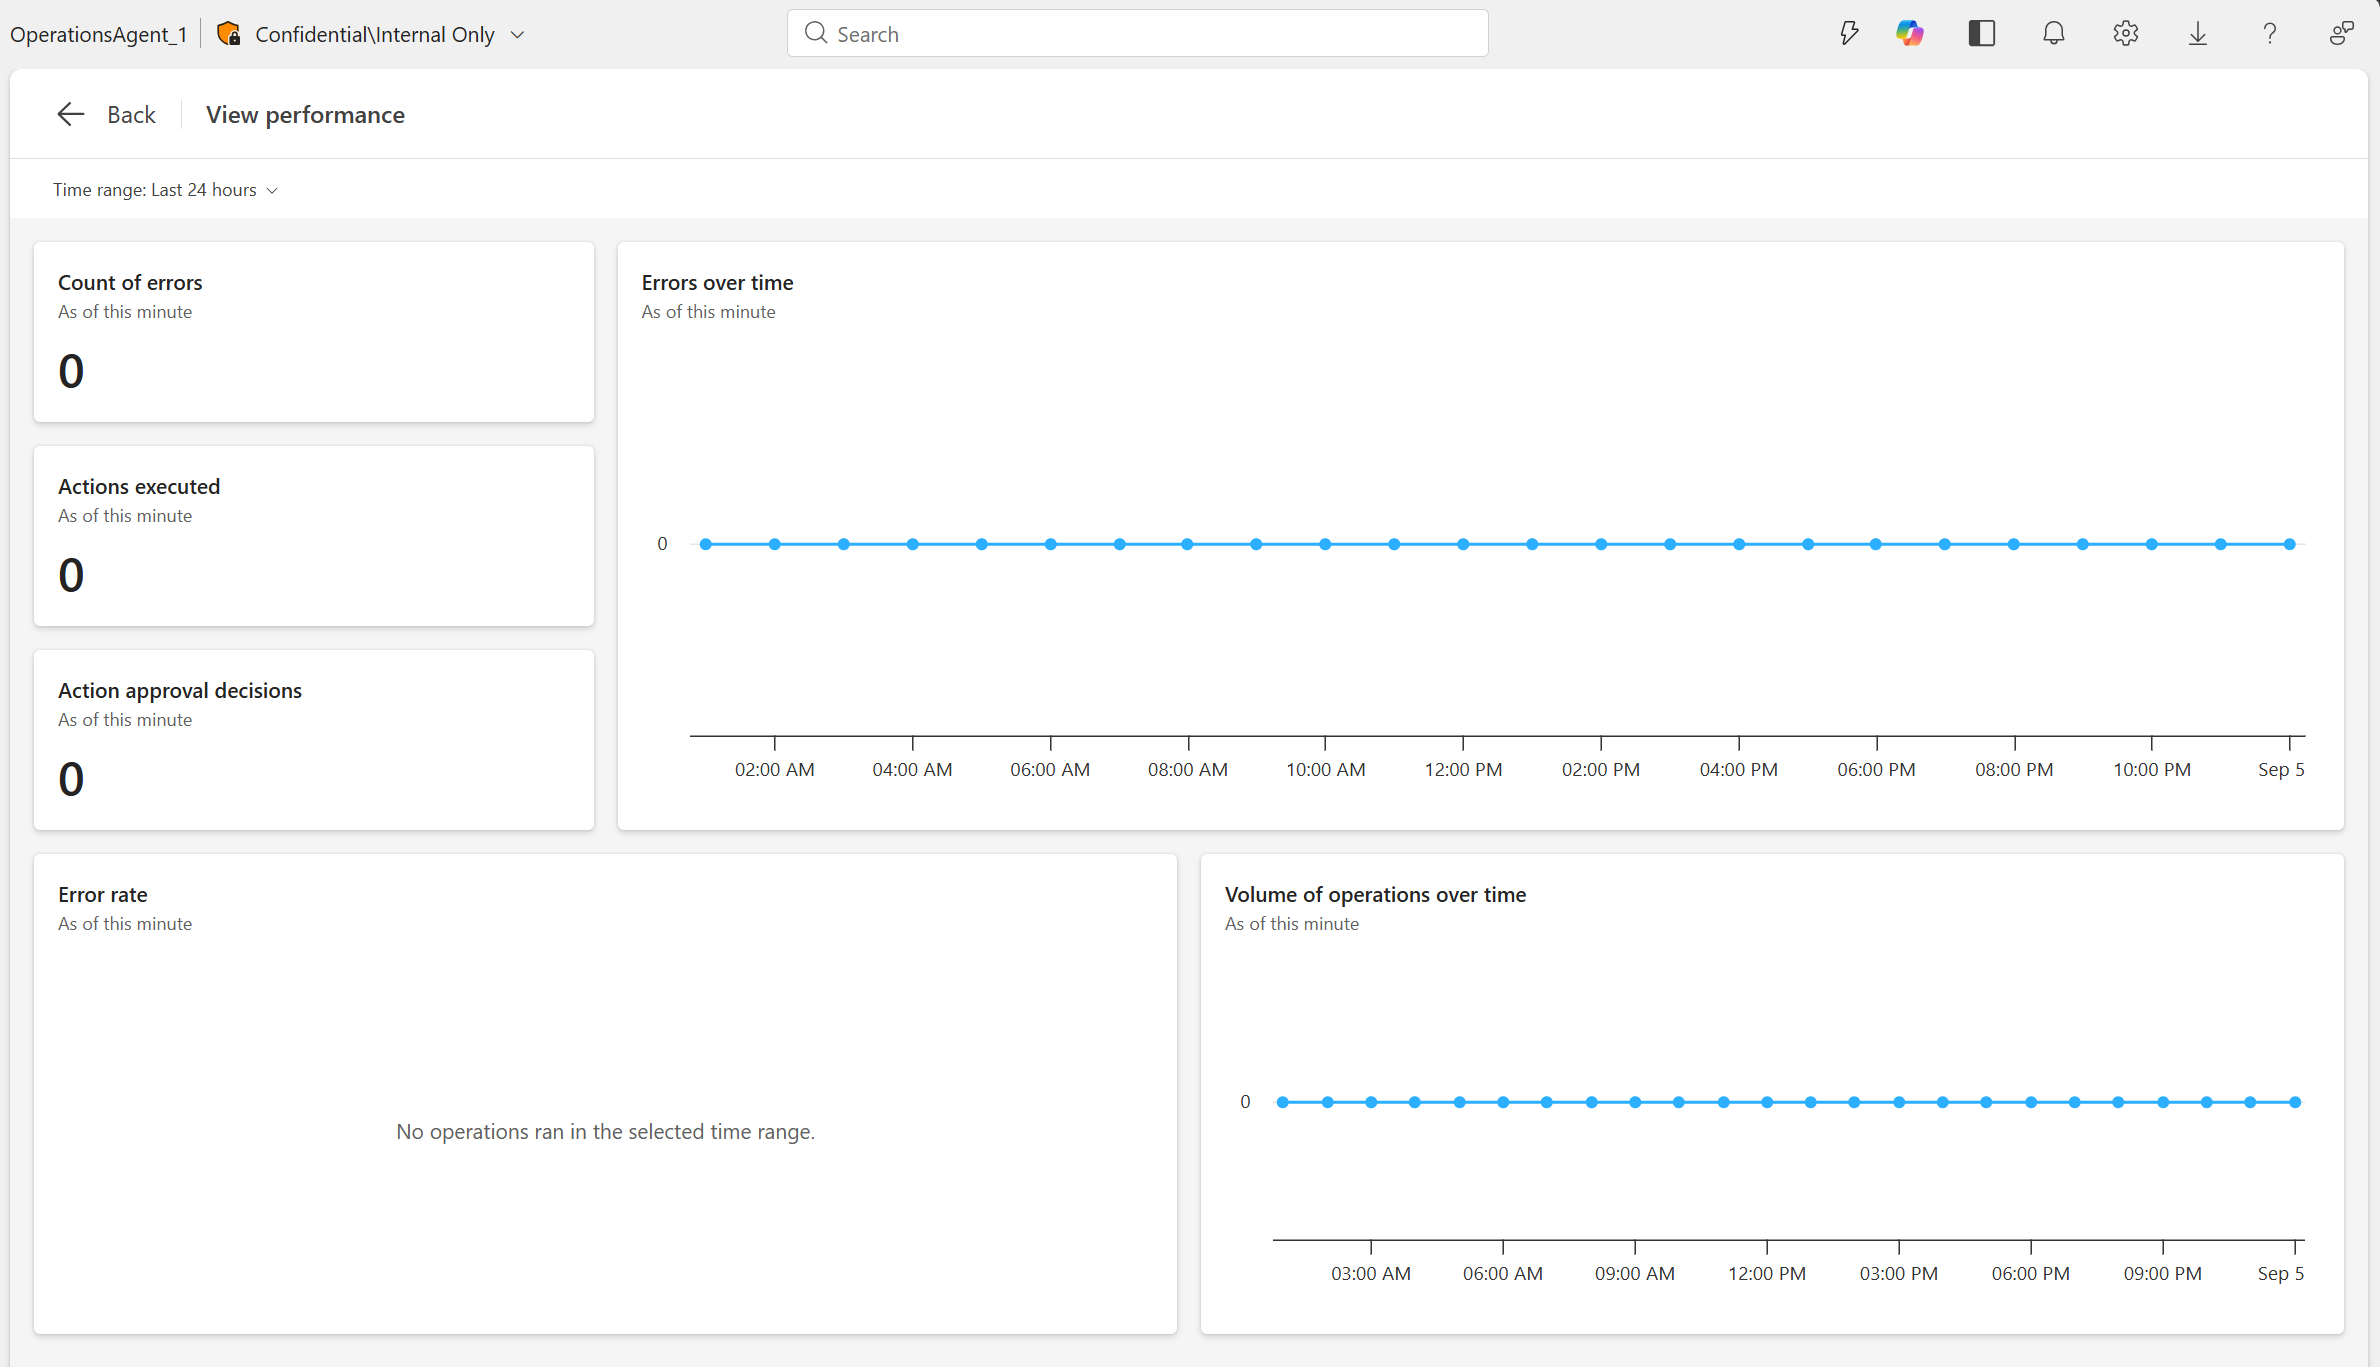
- Operations agent: Select the agent to open the item-specific Performance view, where you can review detailed activity and health information for that agent.
- Data Agent: Select the agent to open the Data Agent item itself. There's currently no dedicated monitoring view for Data Agent, so you're taken back to the item instead.
Supported item types in the Agents page
The Agents page currently supports these Fabric items:
- Data agent
- Operations agent
Support for additional agent types will expand over time to cover any agent you build on Fabric.