Access Power BI featured tables in Excel organization data types
Featured tables are a way to link your data in Microsoft Excel to data from Power BI. They make it easier to add enterprise data to your Excel sheets. In the Data Types Gallery in Excel, you find data from featured tables in Power BI semantic models. This article explains how.
To learn how to create featured tables in Power BI, see Set featured tables in Power BI Desktop.
Note
In Excel, you can also analyze data from any Power BI semantic model that you can access in Power BI.
The Excel Data Types gallery
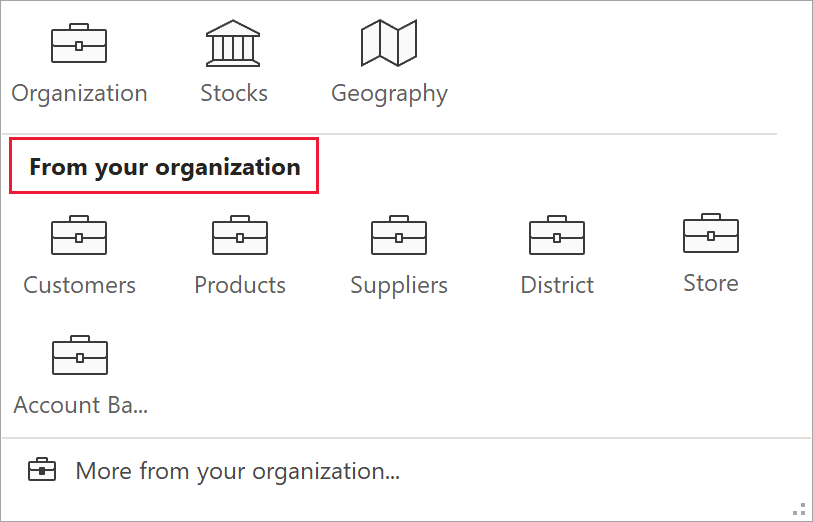
Featured tables from Power BI semantic models appear as data types on the Data ribbon, in the Excel Data Types gallery.

When expanded, the gallery shows the generic data types such as Stocks and Geography. You also see the top 10 Organization data types available to you, from featured tables in Power BI semantic models.
Search for Power BI data in the Data Types Gallery
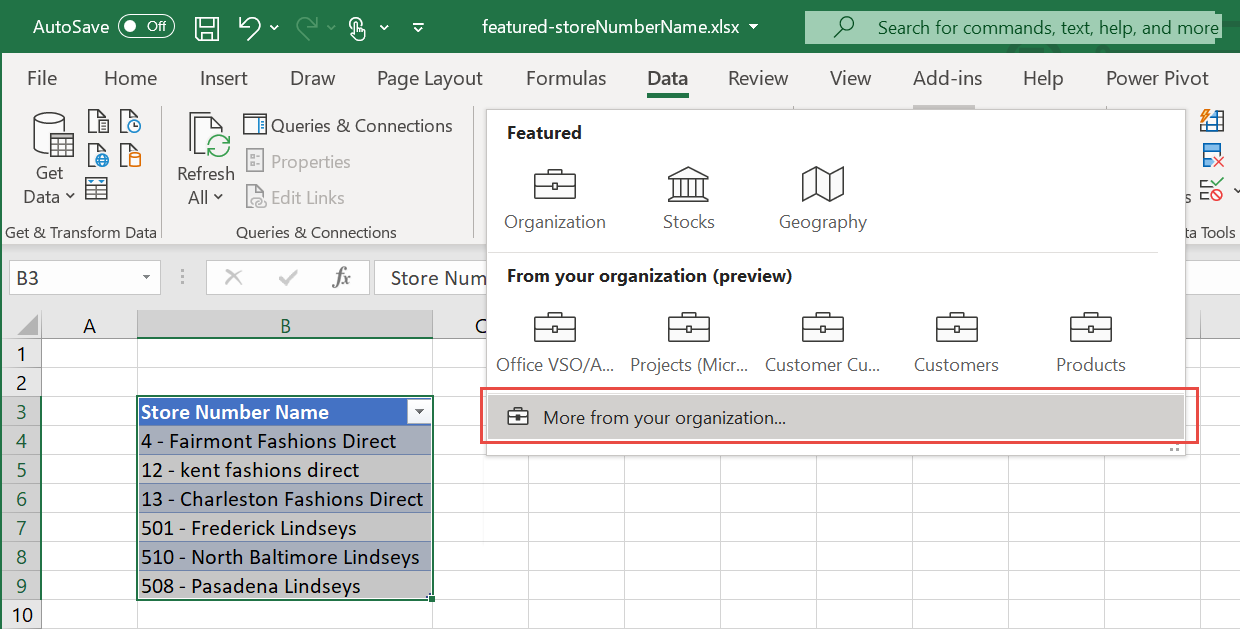
To search for data in a Power BI featured table, select a cell or a range in your Excel sheet containing a value that matches the value in a featured table. Select the More arrow next to the Data Types gallery.

If you see the table you're looking for, select it. Otherwise, select More from your organization. Excel displays all the featured tables you have access to in the pane.
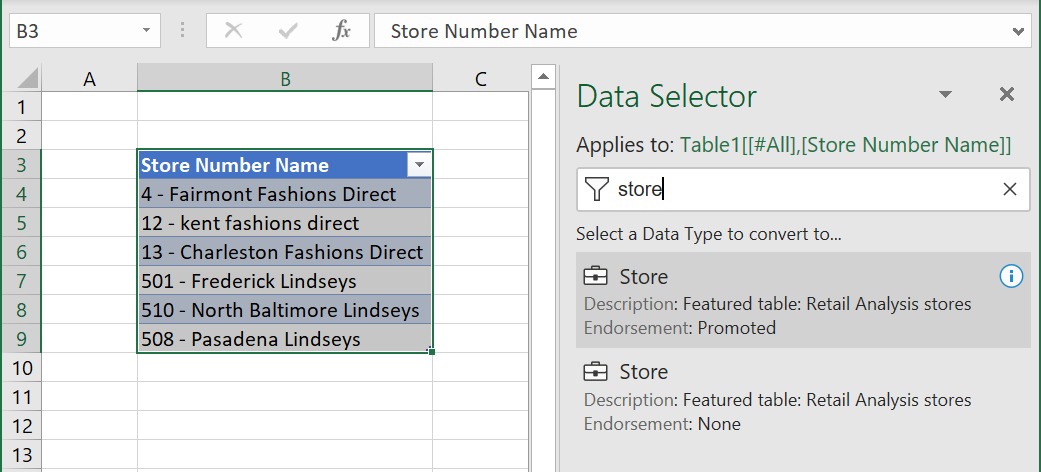
In the Data Selector pane, type in the Filter box to narrow your options. Select the table you want to use.
If Excel finds matching rows with high confidence, the cells are immediately linked to those rows. The linked item icon indicates the cells are linked to the rows in Power BI.
![]()
If a cell has more than one potential matching row, the cell shows a question mark icon, and the Data Selector pane opens. In the following example, we selected a range from B3:B9, then selected the Power BI featured table Store. All the rows had matches except cell B9, "508 - Pasadena Lindseys". The Data Selector shows two possible matches, the same value in two different tables.
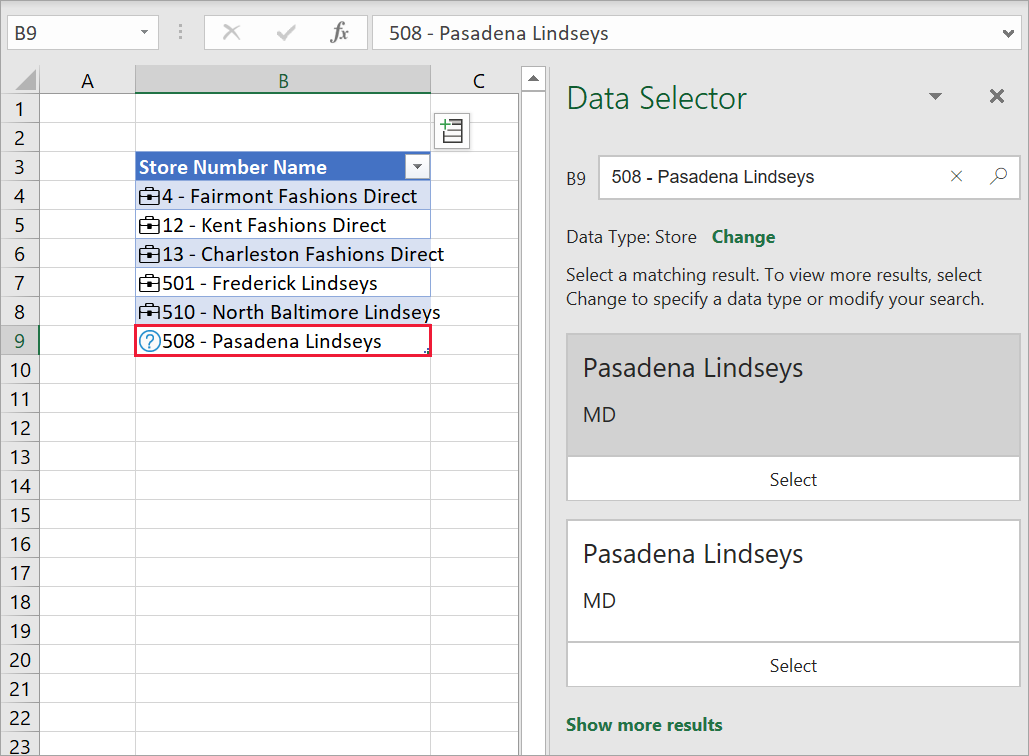
The Organization data option can return rows from multiple featured tables. Excel groups the potential matching rows by the data type they came from. Excel sorts the data types based on their strongest potential matching row. Use the chevron arrows to collapse and expand the data types to matching rows.
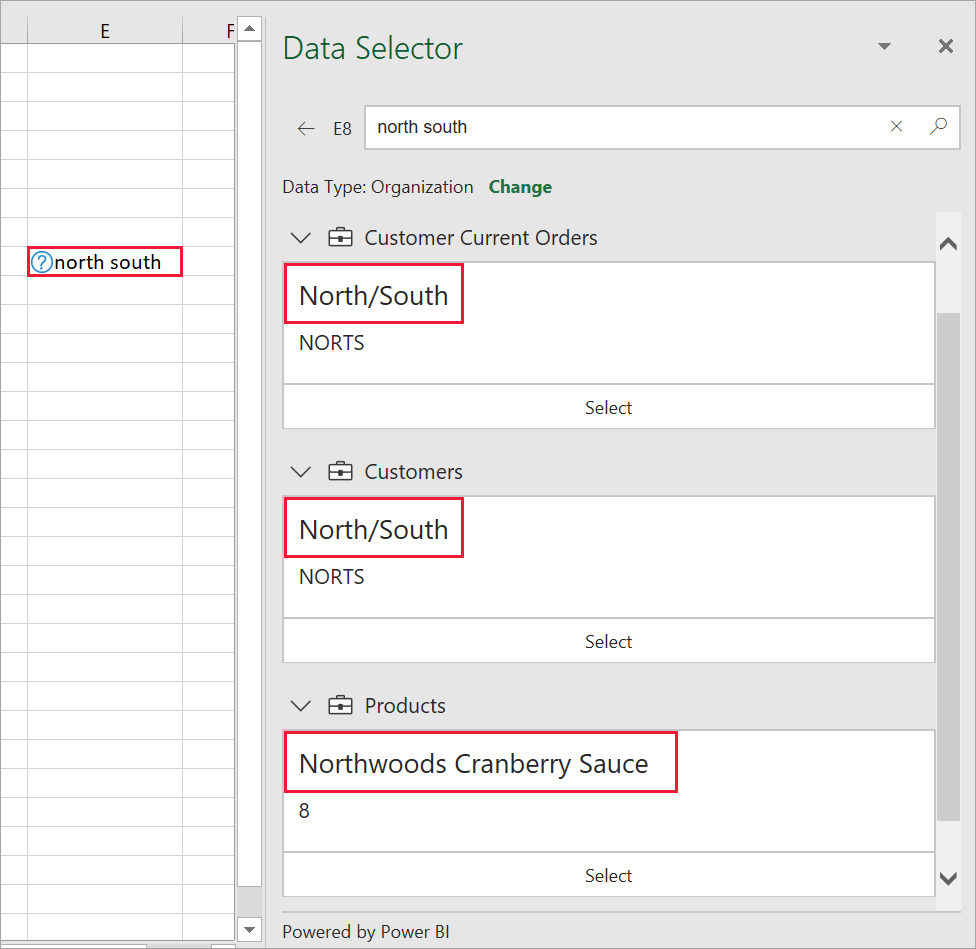
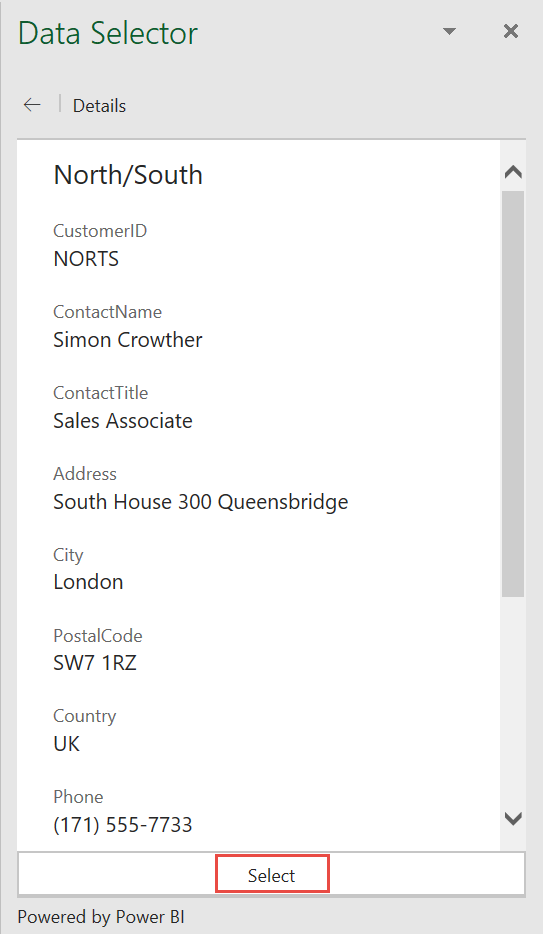
For each suggestion, select the row name in the Data Selector pane to see more details within the row to help you pick the right row. Once you’ve found it, press Select to link the row to the cell in Excel.
Explore related data
Now that you've created the connection between the values in your Excel sheet and the data from the Power BI featured table, you can explore that data. Use the data to enhance your Excel reporting.
View related data in a card
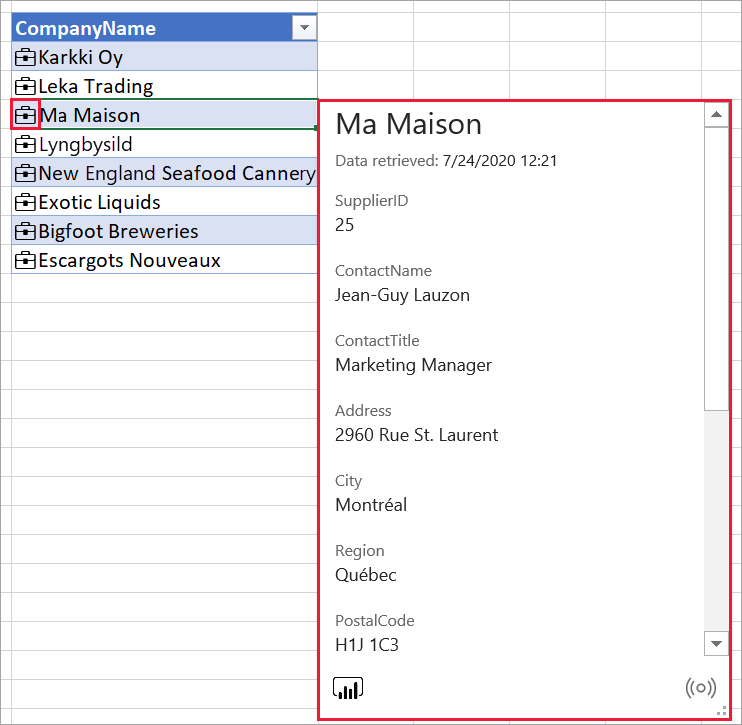
Select the Card icon in the cell to show a card with data from any fields and calculated fields in the featured table. The title of the card shows the value of the row label field in the featured table.
Insert related data from Power BI
Select the Insert Data icon, then select a field name from the list of fields to add its value to the grid.
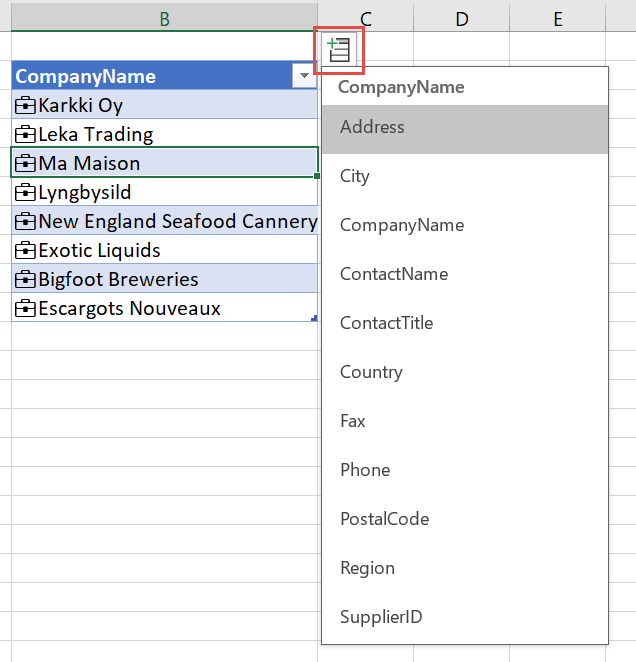
The field value or values are placed in the adjacent cells. The cell formula refers to the linked cell and the field name, so you can use the data in Excel functions.
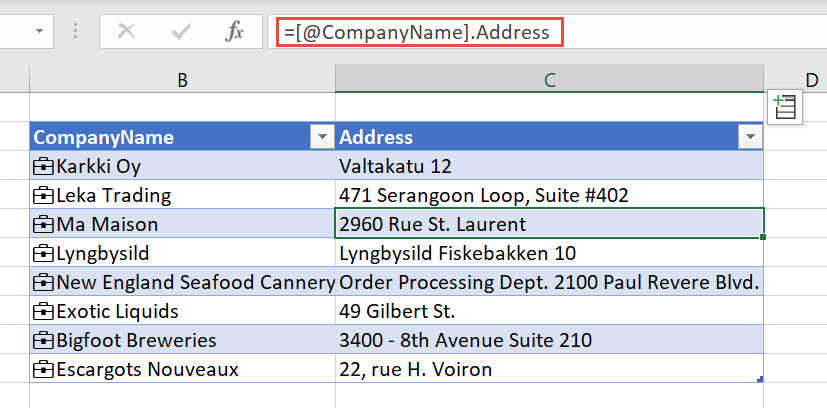
Use cell formulas
In an Excel table, you can refer to the linked table column and then add data fields using the . (period) reference.
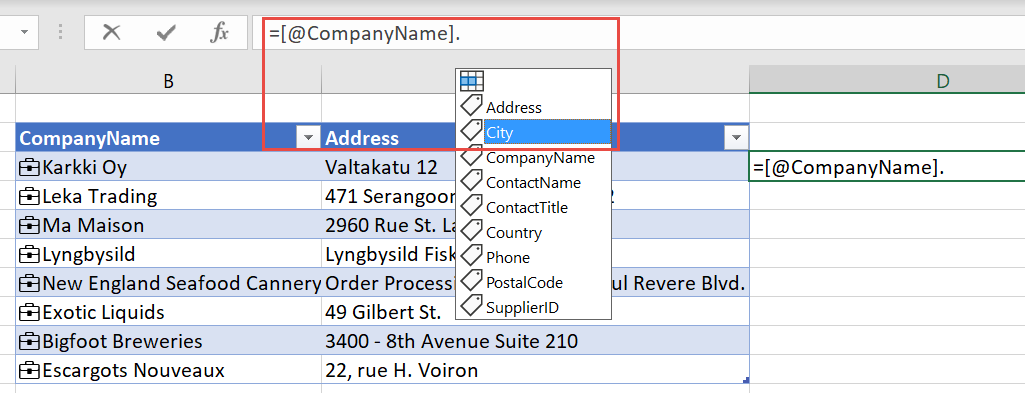
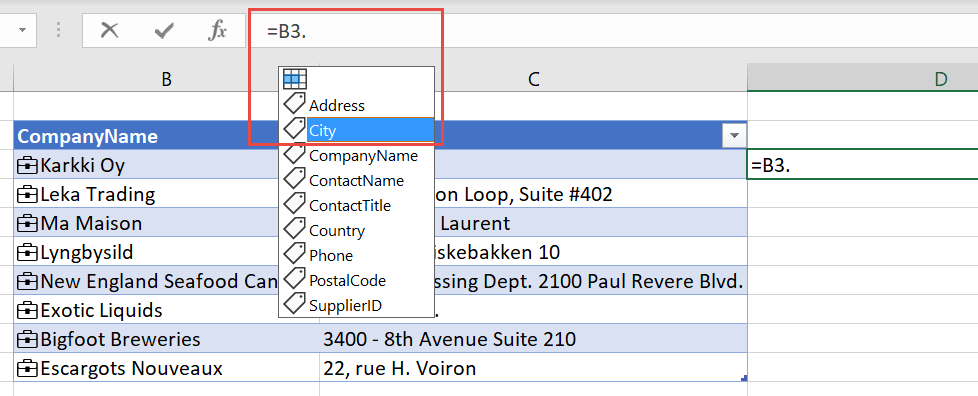
Likewise in a cell, you can refer to the cell and use the . (period) reference to retrieve fields.
Show a card, change, or convert to text
Linked cells have additional right-click menu options. Right-click a cell. Along with the usual options, you also see:
- Show Data Type Card
- Data Type > Convert to Text
- Data Type > Change
- Refresh
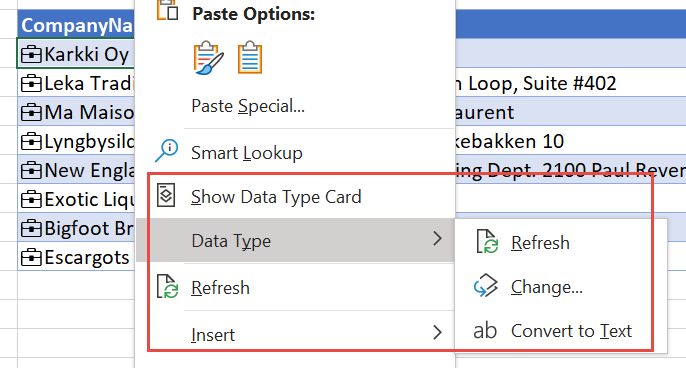
Convert to Text removes the link to the row in the Power BI featured table. Importantly, the text in the cell is the row label value of the linked cell. If you linked a cell to a row you didn’t intend to, select Undo in Excel to restore the initial cell values.
Data caching and refresh
When Excel links a cell to a row from a Power BI featured table, it retrieves and saves all the field values in the Excel file. Anyone you share the file with can refer to any of the fields, without requesting data from Power BI.
Use the Refresh All button in the Data ribbon to refresh data in linked cells.

You can also refresh individual cells. Right-click the cell and select Data Types > Refresh.
Licensing
The Excel Data Types Gallery and connected experiences to Power BI featured tables are available for Excel subscribers with a Power BI Pro service plan.
Security
You see only featured tables from semantic models you have permission to access in Power BI. When refreshing data, you must have permission to access the semantic model in Power BI to retrieve the rows. You need Build or Write permission on the semantic model in Power BI.
Excel caches the data returned for the entire row. Anyone you share the Excel file with can see the data for all the fields in all the linked cells.
Administrative control
Power BI admins can control who in the organization can use featured tables in the Excel Data Types Gallery. See Allow connections to featured tables in the Admin portal article for details.
Auditing
Administration audit logs show these events for featured tables:
- AnalyzedByExternalApplication: Gives admins visibility into which users are accessing which featured tables.
- UpdateFeaturedTables: Gives admins visibility into which users are publishing and updating featured tables.
For a complete list of audit log events, see Track user activities in Power BI.
Considerations and limitations
Here are the current limitations:
The integration is available in Excel in the current channel.
Featured tables in Power BI semantic models that use the following capabilities aren't shown in Excel:
- DirectQuery semantic models.
- Semantic models with a live connection.
Excel shows only data in columns, calculated columns, and measures defined in the featured table. The following aren't provided:
- Measures defined on related tables.
- Implicit measures calculated from relationships.
When you use Power BI featured tables in Excel, your Power BI data might be processed in a region or geography that's different than where your Power BI tenant data is stored at rest.
The Data Types experience in Excel is similar to a lookup function. It takes a cell value provided by the Excel sheet, and searches for matching rows in Power BI featured tables. The search experience has the following behaviors:
Row matching is based on text columns in the featured table. It uses the same indexing as Power BI Q&A capability, which is optimized for English-language search. Searching in other languages may not result in accurate matches.
Most numerical columns aren't considered for matching. If the Row Label or Key Column are numeric, they're included for matching.
Matching is based on Exact and Prefix matches for individual search terms. A cell’s value is split based on spaces or other whitespace characters like tabs. Then each word is considered a search term. A row’s text field values are compared to each search term for Exact and Prefix matches. A Prefix match is returned if the row’s text field starts with the search term. For example, if a cell contains “Orange County”, then “Orange” and “County” are distinct search terms.
- Rows with text columns whose values exactly match “Orange” or “County” are returned.
- Rows with text columns whose values start with “Orange” or “County” are returned.
- Importantly, rows that contain “Orange” or “County” but don’t start with them aren't returned.
Power BI returns, at most, 100 row suggestions for each cell.
Some symbols aren't supported.
Setting or updating the featured table isn't supported in the XMLA endpoint.
Excel files with a data model can be used to publish featured tables. Load the data into Power BI desktop and then publish the featured table.
Changing the Table name, Row Label, or Key Column in the featured table might impact Excel users with linked cells to rows in the table.
Excel shows when the data was retrieved from the Power BI semantic model. This time isn't necessarily the time that the data was refreshed in Power BI, or the time of the most recent data point in a semantic model. For example, say a semantic model in Power BI was refreshed a week ago, but the underlying source data was a week old when the refresh happened. The actual data would be two weeks old, but Excel would show data retrieved as the date and time at which the data was pulled into Excel.
Related content
- Set featured tables in Power BI Desktop.
- Read about using Excel data types from Power BI in the Excel documentation.
- Questions? Ask the Power BI Community.