Display content in more detail: focus mode and full screen mode
APPLIES TO:
Power BI service for business users
Power BI service for designers & developers
Power BI Desktop
Requires Pro or Premium license
You want your reports, dashboards, visuals, and tiles to display a certain way. Power BI offers you many options to get it just right. Two of those options: the View menu and Focus mode are discussed in this article. Used together, you can achieve the display that you want. And these display options aren't just for viewing, you can interact with the reports, dashboards, and visuals in all of these display modes. Most of these display options are also available in Power BI Desktop.
Tip
Reports can be navigated using keyboard shortcuts.
Focus mode versus full screen mode
Focus mode and full screen mode are two different ways to see more detail in your visuals, reports, and dashboards. Full screen mode is applied to the current contents of a report canvas or dashboard. It removes all the panes surrounding your content. Focus mode is applied to individual report visuals or dashboard tiles. It enlarges the tile or visual along with filters, menus, and navigation panes. Let's take a closer look at the similarities and differences.
| Content | Focus mode | Full screen mode |
|---|---|---|
| Dashboard | No | Yes |
| Report page | No | Yes |
| Report visual | Yes | Yes, if it's already in focus mode and therefore the only visual on the report canvas. |
| Dashboard tile | Yes | No |
| Windows 10 mobile | No | Yes |
In the following example, we started with a report (1), opened one of the visuals in focus mode (2) and then opened that same visual in full screen mode (3).
When to use full screen mode
Display your Power BI service content (dashboards, report pages, and visuals) without the distraction of menus and nav panes. You get an unadulterated, full view of your content at a glance, all the time. This view is sometimes referred to as TV mode.
Use full screen mode to:
- Present your dashboard, visual, or report at a meeting or conference.
- Display in an office on a dedicated large screen or projector.
- View on a small screen.
- Review in locked mode--you can touch the screen or mouse over tiles without opening the underlying report or dashboard.
When to use focus mode
Focus mode lets you expand (pop out) a visual or tile to see more detail. Maybe you have a dashboard or report that is a little crowded and you want to zoom in on only one visual. This function is a perfect use of focus mode.
While in focus mode, you can interact with any filters that were applied when this visual was created.
Work in full screen mode
Full screen mode is available for dashboards and report pages.
To open a dashboard in full screen mode, select the full screen icon
 from the top menu bar.
To open a report page in full screen mode, select the View icon and choose Full screen.
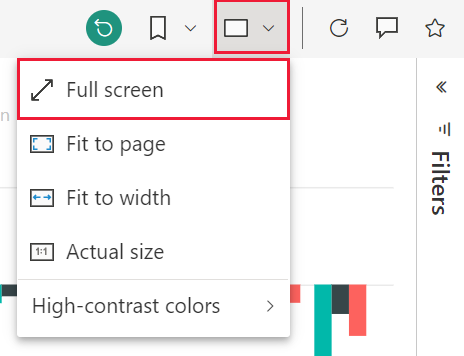
To see a visual in full screen mode, first open it in focus mode so that it's the only visual on the report page. Then open that report page in full screen mode.
Your selected content fills the entire screen. When you're in full screen mode, navigate using the menu bar at the bottom. If you don't see menu options for a dashboard, move your cursor, and the menu appears. Because full screen is available for such a wide variety of content, the navigation options vary. Some of the options are:
Select the Back, Go back, or Back to report button to navigate to the previous page in your browser. If the previous page was a Power BI page, it too displays in full screen mode. Full screen mode persists until you exit out.


Use the Fit to page or Fit to screen option to display your selected content at the largest size possible without resorting to scrollbars.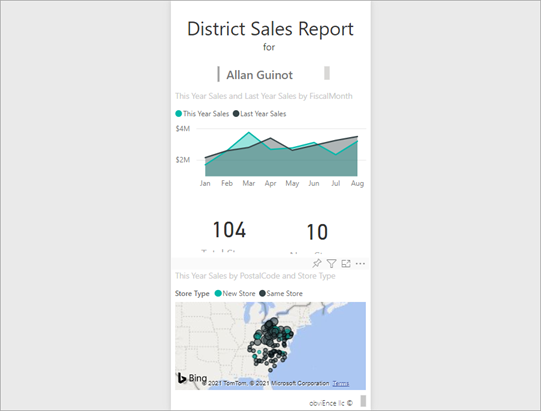


Sometimes you don't care about scrollbars, but you want the dashboard to fill the entire width of the available space. Select the Fit to width button.

In full screen reports, use these arrows to move between the pages in the report. Each page displays in full screen mode. Full screen mode persists until you exit full screen mode.
To exit full screen mode, select the Exit full screen icon.
Work in focus mode
Focus mode is available for dashboard tiles and report visuals.
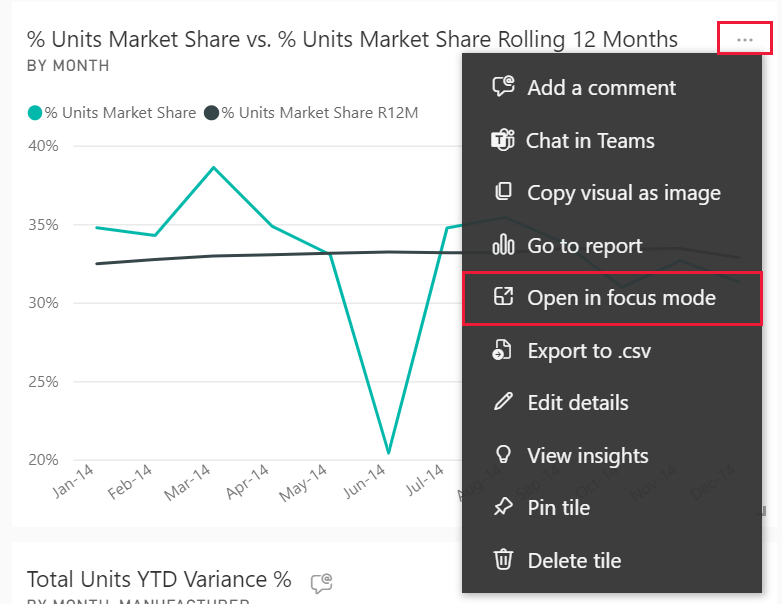
To open a dashboard tile in focus mode, hover over a tile, select More options (...) and choose Open in focus mode.
To open a report visual in focus mode, hover over the visual and select the Focus mode icon.

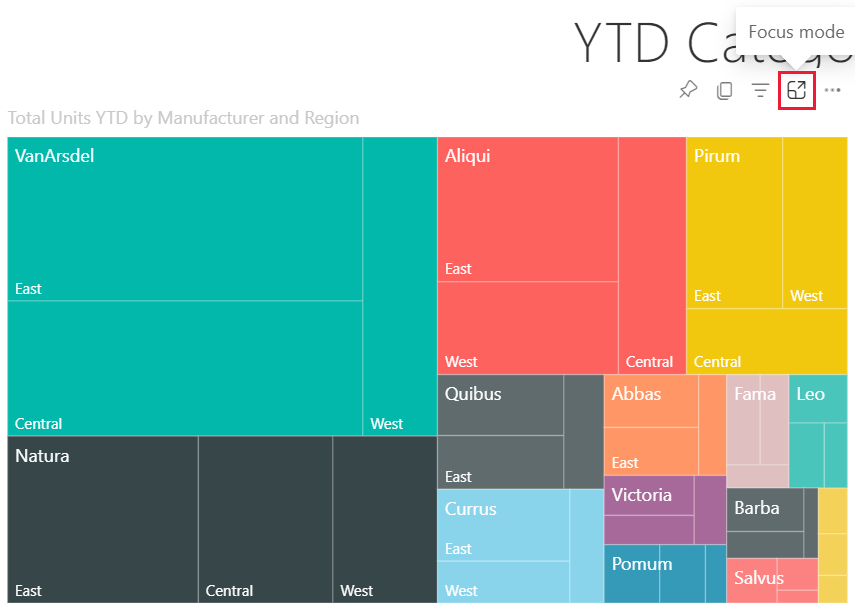
The visual opens and fills the entire canvas. Notice that your report canvas still has a Filters pane that you can use to interact with the visual. The Filters pane can be collapsed.
Explore further by modifying the filters and looking for interesting discoveries in your data. In reading view, you can't add new filters, change the fields being used in the visuals, or create new visuals. However, you can interact with the existing filters, cross-filter, pin, subscribe, comment, and much more.
For a dashboard tile, your changes can't be saved. For a report visual, any modifications you make to the existing filters are saved when you exit Power BI. If you don't want Power BI to remember your modifications, select the Reset to default button. 
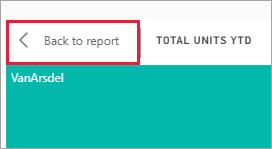
Leave focus mode and return to the dashboard or report by selecting either Exit focus mode or Back to report (in the upper left corner of the visual).

Considerations and troubleshooting
- When using focus mode with a visual in a report, you can view and interact with all filters: Visual level, Page level, Drillthrough, and Report level.
- When using focus mode with a visual on a dashboard, you can view and interact with only the Visual level filter.


