Tutorial: Create a basic table report (Report Builder)
You can use the Report Builder in SQL Server Reporting Services (SSRS) to create table reports for your SQL data. This tutorial shows you how to create a basic table report from sample sales data.
In this tutorial, you:
- Follow wizard steps to create a table report
- Identify an embedded source for the table data
- Run a query to get the data values
- Organize and format the table data, and add totals
- Design and save the report
- Review the exported report in Microsoft Excel
The estimated time to complete this tutorial is 20 minutes.
The following illustration shows the table report you create in this tutorial:

Prerequisites
For more information about requirements, see Prerequisites for tutorials (Report Builder).
Create report with Table or Matrix Wizard
You can create a table report by using the Table or Matrix wizard. The wizard has two design modes: Report and Shared dataset. In Report design mode, you specify data in the Report Data pane and configure the report layout on the design surface. In Shared dataset design mode, you create dataset queries to share with others. In this tutorial, you use Report design mode.
Start the wizard and create a basic table report:
Start Report Builder from your computer, the Reporting Services web portal, or SharePoint integrated mode.
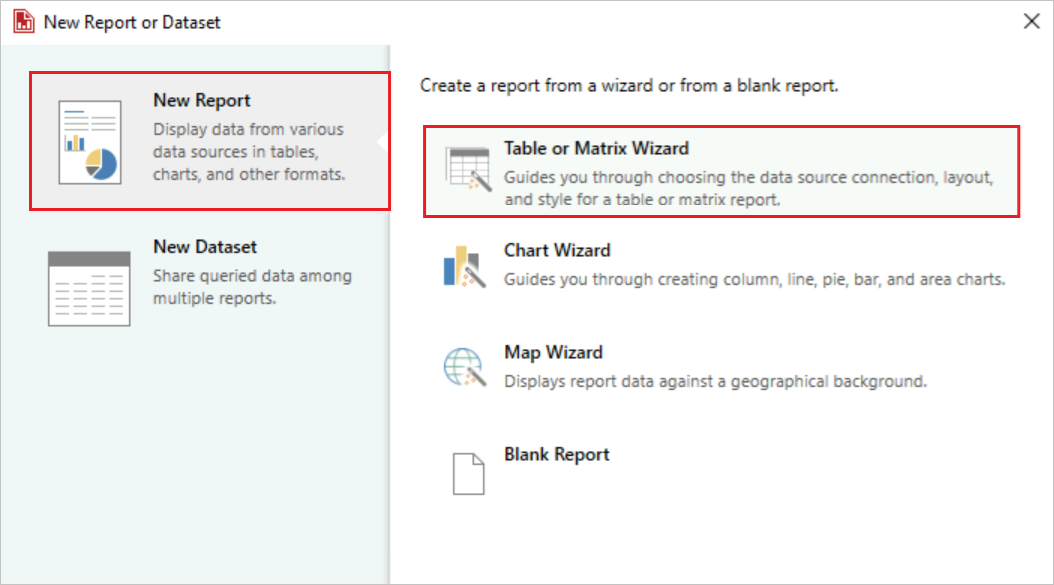
The New Report or Dataset dialog opens. If the dialog doesn't open, select File > New.
Select the New Report tab, and select Table or Matrix Wizard on the right pane:
Specify data connection
A data connection contains the information to connect to an external data source such as a SQL Server database. Usually, you get the connection information and the type of credentials to use from the data source owner. To specify a data connection, you can use a shared data source from the report server or create an embedded data source used only in this report.
In this tutorial, you use an embedded data source. To learn more about using a shared data source, see Alternative ways to get a data connection (Report Builder).
Create an embedded data source for the data connection:
On the Choose a dataset page, select the Create a dataset option, and then select Next.
On the Choose a connection to a data source page, select New.
On the Data Source Properties dialog, set the following properties on the General tab:
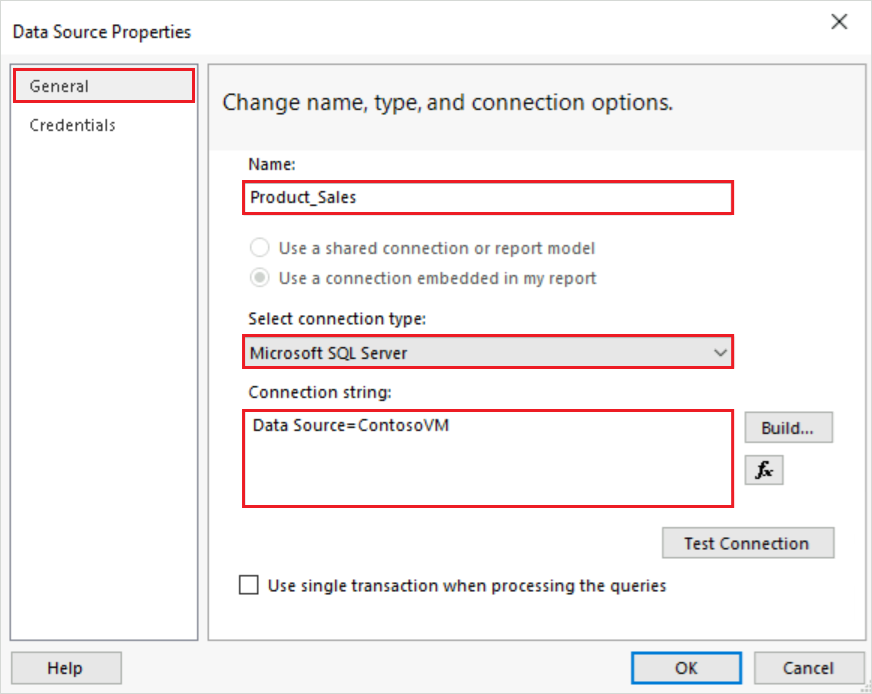
Set the Name property of the data source to Product_Sales.
For the Select a connection type property, confirm Microsoft SQL Server is selected.
For the Connection string property, enter the following value, where
<servername>is the name of an instance of SQL Server:Data Source=<servername>Because you use a query that contains the data instead of retrieving the data from a database, the connection string doesn't include the database name. For more information, see Prerequisites for tutorials (Report Builder).
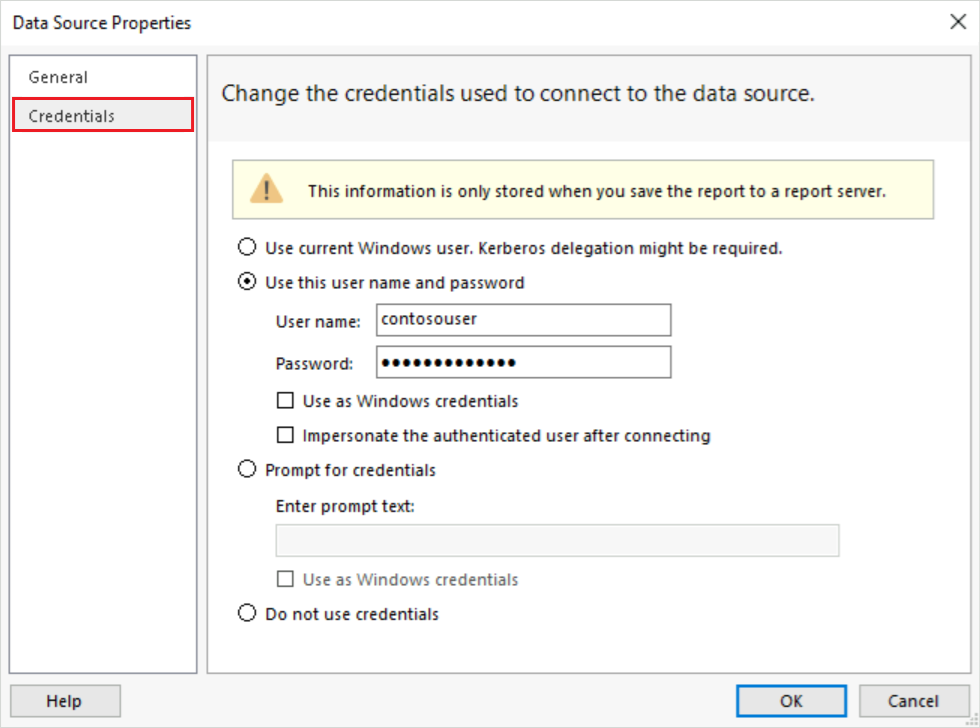
Switch to the Credentials tab, and select your preferred access method for the data source. Enter credentials, as needed:
On the General tab, select Test Connection to verify you can connect to the data source.
You should see a popup message: "Connection created successfully." Select OK to clear the popup message.
To complete the data source setup, select OK.
To continue in the wizard, select Next.
Create query
In a report, you can use a shared dataset that has a predefined query, or you can create an embedded dataset for use only in this specific report. In this tutorial, you create an embedded dataset.
Note
In the tutorial example, the query contains the data values, so it doesn't need an external data source. This approach makes the query quite long, but it's useful for learning purposes. In a standard business environment, the query doesn't contain the data values.
Create a query by following these steps:
On the Design a query page, the relational query designer is open. For this tutorial, you use the text-based query designer:
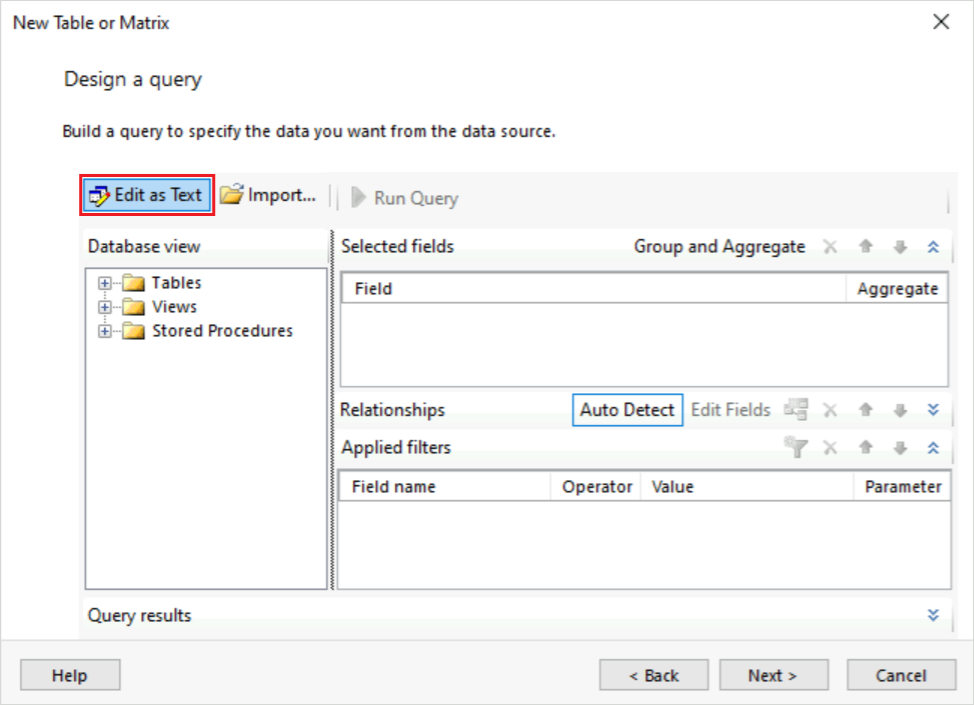
Select Edit As Text. The text-based query designer displays a query pane and a results pane.
Paste the following Transact-SQL query into the top field:
SELECT CAST('2009-01-05' AS date) as SalesDate, 'Accessories' as Subcategory,
   'Carrying Case' as Product, CAST(9924.60 AS money) AS Sales, 68 as Quantity
UNION SELECT CAST('2009-01-06' AS date) as SalesDate, 'Accessories' as Subcategory,
   'Tripod' as Product, CAST(1350.00 AS money) AS Sales, 18 as Quantity
UNION SELECT CAST('2009-01-11' AS date) as SalesDate, 'Accessories' as Subcategory,
   'Lens Adapter' as Product, CAST(1147.50 AS money) AS Sales, 17 as Quantity
UNION SELECT CAST('2009-01-05' AS date) as SalesDate, 'Accessories' as Subcategory,
   'Mini Battery Charger' as Product, CAST(1056.00 AS money) AS Sales, 44 as Quantity
UNION SELECT CAST('2009-01-06' AS date) as SalesDate,  'Accessories' as Subcategory,
   'Telephoto Conversion Lens' as Product, CAST(1380.00 AS money) AS Sales, 18 as Quantity
UNION SELECT CAST('2009-01-06' AS date) as SalesDate,'Accessories' as Subcategory,
   'USB Cable' as Product, CAST(780.00 AS money) AS Sales, 26 as Quantity
UNION SELECT CAST('2009-01-08' AS date) as SalesDate, 'Accessories' as Subcategory,
   'Budget Movie-Maker' as Product, CAST(3798.00 AS money) AS Sales, 9 as Quantity
UNION SELECT CAST('2009-01-09' AS date) as SalesDate, 'Camcorders' as Subcategory,
   'Business Videographer' as Product, CAST(10400.00 AS money) AS Sales, 13 as Quantity
UNION SELECT CAST('2009-01-10' AS date) as SalesDate, 'Camcorders' as Subcategory,
   'Social Videographer' as Product, CAST(3000.00 AS money) AS Sales, 60 as Quantity
UNION SELECT CAST('2009-01-11' AS date) as SalesDate,  'Digital' as Subcategory,
   'Advanced Digital' as Product, CAST(7234.50 AS money) AS Sales, 39 as Quantity
UNION SELECT CAST('2009-01-07' AS date) as SalesDate,  'Digital' as Subcategory,
   'Compact Digital' as Product, CAST(10836.00 AS money) AS Sales, 84 as Quantity
UNION SELECT CAST('2009-01-08' AS date) as SalesDate,  'Digital' as Subcategory,
   'Consumer Digital' as Product, CAST(2550.00 AS money) AS Sales, 17 as Quantity
UNION SELECT CAST('2009-01-05' AS date) as SalesDate, 'Digital' as Subcategory,
   'Slim Digital' as Product, CAST(8357.80 AS money) AS Sales, 44 as Quantity
UNION SELECT CAST('2009-01-09' AS date) as SalesDate, 'Digital SLR' as Subcategory,
   'SLR Camera 35mm' as Product, CAST(18530.00 AS money) AS Sales, 34 as Quantity
UNION SELECT CAST('2009-01-07' AS date) as SalesDate, 'Digital SLR' as Subcategory,
   'SLR Camera' as Product, CAST(26576.00 AS money) AS Sales, 88 as Quantity
On the query designer toolbar, select Run (!):
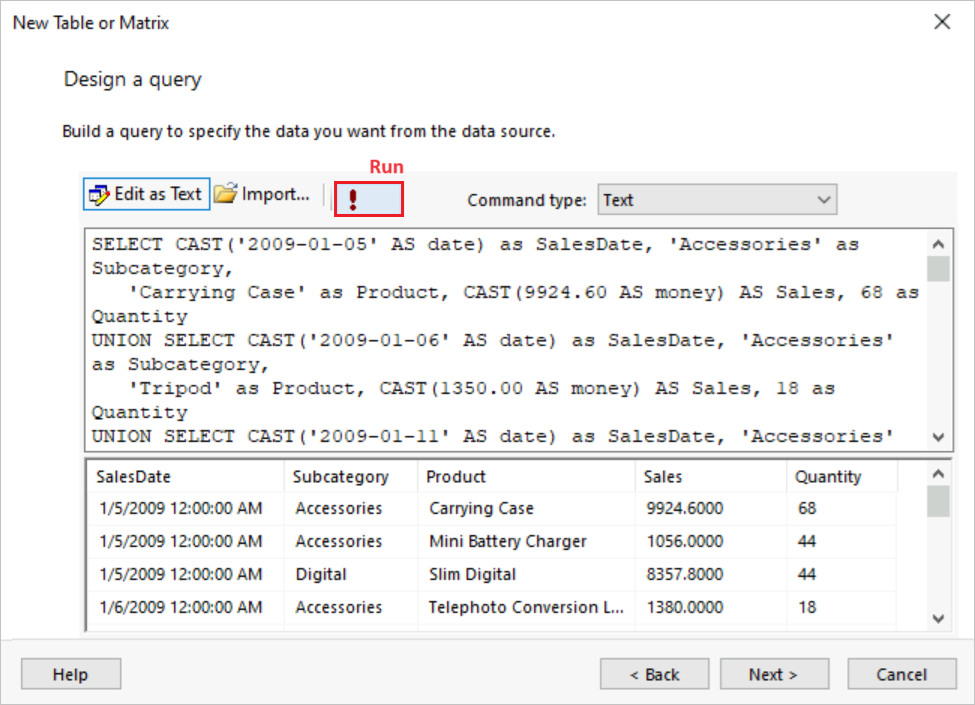
The query runs and displays the result set for the fields SalesDate, Subcategory, Product, Sales, and Quantity.
In the result set, the column headings are based on the names in the query. In the dataset, the column headings become the field names, and are saved in the report. After you complete the wizard, you can use the Report Data pane to view the collection of dataset fields.
To continue in the wizard, select Next.
Organize data into groups
When you select data fields to form groups, you design a table that has rows and columns that display detail data and aggregated data. In the following procedure, the first two steps specify the data values to display in the table and the last two steps organize the values.
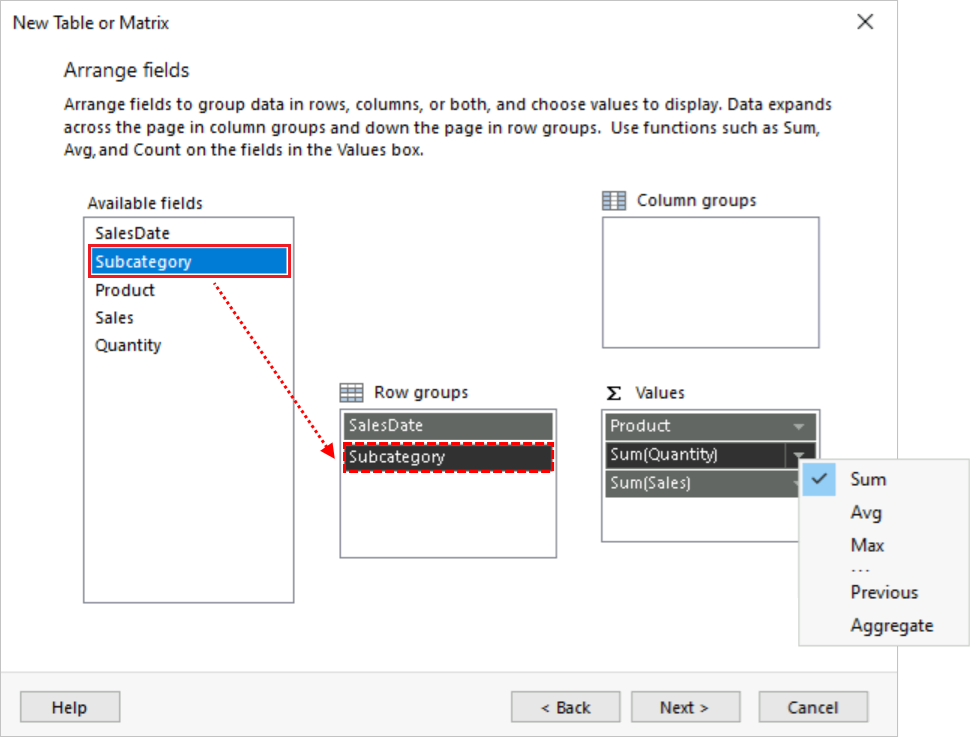
Organize table data into groups on the Arrange fields page:
From the Available fields box, drag the Product field and then the Quantity field to the Values box. Position the Quantity field after the Product field.
The Sum function automatically aggregates the Quantity data, which is the default aggregate for numeric fields. The value is [Sum(Quantity)].
Tip
You can select the dropdown arrow next to the [Sum(Quantity)] aggregate to view the other aggregate functions. For this exercise, leave the aggregate function set to Sum.
Drag the Sales field to the Values box and position it after the [Sum(Quantity)] aggregate.
The Sum function aggregates the Sales data. The value is [Sum(Sales)].
Drag the SalesDate field and then the Subcategory field to the Row groups box. Position the Subcategory field after the SalesDate field.
To continue in the wizard, select Next.
Add subtotal and total rows
After you create groups, you can add and format rows on which to display aggregate values for the fields. You can choose whether to show all the data or to allow the user to expand and collapse grouped data interactively.
Follow these steps to add subtotals and totals for the table data:
On the Choose the layout page, under Options, configure the following options:
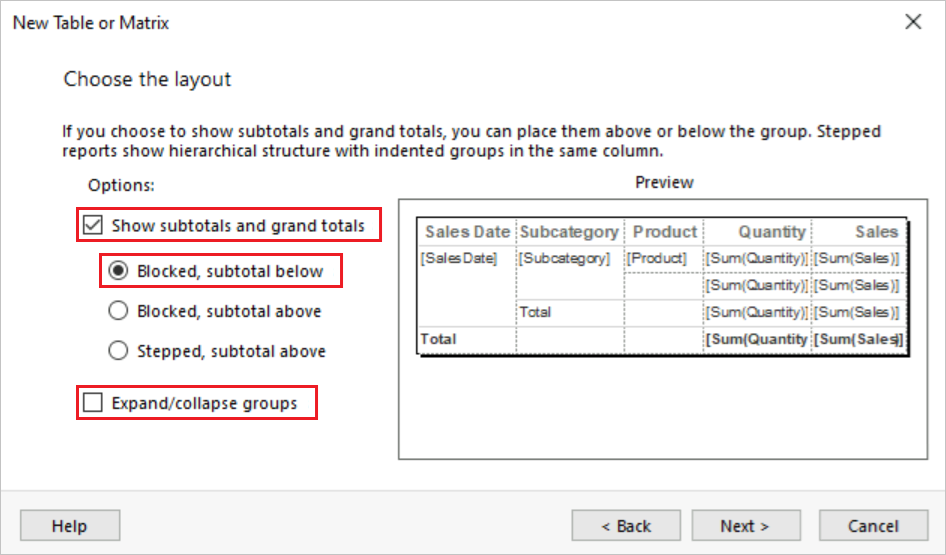
Select the Show subtotals and grand totals option.
Select the Blocked, subtotal below option.
Clear the Expand/collapse groups option.
In this tutorial, the report you create doesn't use the drilldown feature that lets users expand a parent group hierarchy and display child group rows and detail rows.
Select Next to check the table in the Preview pane. You should see five rows that demonstrate the table layout when you run the report:
The first row repeats once for the table to show the column headings.
The second row repeats once for each line item in the sales order to show the product name, order quantity, and line total.
The third row repeats once for each sales order category to show subtotals per category.
The fourth row repeats once for each order date to show the subtotals per day.
The fifth row repeats once for the table to show the grand totals.
Select Finish.
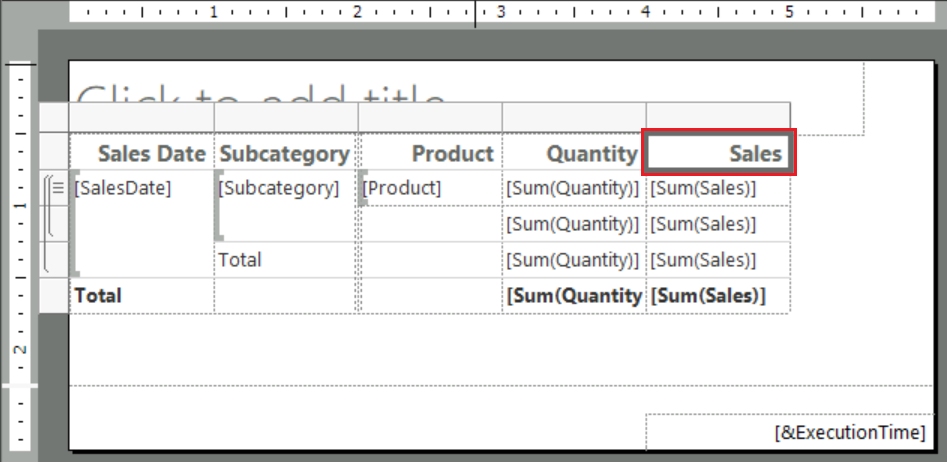
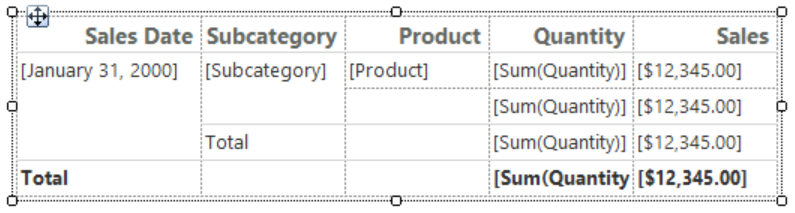
Report Builder adds your table to the design surface. The table has five columns and five rows. The Row Groups pane shows three row groups: SalesDate, Subcategory, and Details. Detail data is all the data that the dataset query retrieves.
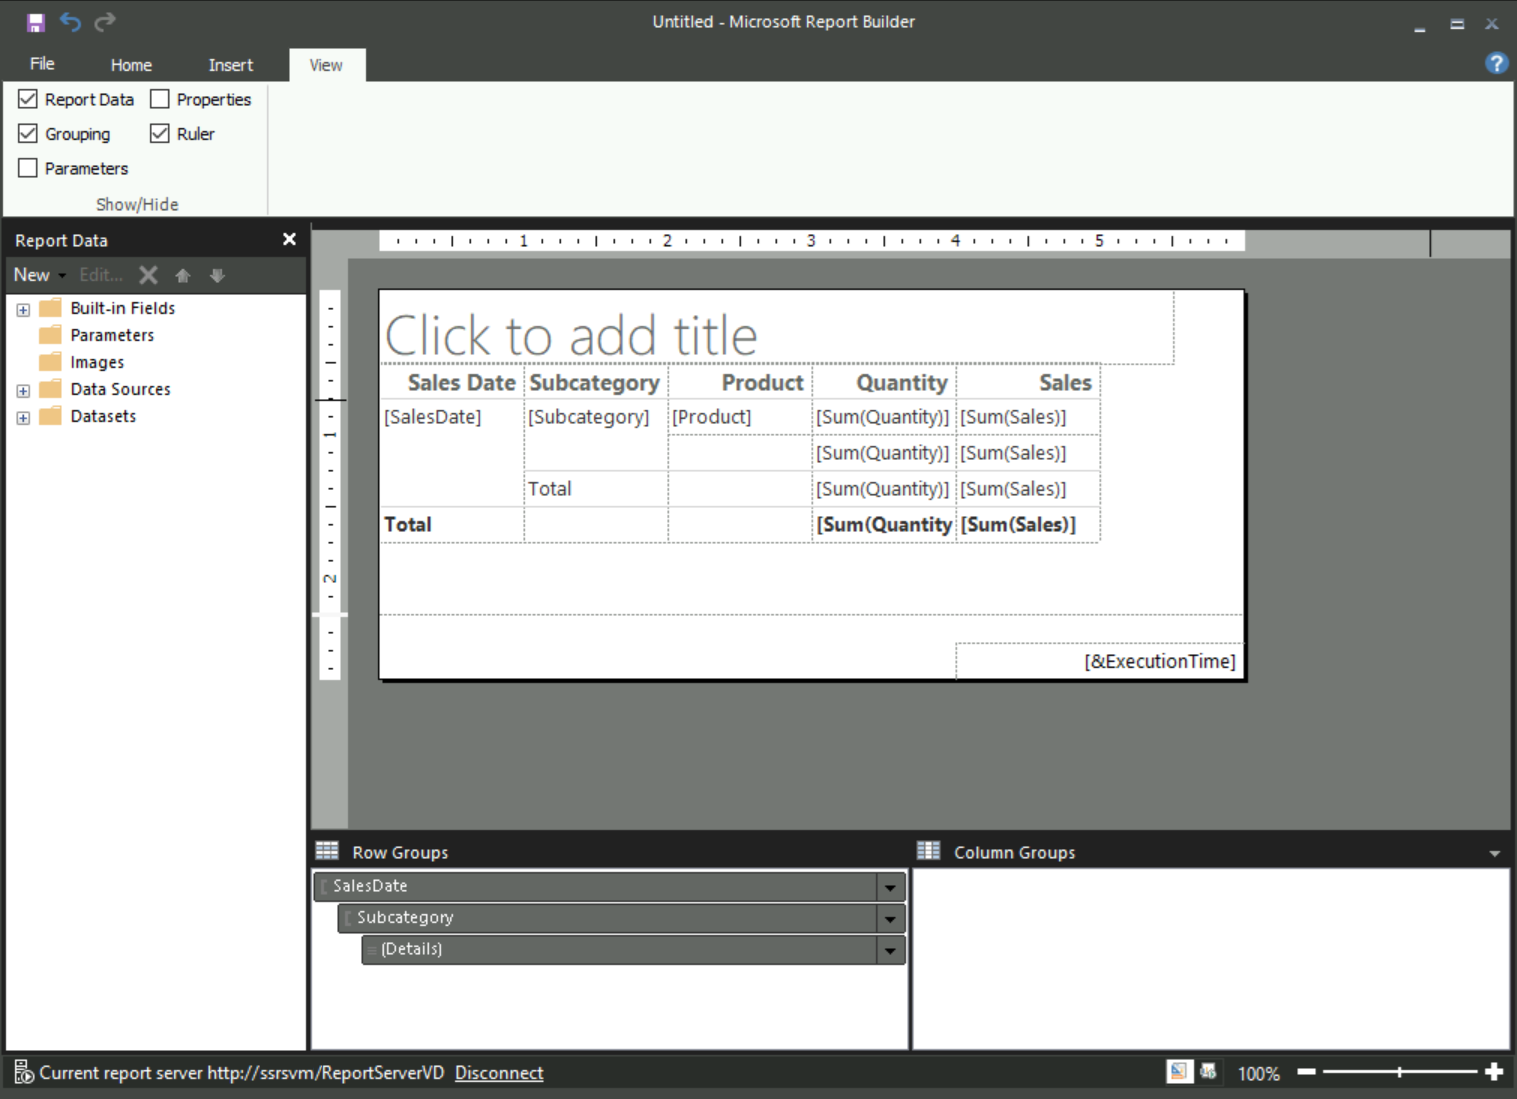

The wizard process is complete, and you now have a table report with sample data. In the following sections, you format specific table data to display values in a form that's useful for the reader.
Format table data
Report Builder displays table data values in the report by using default formats, such as numbers, dates, times, and so on. You can use the formatting features on the Home tab to change how table data displays.
It can be helpful to format monetary values in the local currency rather than as general numbers. Another scenario is for table data that summarizes changes in value over a short period of short time. It can be more useful to display the data only in minutes or hours, and not also show the month, day, and year.
The following sections demonstrate how to use the formatting features to change how table date displays in the report. The formatted text boxes and placeholder text are shown as sample values in Design View.
Show currency values
By default, the summary data for the Sales field displays as a general number in the table report. The value can be more properly expressed by applying the currency format.
Follow these steps to format table data as currency:
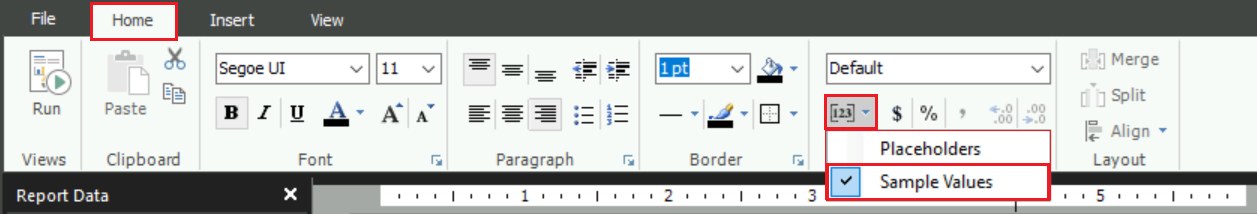
In Report Builder, select the Sales column header in your table report:
On the Home tab, in the Number group, select Placeholder Styles ([123]), and then select Sample Values:
In your table report, in the Sales column, multi-select the four cells that contain the
[Sum(Sales)]value.On the Home tab, in the Number group, select Currency ($). The selected cells change to show the data values by using the currency format.
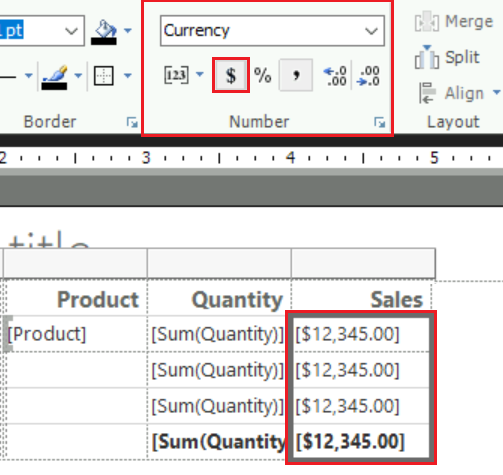
If your regional setting is English (United States), the default sample text shows the value in dollars
[$12,345.00].If you don't see an example currency value, check the placeholder style for the cells. On the Home tab, in the Number group, confirm the Placeholder Styles ([123]) option is set to Sample Values.
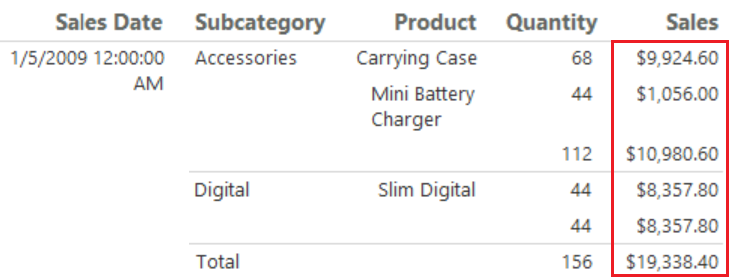
On the Home tab, select Run to preview your report.
Confirm the summary values in the Sales column display as currency. Here's an example from the report:
Show dates (month, day, year)
By default, the SalesDate field displays both date (month, day, year) and time (hour, minute, second) data. You can change the format of these values to show only the date.
Format the values to display the date only:
On the Run tab, select Design to return to design view.
In your table report, select the cell that contains the
[SalesDate]value.On the Home tab, in the Number group, expand the Format dropdown menu, and select Date:
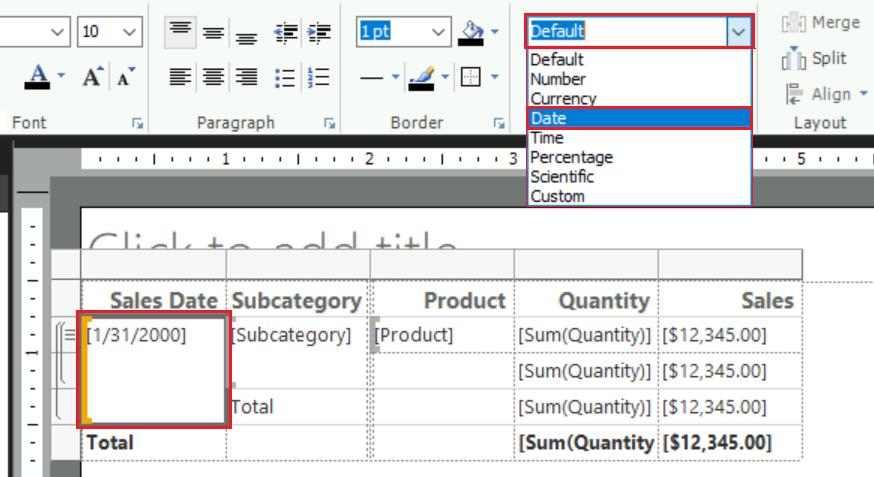
The cell displays the example date
[1/31/2000].If you don't see an example date value, check the placeholder style. On the Home tab, in the Number group, confirm the Placeholder Styles ([123]) option is set to Sample Values.
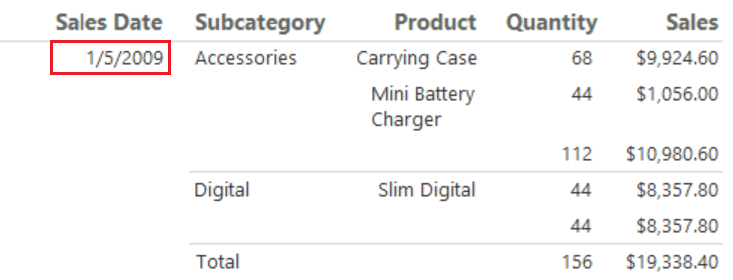
On the Home tab, select Run to preview your report.
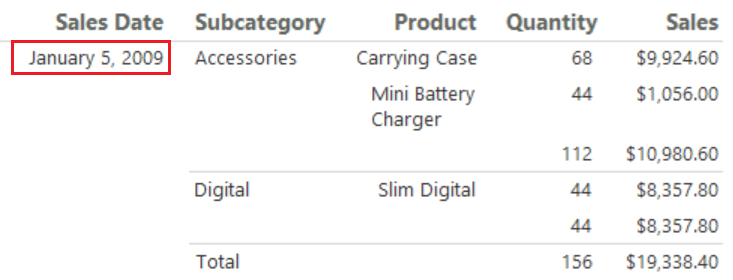
Confirm the values in the SalesDate column display as dates (month, day, year) only. Here's an example from the report:
Use custom date formats
You can also specify a custom format for a specific field in the table:
On the Run tab, select Design to return to design view.
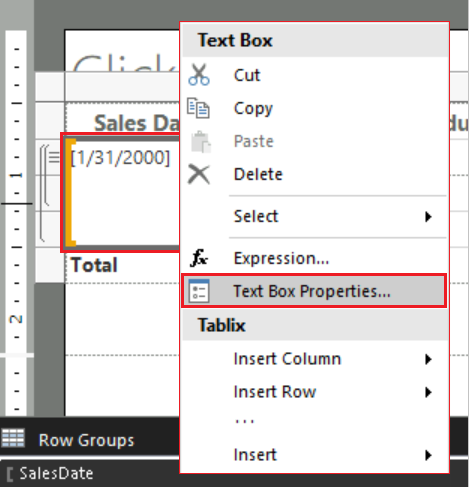
In your table report, go to the cell that previously contained the
[SalesDate]value.Right-click the cell and select Text Box Properties:
In the Text Box Properties dialog, configure the cell formatting:
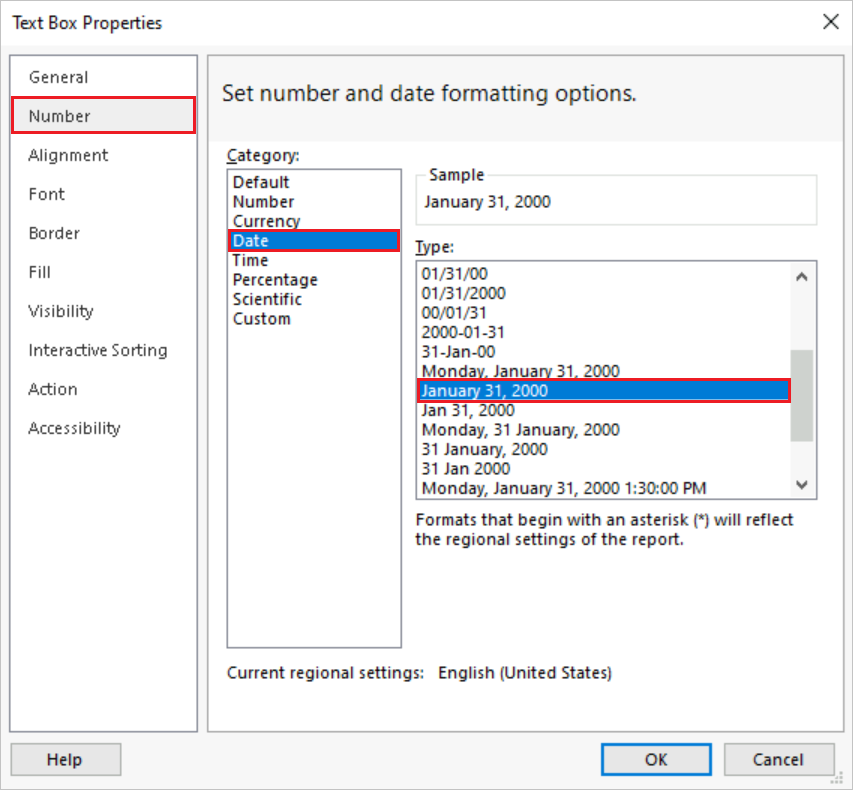
In the tab pane, select Number.
In the Category list, select Date.
In the Type list, select January 31, 2000.
The Sample section shows a preview of your formatting configuration.
Select OK to apply your custom formatting.
The table cell updates to display the example date
[January 31, 2000].On the Home tab, select Run to preview your report.
Confirm the values in the SalesDate column display the month name rather than the month number. Here's an example from the report:
Format the table
In addition to applying specific formats to the data in your table, you can also configure attributes of the entire, such as column width, row height, and the table title. The following sections demonstrate these procedures.
Change column width
By default, each cell in a table contains a text box. A text box expands vertically to accommodate the text when the page is rendered. In the rendered report, each row expands to the height of the tallest rendered text box in the row. The height of the row on the design surface has no effect on the height of the row in the rendered report.
To reduce the amount of vertical space for each row, you can expand the column width to accommodate the expected contents of the text boxes in the column on a single line.
Follow these steps to change the width of the table columns:
On the Run tab, select Design to return to design view.
On the design surface, select in your table to display the row and column handles. The handles appear as gray bars along the edges of the table.
Hold and drag the handles to increase the table width.
Tip
You can expand the width of the design surface to increase the visible area for working on your table. When the table is wider than the design surface, you need to use scroll bars to view the full table.
Point to the line between the Subcategory and Product columns to display the double arrow cursor.

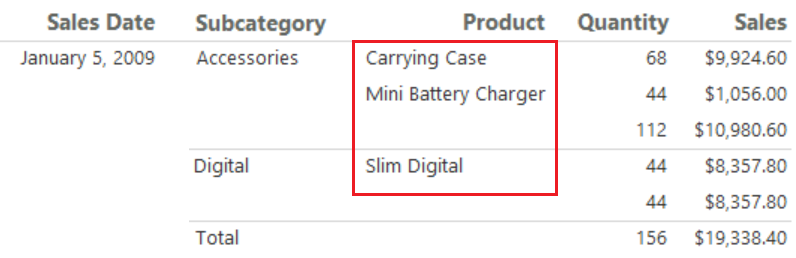
Select and drag the line to increase the width for the Product column. Increase the width so product names in the column display on a single line in the rendered report.
On the Home tab, select Run to preview your report.
Confirm the values in the Product column display on a single line. Here's an example from the report:
Customize report title
A report title appears at the top of the report. You can place the report title in a report header. If the report doesn't use a header, you can place the title in a text box at the top of the report body. In this tutorial, you use the text box that is automatically placed at the top of the report body.
There are many ways you can customize the report title, such as using different font style, text sizes, and colors. Portions of the title and even individual characters can use separate formatting. For more information, see Format text in a text box in paginated reports (Report Builder).
Follow these steps to customize your report title:
On the Run tab, select Design to return to design view.
On the design surface, select the Click to add title text box:

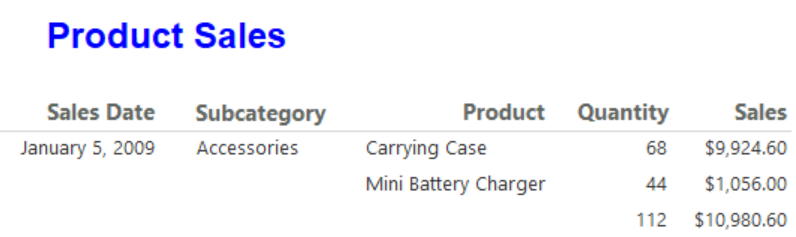
In the Click to add title text box, enter the text Product Sales, and then select outside the text box.
Right-click the text box and select Text Box Properties.
In the Text Box Properties dialog, configure the text formatting:
In the tab pane, select Font.
In the Font list, select Arial.
In the Size list, select 18pt.
In the Color list, select Blue.
For the Style, select Bold.
The Sample section shows a preview of your formatting configuration.
Select OK to apply the title formatting.
On the Home tab, select Run to preview your report.
Confirm the table shows the updated title:
Save the report
Save the report to a report server or your computer. If you don't save the report to the report server, many Reporting Services features such as subreports aren't available.
Follow these steps to save the report on a report server:
Select File > Save As.
In the Save As Report dialog, select Recent Sites and Servers in the right pane.
Select or enter the name of the report server where you have permission to save reports.
The message "Connecting to report server" appears. When the connection completes, the default report folder opens. The report server administrator specifies the default folder location.
For the report Name, replace the default value Untitled with Product_Sales.
Select Save.
The report is saved to the report server. The status bar at the bottom of the window shows the name of the report server that you're connected to.
Save the report on your computer
You can also save the report on your computer:
Select File > Save As.
Select Desktop, My Documents, or My computer, and browse to the folder where you want to save the report.
For the report Name, replace the default value Untitled with Product_Sales.
Select Save.
Export the report
Reports can be exported to different formats, such as Microsoft Excel and comma separated value (CSV) files. For more information, see Export paginated reports (Report Builder).
In this tutorial, you export the report to Excel and set a property on the report to provide a custom name for the workbook tab.
Set Excel workbook tab name
Follow these steps to specify the Excel workbook tab name:
Select Design to return to design view.
Select the View tab, and select Properties to expose the Properties pane.
Select anywhere on the design surface, but outside the table report.
The items listed in the Properties pane correspond to where you select on the design surface. For this procedure, you want to select outside the report area.
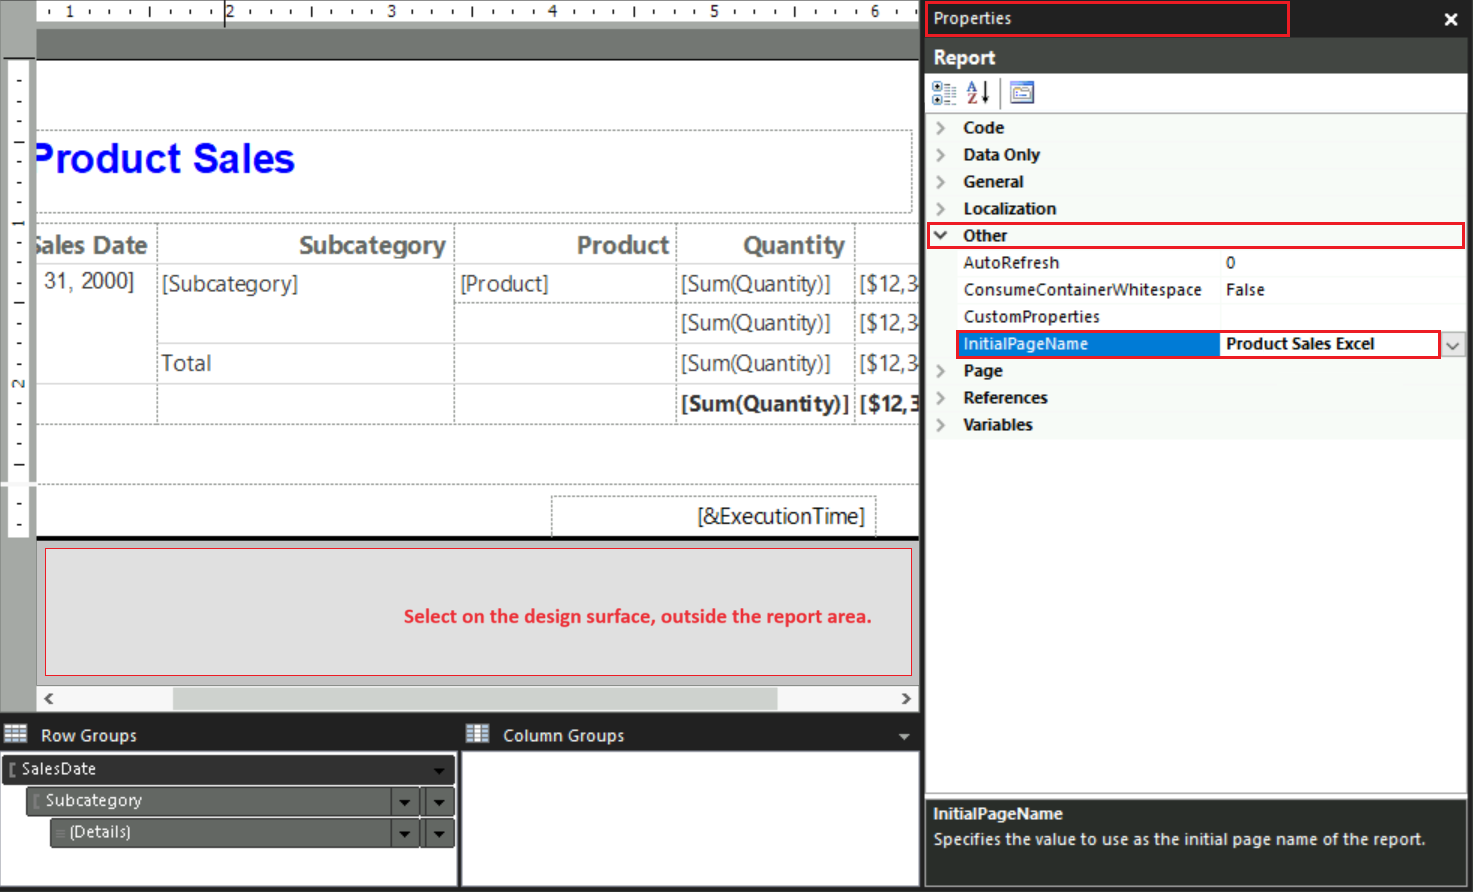
In the Properties pane, expand the Other group, and locate the InitialPageName property.
Tip
If you don't see a property in the Properties pane, select Alphabetical at the top of the pane to order all properties alphabetically.
For the InitialPageName property, enter the workbook tab name Product Sales Excel.

Export your report to Excel
Export your report to Excel with these steps:
On the Home tab, select Run to preview your report.
On the toolbar, select Export > Excel.
In the Save As dialog, browse to where you want to save the file.
For the File name, enter Product_Sales_Excel.
Verify that the file type is Excel (*.xlsx).
Select Save.
View the report in Excel
Now you can view your table report in Excel:
Open the folder where you saved the workbook, and double-click the file, Product_Sales_Excel.xlsx.
Verify the name of the workbook tab is Product Sales Excel.
Related content
משוב
בקרוב: במהלך 2024, נפתור בעיות GitHub כמנגנון המשוב לתוכן ונחליף אותו במערכת משוב חדשה. לקבלת מידע נוסף, ראה: https://aka.ms/ContentUserFeedback.
שלח והצג משוב עבור