ערוך

שתף באמצעות


Walkthrough: Debugging a Parallel Application in Visual Studio (C#, Visual Basic, C++)

This walkthrough shows how to use the Parallel Tasks and Parallel Stacks windows to debug a parallel application. These windows help you understand and verify the run-time behavior of code that uses the Task Parallel Library (TPL) or the Concurrency Runtime. This walkthrough provides sample code that has built-in breakpoints. After the code breaks, the walkthrough shows how to use the Parallel Tasks and Parallel Stacks windows to examine it.

This walkthrough teaches these tasks:

  • How to view the call stacks of all threads in one view.

  • How to view the list of System.Threading.Tasks.Task instances that are created in your application.

  • How to view the real call stacks of tasks instead of threads.

  • How to navigate to code from the Parallel Tasks and Parallel Stacks windows.

  • How the windows cope with scale through grouping, zooming, and other related features.

Prerequisites

This walkthrough assumes that Just My Code is enabled (it's enabled by default in more recent versions of Visual Studio). On the Tools menu, select Options, expand the Debugging node, select General, and then select Enable Just My Code (Managed only). If you don't set this feature, you can still use this walkthrough, but your results might differ from the illustrations.

C# sample

If you use the C# sample, this walkthrough also assumes that External Code is hidden. To toggle whether external code is displayed, right-click the Name table header of the Call Stack window, and then select or clear Show External Code. If you don't set this feature, you can still use this walkthrough, but your results might differ from the illustrations.

C++ sample

If you use the C++ sample, you can ignore references to External Code in this article. External Code only applies to the C# sample.

Illustrations

The illustrations in this article are recorded on a quad core computer running the C# sample. Although you can use other configurations to complete this walkthrough, the illustrations might differ from what is displayed on your computer.

Create the sample project

The sample code in this walkthrough is for an application that does nothing. The purpose of the exercise is to understand how to use the tool windows to debug a parallel application.

  1. Open Visual Studio and create a new project.

    If the start window isn't open, choose File > Start Window.

    On the start window, choose New project.

    On the start window, choose Create a new project.

    On the Create a new project window, enter or type console in the search box. Next, choose C#, C++, or Visual Basic from the Language list, and then choose Windows from the Platform list.

    After you apply the language and platform filters, choose the Console App for .NET Core or C++, and then choose Next.

    Note

    If you don't see the correct template, go to Tools > Get Tools and Features..., which opens the Visual Studio Installer. Choose the .NET desktop development or Desktop development with C++ workload, then choose Modify.

    In the Configure your new project window, type a name or use the default name in the Project name box. Then, choose Next or Create, whichever option is available.

    For .NET Core, choose either the recommended target framework or .NET 8, and then choose Create.

    A new console project appears. After the project has been created, a source file appears.

  2. Open the .cpp, .cs, or .vb code file in the project. Delete its contents to create an empty code file.

  3. Paste the following code for your chosen language into the empty code file.

    using System;
    using System.Threading;
    using System.Threading.Tasks;
    using System.Diagnostics;
    
    class S
    {
      static void Main()
      {
        pcount = Environment.ProcessorCount;
        Console.WriteLine("Proc count = " + pcount);
        ThreadPool.SetMinThreads(4, -1);
        ThreadPool.SetMaxThreads(4, -1);
    
        t1 = new Task(A, 1);
        t2 = new Task(A, 2);
        t3 = new Task(A, 3);
        t4 = new Task(A, 4);
        Console.WriteLine("Starting t1 " + t1.Id.ToString());
        t1.Start();
        Console.WriteLine("Starting t2 " + t2.Id.ToString());
        t2.Start();
        Console.WriteLine("Starting t3 " + t3.Id.ToString());
        t3.Start();
        Console.WriteLine("Starting t4 " + t4.Id.ToString());
        t4.Start();
    
        Console.ReadLine();
      }
    
      static void A(object o)
      {
        B(o);
      }
      static void B(object o)
      {
        C(o);
      }
      static void C(object o)
      {
        int temp = (int)o;
    
        Interlocked.Increment(ref aa);
        while (aa < 4)
        {
          ;
        }
    
        if (temp == 1)
        {
          // BP1 - all tasks in C
          Debugger.Break();
          waitFor1 = false;
        }
        else
        {
          while (waitFor1)
          {
            ;
          }
        }
        switch (temp)
        {
          case 1:
            D(o);
            break;
          case 2:
            F(o);
            break;
          case 3:
          case 4:
            I(o);
            break;
          default:
            Debug.Assert(false, "fool");
            break;
        }
      }
      static void D(object o)
      {
        E(o);
      }
      static void E(object o)
      {
        // break here at the same time as H and K
        while (bb < 2)
        {
          ;
        }
        //BP2 - 1 in E, 2 in H, 3 in J, 4 in K
        Debugger.Break();
        Interlocked.Increment(ref bb);
    
        //after
        L(o);
      }
      static void F(object o)
      {
        G(o);
      }
      static void G(object o)
      {
        H(o);
      }
      static void H(object o)
      {
        // break here at the same time as E and K
        Interlocked.Increment(ref bb);
        Monitor.Enter(mylock);
        while (bb < 3)
        {
          ;
        }
        Monitor.Exit(mylock);
    
    
        //after
        L(o);
      }
      static void I(object o)
      {
        J(o);
      }
      static void J(object o)
      {
        int temp2 = (int)o;
    
        switch (temp2)
        {
          case 3:
            t4.Wait();
            break;
          case 4:
            K(o);
            break;
          default:
            Debug.Assert(false, "fool2");
            break;
        }
      }
      static void K(object o)
      {
        // break here at the same time as E and H
        Interlocked.Increment(ref bb);
        Monitor.Enter(mylock);
        while (bb < 3)
        {
          ;
        }
        Monitor.Exit(mylock);
    
    
        //after
        L(o);
      }
      static void L(object oo)
      {
        int temp3 = (int)oo;
    
        switch (temp3)
        {
          case 1:
            M(oo);
            break;
          case 2:
            N(oo);
            break;
          case 4:
            O(oo);
            break;
          default:
            Debug.Assert(false, "fool3");
            break;
        }
      }
      static void M(object o)
      {
        // breaks here at the same time as N and Q
        Interlocked.Increment(ref cc);
        while (cc < 3)
        {
          ;
        }
        //BP3 - 1 in M, 2 in N, 3 still in J, 4 in O, 5 in Q
        Debugger.Break();
        Interlocked.Increment(ref cc);
        while (true)
          Thread.Sleep(500); // for ever
      }
      static void N(object o)
      {
        // breaks here at the same time as M and Q
        Interlocked.Increment(ref cc);
        while (cc < 4)
        {
          ;
        }
        R(o);
      }
      static void O(object o)
      {
        Task t5 = Task.Factory.StartNew(P, TaskCreationOptions.AttachedToParent);
        t5.Wait();
        R(o);
      }
      static void P()
      {
        Console.WriteLine("t5 runs " + Task.CurrentId.ToString());
        Q();
      }
      static void Q()
      {
        // breaks here at the same time as N and M
        Interlocked.Increment(ref cc);
        while (cc < 4)
        {
          ;
        }
        // task 5 dies here freeing task 4 (its parent)
        Console.WriteLine("t5 dies " + Task.CurrentId.ToString());
        waitFor5 = false;
      }
      static void R(object o)
      {
        if ((int)o == 2)
        {
          //wait for task5 to die
          while (waitFor5) { ;}
    
    
          int i;
          //spin up all procs
          for (i = 0; i < pcount - 4; i++)
          {
            Task t = Task.Factory.StartNew(() => { while (true);});
            Console.WriteLine("Started task " + t.Id.ToString());
          }
    
          Task.Factory.StartNew(T, i + 1 + 5, TaskCreationOptions.AttachedToParent); //scheduled
          Task.Factory.StartNew(T, i + 2 + 5, TaskCreationOptions.AttachedToParent); //scheduled
          Task.Factory.StartNew(T, i + 3 + 5, TaskCreationOptions.AttachedToParent); //scheduled
          Task.Factory.StartNew(T, i + 4 + 5, TaskCreationOptions.AttachedToParent); //scheduled
          Task.Factory.StartNew(T, (i + 5 + 5).ToString(), TaskCreationOptions.AttachedToParent); //scheduled
    
          //BP4 - 1 in M, 2 in R, 3 in J, 4 in R, 5 died
          Debugger.Break();
        }
        else
        {
          Debug.Assert((int)o == 4);
          t3.Wait();
        }
      }
      static void T(object o)
      {
        Console.WriteLine("Scheduled run " + Task.CurrentId.ToString());
      }
      static Task t1, t2, t3, t4;
      static int aa = 0;
      static int bb = 0;
      static int cc = 0;
      static bool waitFor1 = true;
      static bool waitFor5 = true;
      static int pcount;
      static S mylock = new S();
    }
    

After you update the code file, save your changes and build the solution.

  1. On the File menu, select Save All.

  2. On the Build menu, select Rebuild Solution.

Notice there are four calls to Debugger.Break (DebugBreak in the C++ sample). Therefore, you don't have to insert breakpoints. Just running the application causes it to break in the debugger up to four times.

Use the Parallel Stacks Window: Threads View

To begin, on the Debug menu, select Start Debugging. Wait until the first breakpoint is hit.

View the call stack of a single thread

  1. On the Debug menu, point to Windows and then select Threads. Dock the Threads window at the bottom of Visual Studio.

  2. On the Debug menu, point to Windows and then select Call Stack. Dock the Call Stack window at the bottom Visual Studio.

  3. Double-click a thread in the Threads window to make it current. Current threads have a yellow arrow. When you change the current thread, its call stack is displayed in the Call Stack window.

Examine the Parallel Stacks window

On the Debug menu, point to Windows and then select Parallel Stacks. Make sure that Threads is selected in the box at the upper-left corner.

By using the Parallel Stacks window, you can view multiple call stacks at the same time in one view. The following illustration shows the Parallel Stacks window above the Call Stack window.

Screenshot of Threads view in Parallel Stacks window.

Threads view in Parallel Stacks window

The call stack of the Main thread appears in one box and the call stacks for the other four threads are grouped in another box. Four threads are grouped together because their stack frames share the same method contexts; that is, they are in the same methods: A, B, and C. To view the thread IDs and names of the threads that share the same box, hover over the box with the header ([#] Threads). The current thread is displayed in bold.

Screenshot of Tooltip that shows thread IDs and names.

Tooltip that shows thread IDs and names

The yellow arrow indicates the active stack frame of the current thread.

You can set how much detail to show for the stack frames (Module Names, Parameter Types, Parameter Names, Parameter Values, Line Numbers and Byte Offsets) by right-clicking in the Call Stack window.

A blue highlight around a box indicates that the current thread is part of that box. The current thread is also indicated by the bold stack frame in the tooltip. If you double-click the Main thread in the Threads window, you can observe that the highlight arrow in the Parallel Stacks window moves accordingly.

Screenshot of Highlighted main thread in Parallel Stacks window.

Highlighted main thread in Parallel Stacks window

Resume execution until the second breakpoint

To resume execution until the second breakpoint is hit, on the Debug menu, select Continue. The following illustration shows the thread tree at the second breakpoint.

Screenshot of Parallel Stacks window that shows many branches.

Parallel Stacks window that shows many branches

At the first breakpoint, four threads all went from S.A to S.B to S.C methods. That information is still visible in the Parallel Stacks window, but the four threads have progressed further. One of them continued to S.D and then S.E. Another continued to S.F, S.G, and S.H. Two others continued to S.I and S.J, and from there one of them went to S.K and the other continued to nonuser External Code.

You can hover over stack frames to see thread IDs plus other frame details. The blue highlight indicates the current thread and the yellow arrow indicates the active stack frame of the current thread.

You can hover over the box header, for example, 1 Thread or 2 Threads, to see the thread IDs of the threads. You can hover over stack frames to see thread IDs plus other frame details. The blue highlight indicates the current thread and the yellow arrow indicates the active stack frame of the current thread.

The cloth-threads icon (interweaved lines) indicates the active stack frames of the noncurrent threads. In the Call Stack window, double-click S.B to switch frames. The Parallel Stacks window indicates the current stack frame of the current thread by using a curved arrow icon.

Note

For a description of all the icons in the Parallel Stacks window, see Using the Parallel Stacks window.

In the Threads window, switch between threads and observe that the view in the Parallel Stacks window is updated.

You can switch to another thread, or to another frame of another thread, by using the shortcut menu in the Parallel Stacks window. For example, right-click S.J, point to Switch To Frame, and then select a command.

Screenshot of Parallel Stacks Path of Execution.

Parallel Stacks Path of Execution

Right-click S.C and point to Switch To Frame. One of the commands has a check mark that indicates the stack frame of the current thread. You can switch to that frame of the same thread (only the curved arrow moves) or you can switch to the other thread (the blue highlight also moves). The following illustration shows the submenu.

Screenshot of Stacks menu with 2 options on C while J is current.

Stacks menu with 2 options on C while J is current

When a method context is associated with just one stack frame, the box header displays 1 Thread and you can switch to it by double-clicking. If you double-click a method context that has more than 1 frame associated with it, then the menu automatically pops up. As you hover over the method contexts, notice the black triangle at the right. Clicking that triangle also displays the shortcut menu.

For large applications that have many threads, you might want to focus on just a subset of threads. The Parallel Stacks window can display call stacks only for flagged threads. To flag threads, use the shortcut menu or the first cell of a thread.

On the toolbar, select the Show Only Flagged button next to the list box.

Screenshot of Parallel Stacks window and tooltip.

Parallel Stacks window and tooltip

Now, only flagged threads show up in the Parallel Stacks window.

Resume execution until the third breakpoint

  1. To resume execution until the third breakpoint is hit, on the Debug menu, select Continue.

    When multiple threads are in the same method but the method wasn't at the beginning of the call stack, the method appears in different boxes. An example at the current breakpoint is S.L, which has three threads in it and appears in three boxes. Double-click S.L.

    Screenshot of Execution path in Parallel Stacks window.

    Execution path in Parallel Stacks window

    Notice that S.L is bold in the other two boxes so that you can see where else it appears. If you want to see which frames call into S.L and which frames it calls, select the Toggle Method View button on the toolbar. The following illustration shows the method view of The Parallel Stacks window.

    Screenshot of Method view in Parallel Stacks window.

    Method view in Parallel Stacks window

    Notice how the diagram pivoted on the selected method and positioned it in its own box in the middle of the view. The callees and callers appear on the top and bottom, respectively. Select the Toggle Method View button again to leave this mode.

    The shortcut menu of the Parallel Stacks window also has the following other items.

    • Hexadecimal Display toggles the numbers in the tooltips between decimal and hexadecimal.

    • Symbol Settings open the respective dialog boxes.

    • Show Threads in Source toggles the display of thread markers in your source code, which shows the location of threads in your source code.

    • Show External Code displays all the frames even if they aren't in user code. Try it to see the diagram expand to accommodate the other frames (which might be dimmed because you don't have symbols for them).

  2. In the Parallel Stacks window, make sure that the Auto Scroll to Current Stack Frame button on the toolbar is on.

    When you have large diagrams and you step to the next breakpoint, you might want the view to auto scroll to the active stack frame of the current thread; that is, the thread that hit the breakpoint first.

  3. Before you continue, in the Parallel Stacks window, scroll all the way to the left and all the way down.

Resume execution until the fourth breakpoint

  1. To resume execution until the fourth breakpoint is hit, on the Debug menu, select Continue.

    Notice how the view autoscrolled into place. Switch threads in the Threads window or switch stack frames in the Call Stack window and notice how the view always autoscrolls to the correct frame. Turn off Auto Scroll to Current Tool Frame option and view the difference.

    The Bird's Eye View also helps with large diagrams in the Parallel Stacks window. By default, the Bird's Eye View is on. But you can toggle it by clicking the button between the scroll bars on the lower-right corner of the window, as shown in the following illustration.

    Screenshot of Birds eye view in Parallel Stacks window.

    Bird's-eye view in Parallel Stacks window

    In bird's eye view, you can move the rectangle to quickly pan around the diagram.

    Another way to move the diagram in any direction is to select a blank area of the diagram and drag it where you want it.

    To zoom in and out of the diagram, press and hold CTRL while you move the mouse wheel. Alternatively, select the Zoom button on the toolbar and then use the Zoom tool.

    You can also view the stacks in a top-down direction instead of bottom-up, by clicking the Tools menu, clicking Options, and then select or clear the option under the Debugging node.

  2. Before you continue, on the Debug menu, select Stop Debugging to end execution.

Use the Parallel Tasks Window and the Tasks View of the Parallel Stacks window

We recommended that you complete the earlier procedures before you continue.

Restart the application until the first breakpoint is hit:

  1. On the Debug menu, select Start Debugging and wait for the first breakpoint to be hit.

  2. On the Debug menu, point to Windows and then select Threads. Dock the Threads window at the bottom of Visual Studio.

  3. On the Debug menu, point to Windows and select Call Stack. Dock the Call Stack window at the bottom of Visual Studio.

  4. Double-click a thread in the Threads window to make it current. Current threads have the yellow arrow. When you change the current thread, the other windows are updated. Next, we examine tasks.

  5. On the Debug menu, point to Windows, and then select Tasks. The following illustration shows the Tasks window.

    Screenshot of Four running tasks in Tasks window.

    Four running tasks in Tasks window

    For each running Task, you can read its ID, which is returned by the same-named property, the ID and name of the thread that runs it, its location (hovering over that displays a tooltip that has the whole call stack). Also, under the Task column, you can see the method that was passed into the task; in other words, the starting point.

    You can sort any column. Notice the sort glyph that indicates the sort column and direction. You can also reorder the columns by dragging them left or right.

    The yellow arrow indicates the current task. You can switch tasks by double-clicking a task or by using the shortcut menu. When you switch tasks, the underlying thread becomes current and the other windows are updated.

    When you manually switch from one task to another, the arrow outline indicates the current debugger context for a noncurrent task.

    When you manually switch from one task to another, the yellow arrow moves, but a white arrow still shows the task that caused the debugger to break.

Resume execution until the second breakpoint

To resume execution until the second breakpoint is hit, on the Debug menu, select Continue.

Previously, the Status column showed all tasks as Active, but now two of the tasks are Blocked. Tasks can be blocked for many different reasons. In the Status column, hover over a waiting task to learn why it's blocked. For example, in the following illustration, task 11 is waiting on task 12.

Screenshot of Two waiting tasks in Tasks window.

Previously, the Status column showed all tasks as Active, but now two of the tasks are Blocked. Tasks can be blocked for many different reasons. In the Status column, hover over a waiting task to learn why it's blocked. For example, in the following illustration, task 4 is waiting on task 5.

Two waiting tasks in Tasks window

Task 4, in turn, is waiting on a monitor owned by the thread assigned to task 2. (Right-click the header row and choose Columns > Thread Assignment to view the thread assignment value for task 2).

Waiting task and tooltip in Tasks window

You can flag a task by clicking the flag in the first column of the Tasks window.

You can use flagging to track tasks between different breakpoints in the same debugging session or to filter for tasks whose call stacks are shown in the Parallel Stacks window.

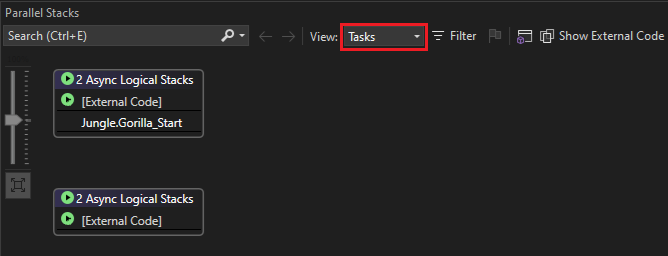
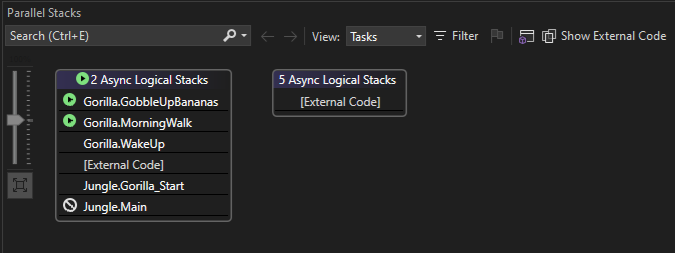
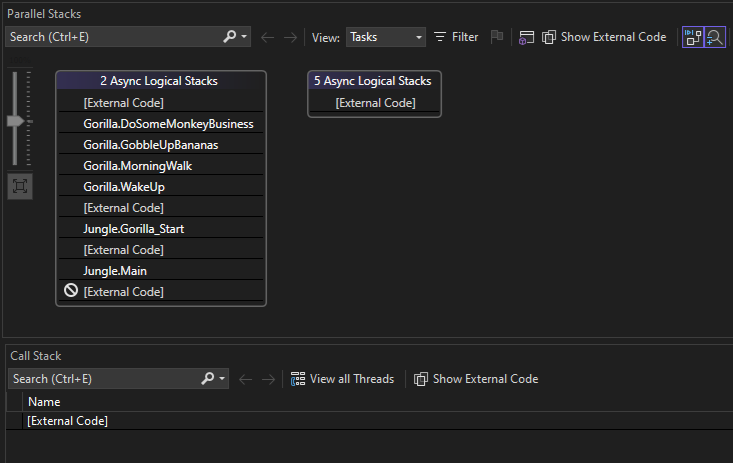
When you used the Parallel Stacks window earlier, you viewed the application threads. View the Parallel Stacks window again, but this time view the application tasks. Do this by selecting Tasks in the box on the upper left. The following illustration shows the Tasks View.

Screenshot of Tasks view in Parallel Stacks window.

Tasks view in Parallel Stacks window

Threads that aren't currently executing tasks aren't shown in the Tasks View of the Parallel Stacks window. Also, for threads that execute tasks, some of the stack frames that aren't relevant to tasks are filtered from the top and bottom of the stack.

View the Tasks window again. Right-click any column header to see a shortcut menu for the column.

You can use the shortcut menu to add or remove columns. For example, the AppDomain column isn't selected; therefore, it isn't displayed in the list. Select Parent. The Parent column appears without values for any of the four tasks.

Resume execution until the third breakpoint

To resume execution until the third breakpoint is hit, on the Debug menu, select Continue.

Screenshot of Parent-child view in Tasks window.

In this example run, notice that task 11 and task 12 are running on the same thread (show the Thread Assignment column if it's hidden). This information isn't displayed in the Threads window; seeing it here's another benefit of the Tasks window. To confirm this, view the Parallel Stacks window. Make sure that you're viewing Tasks. You can locate tasks 11 and 12 by scanning the tooltips on the Parallel Stacks window.

Task view in Parallel Stacks window

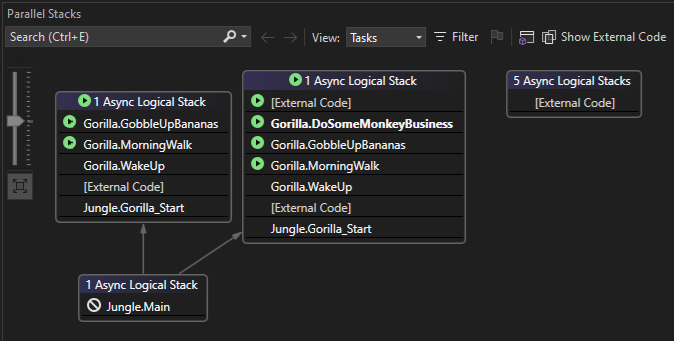
A new task, task 5, is now running and task 4 is now waiting. You can see why by hovering over the waiting task in the Status window. In the Parent column, notice that task 4 is the parent of task 5.

To better visualize the parent-child relationship, right-click the column header row and then select Parent Child View. You should see the following illustration.

Parent-child view in Tasks window

Notice that task 4 and task 5 are running on the same thread (show the Thread Assignment column if it's hidden). This information isn't displayed in the Threads window; seeing it here's another benefit of the Tasks window. To confirm this, view the Parallel Stacks window. Make sure that you're viewing Tasks. Locate tasks 4 and 5 by double-clicking them in the Tasks window. When you do, the blue highlight in the Parallel Stacks window is updated. You can also locate tasks 4 and 5 by scanning the tooltips on the Parallel Stacks window.

Task view in Parallel Stacks window

In the Parallel Stacks window, right-click S.P, and then select Go To Thread. The window switches to Threads View and the corresponding frame is in view. You can see both tasks on the same thread.

Highlighted thread in threads view

This is another benefit of the Tasks View in the Parallel Stacks window, compared to the Threads window.

Resume execution until the fourth breakpoint

To resume execution until the third breakpoint is hit, on the Debug menu, select Continue. Select the ID column header to sort by ID. You should see the following illustration.

Screenshot of Four task states in Parallel Stacks window.

Task 10 and task 11 are now waiting on each other and are blocked. There are also several new tasks that are now scheduled. Scheduled tasks are tasks that have been started in code but have not run yet. Therefore, their Location and Thread Assignment columns show default messages or are empty.

Four task states in Parallel Stacks window

Because task 5 has completed, it's no longer displayed. If that isn't the case on your computer and the deadlock isn't shown, step one time by pressing F11.

Task 3 and task 4 are now waiting on each other and are blocked. There are also 5 new tasks that are children of task 2 and are now scheduled. Scheduled tasks are tasks that have been started in code but have not run yet. Therefore, their Location and Thread Assignment columns are empty.

View the Parallel Stacks window again. The header of each box has a tooltip that shows the thread IDs and names. Switch to Tasks View in the Parallel Stacks window. Hover over a header to see the task ID and name, and the status of the task, as shown in the following illustration.

Header tooltip in Parallel Stacks window

You can group the tasks by column. In the Tasks window, right-click the Status column header and then select Group by Status. The following illustration shows the Tasks window grouped by status.

Screenshot of Grouped tasks in Tasks window.

Grouped tasks in Tasks window

You can also group by any other column. By grouping tasks, you can focus on a subset of tasks. Each collapsible group has a count of the items that are grouped together.

The last feature of the Tasks window to examine is the shortcut menu that is displayed when you right-click a task.

The shortcut menu displays different commands, depending on the status of the task. The commands might include Copy, Select All, Hexadecimal Display, Switch to Task, Freeze Assigned Thread, Freeze All Threads But This, and Thaw Assigned Thread, and Flag.

You can freeze the underlying thread of a task, or tasks, or you can freeze all threads except the assigned one. A frozen thread is represented in the Tasks window as it is in the Threads window, by a blue pause icon.

Summary

This walkthrough demonstrated the Parallel Tasks and Parallel Stacks debugger windows. Use these windows on real projects that use multithreaded code. You can examine parallel code written in C++, C#, or Visual Basic.