नोट
इस पृष्ठ तक पहुंच के लिए प्राधिकरण की आवश्यकता होती है। आप साइन इन करने या निर्देशिकाएँ बदलने का प्रयास कर सकते हैं।
इस पृष्ठ तक पहुंच के लिए प्राधिकरण की आवश्यकता होती है। आप निर्देशिकाएँ बदलने का प्रयास कर सकते हैं।
This article describes performance benchmarks Azure NetApp Files delivers for Linux with a regular volume.
Whole file streaming workloads (scale-out benchmark tests)
The intent of a scale-out test is to show the performance of an Azure NetApp File volume when scaling out (or increasing) the number of clients generating simultaneous workload to the same volume. These tests are generally able to push a volume to the edge of its performance limits and are indicative of workloads such as media rendering, AI/ML, and other workloads that utilize large compute farms to perform work.
High I/OP scale-out benchmark configuration
These benchmarks used the following:
- A single Azure NetApp Files 100-TiB regular volume with a 1-TiB dataset using the Ultra performance tier
- FIO (with and without setting randrepeat=0)
- 4-KiB and 8-KiB block sizes
- 6 D32s_v5 virtual machines running RHEL 9.3
- NFSv3
- Manual QoS
- Mount options: rw,nconnect=8,hard,rsize=262144,wsize=262144,vers=3,tcp,bg
High throughput scale-out benchmark configuration
These benchmarks used the following:
- A single Azure NetApp Files regular volume with a 1-TiB dataset using the Ultra performance tier FIO (with and without setting randrepeat=0)
- FIO (with and without setting randrepeat=0)
- 64-KiB and 256-KiB block size
- 6 D32s_v5 virtual machines running RHEL 9.3
- NFSv3
- Manual QoS
- Mount options: rw,nconnect=8,hard,rsize=262144,wsize=262144,vers=3,tcp,bg
Parallel network connection (nconnect) benchmark configuration
These benchmarks used the following:
- A single Azure NetApp Files regular volume with a 1-TiB dataset using the Ultra performance tier
- FIO (with and without setting randrepeat=0)
- 4-KiB and 64-KiB wsize/rsize
- A single D32s_v4 virtual machine running RHEL 9.3
- NFSv3 with and without
nconnect - Mount options: rw,nconnect=8,hard,rsize=262144,wsize=262144,vers=3,tcp,bg
Scale-up benchmark tests
The scale-up test’s intent is to show the performance of an Azure NetApp File volume when scaling up (or increasing) the number of jobs generating simultaneous workload across multiple TCP connections on a single client to the same volume (such as with nconnect).
Without nconnect, these workloads can't push the limits of a volume’s maximum performance, since the client can't generate enough IO or network throughput. These tests are generally indicative of what a single user’s experience might be in workloads such as media rendering, databases, AI/ML, and general file shares.
High I/OP scale-out benchmarks
The following benchmarks show the performance achieved for Azure NetApp Files with a high I/OP workload using:
- 32 clients
- 4-KiB and 8-KiB random reads and writes
- 1-TiB dataset
- Read/write ratios as follows: 100%:0%, 90%:10%, 80%:20%, and so on
- With and without filesystem caching involved (using
randrepeat=0in FIO)
For more information, see Testing methodology.
Results: 4 KiB, random, client caching included
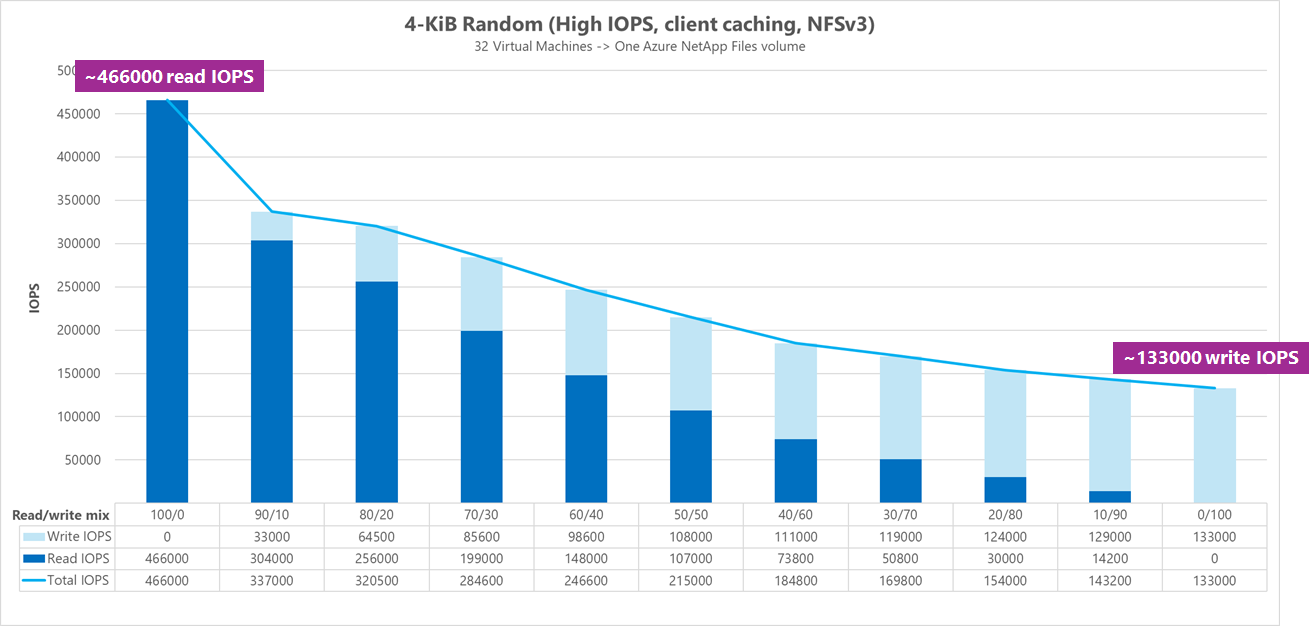
In this benchmark, FIO ran without the randrepeat option to randomize data. Thus, an indeterminate amount of caching came into play. This configuration results in slightly better overall performance numbers than tests run without caching with the entire IO stack being utilized.
In the following graph, testing shows an Azure NetApp Files regular volume can handle between approximately 130,000 pure random 4-KiB writes and approximately 460,000 pure random 4 KiB reads during this benchmark. Read-write mix for the workload adjusted by 10% for each run.
As the read-write I/OP mix increases towards write-heavy, the total I/OPS decrease.
Results: 4 KiB, random, client caching excluded
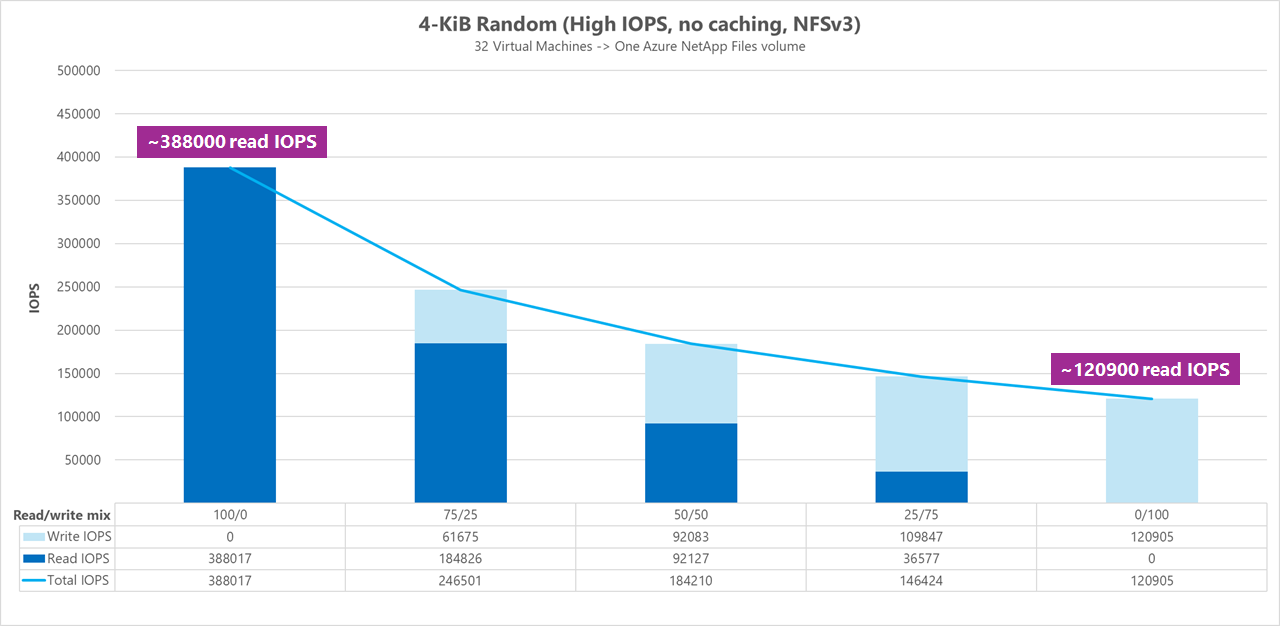
In this benchmark, FIO was run with the setting randrepeat=0 to randomize data, reducing the caching influence on performance. This resulted in an approximately 8% reduction in write I/OPS and an approximately 17% reduction in read I/OPS, but displays performance numbers more representative of what the storage can actually do.
In the following graph, testing shows an Azure NetApp Files regular volume can handle between approximately 120,000 pure random 4-KiB writes and approximately 388,000 pure random 4-KiB reads. Read-write mix for the workload adjusted by 25% for each run.
As the read-write I/OP mix increases towards write-heavy, the total I/OPS decrease.
Results: 8 KiB, random, client caching excluded
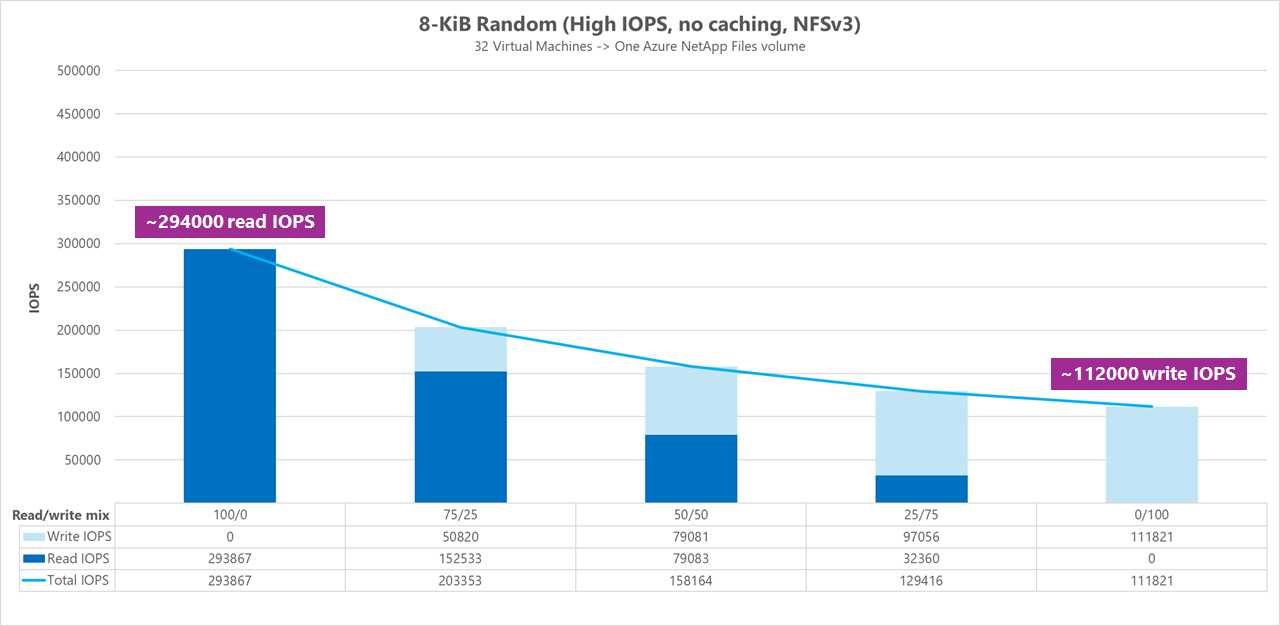
Larger read and write sizes will result in fewer total I/OPS, as more data can be sent with each operation. An 8-KiB read and write size was used to more accurately simulate what most modern applications use. For instance, many EDA applications utilize 8-KiB reads and writes.
In this benchmark, FIO ran with randrepeat=0 to randomize data so the client caching impact was reduced. In the following graph, testing shows that an Azure NetApp Files regular volume can handle between approximately 111,000 pure random 8-KiB writes and approximately 293,000 pure random 8-KiB reads. Read-write mix for the workload adjusted by 25% for each run.
As the read-write I/OP mix increases towards write-heavy, the total I/OPS decrease.
Side-by-side comparisons
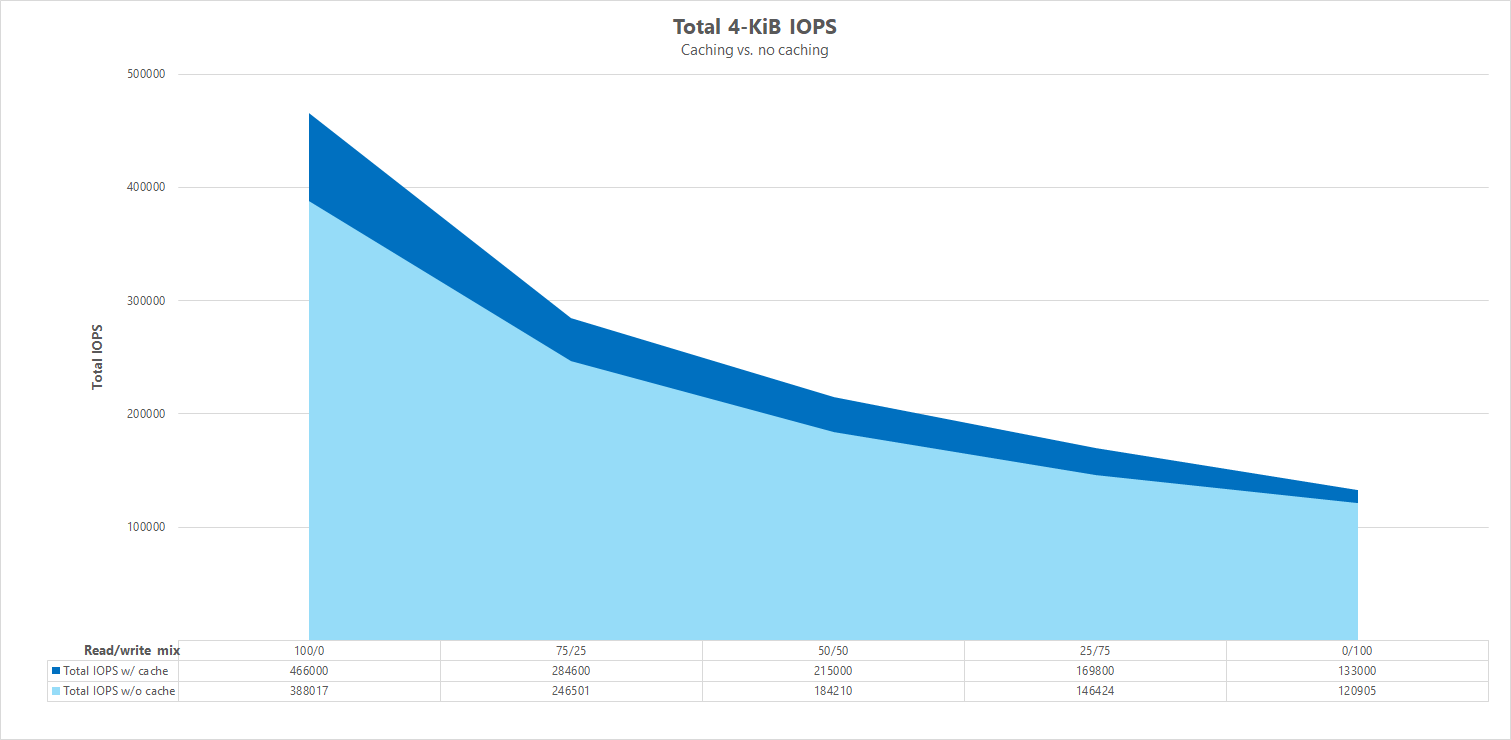
To illustrate how caching can influence the performance benchmark tests, the following graph shows total I/OPS for 4-KiB tests with and without caching mechanisms in place. As shown, caching provides a slight performance boost for I/OPS fairly consistent trending.
Specific offset, streaming random read/write workloads: scale-up tests using parallel network connections (nconnect)
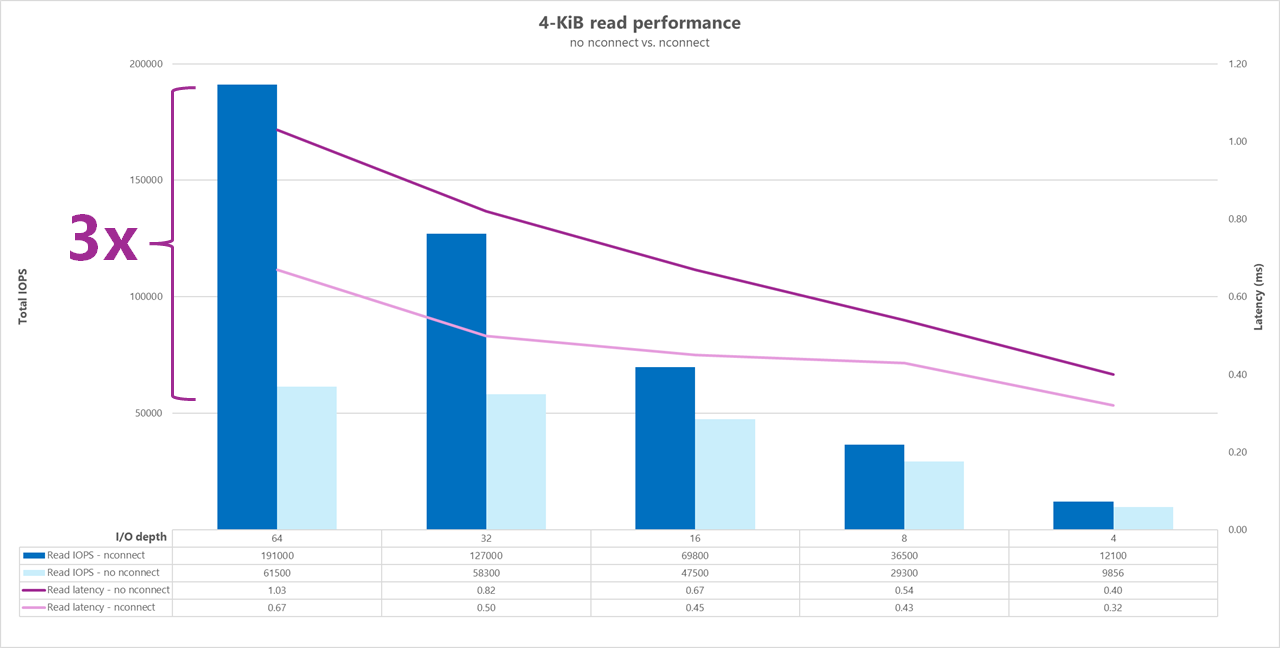
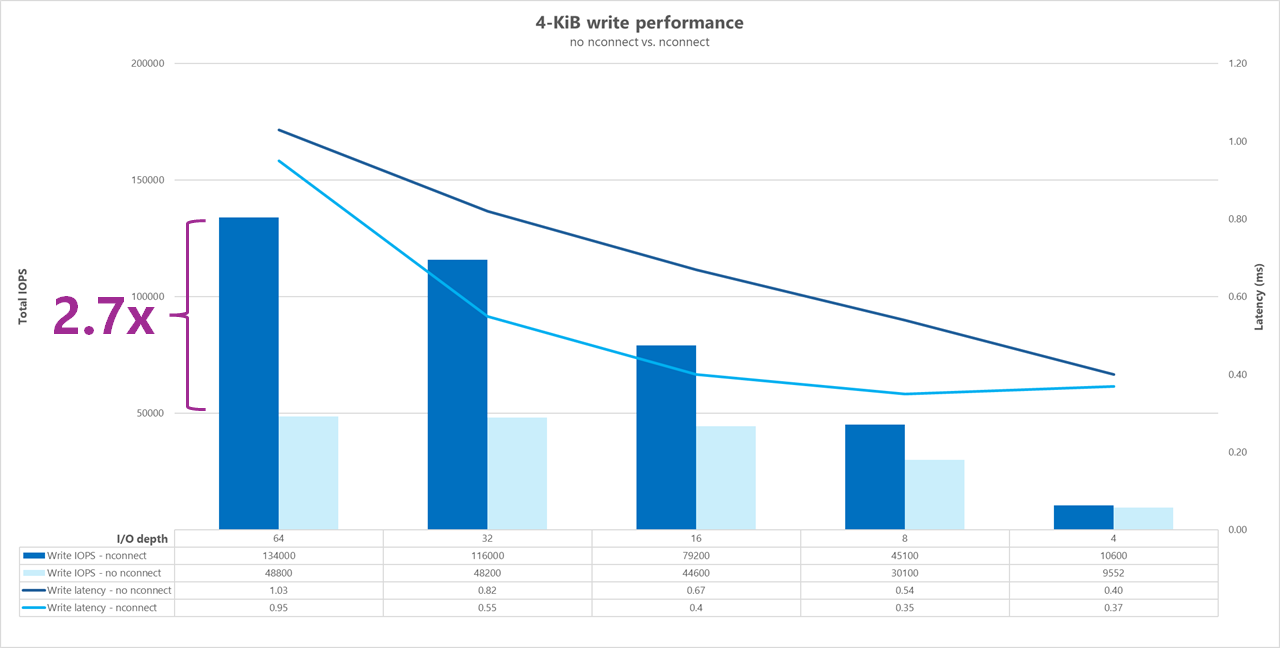
The following tests show a high I/OP benchmark using a single client with 4-KiB random workloads and a 1-TiB dataset. The workload mix generated uses a different I/O depth each time. To boost the performance for a single client workload, the nconnect mount option was used to improve parallelism in comparison to client mounts without the nconnect mount option.
When using a standard TCP connection that provides only a single path to the storage, fewer total operations are sent per second than when a mount is able to leverage more TCP connections (such as with nconnect) per mount point. When using nconnect, the total latency for the operations is generally lower. These tests are also run with randrepeat=0 to intentionally avoid caching. For more information on this option, see Testing methodology.
Results: 4 KiB, random, with and without nconnect, caching excluded
The following graphs show a side-by-side comparison of 4-KiB reads and writes with and without nconnect to highlight the performance improvements seen when using nconnect: higher overall I/OPS, lower latency.
High throughput benchmarks
The following benchmarks show the performance achieved for Azure NetApp Files with a high throughput workload.
High throughput workloads are more sequential in nature and often are read/write heavy with low metadata. Throughput is generally more important than I/OPS. These workloads typically leverage larger read/write sizes (64K to 256K), which generate higher latencies than smaller read/write sizes, since larger payloads will naturally take longer to be processed.
Examples of high throughput workloads include:
- Media repositories
- High performance compute
- AI/ML/LLP
The following tests show a high throughput benchmark using both 64-KiB and 256-KiB sequential workloads and a 1-TiB dataset. The workload mix generated decreases a set percentage at a time and demonstrates what you can expect when using varying read/write ratios (for instance, 100%:0%, 90%:10%, 80%:20%, and so on).
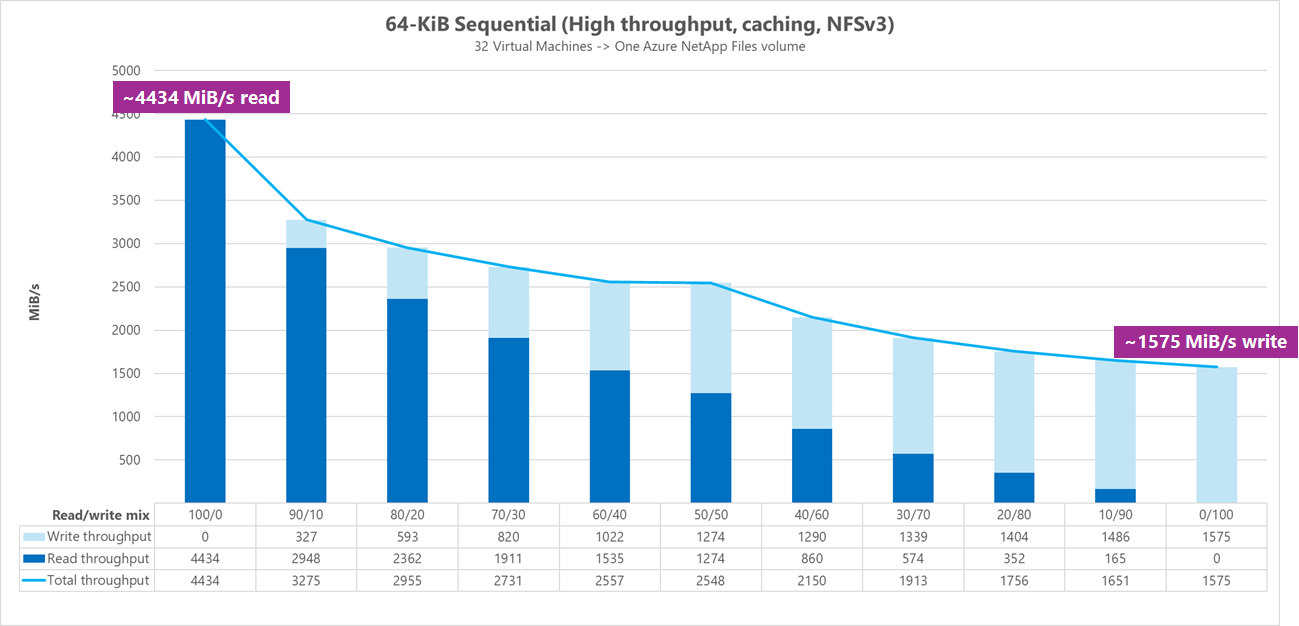
Results: 64 KiB sequential I/O, caching included
In this benchmark, FIO ran using looping logic that more aggressively populated the cache, so an indeterminate amount of caching influenced the results. This results in slightly better overall performance numbers than tests run without caching.
In the graph below, testing shows that an Azure NetApp Files regular volume can handle between approximately 4,500MiB/s pure sequential 64-KiB reads and approximately 1,600 MiB/s pure sequential 64-KiB writes. The read-write mix for the workload was adjusted by 10% for each run.
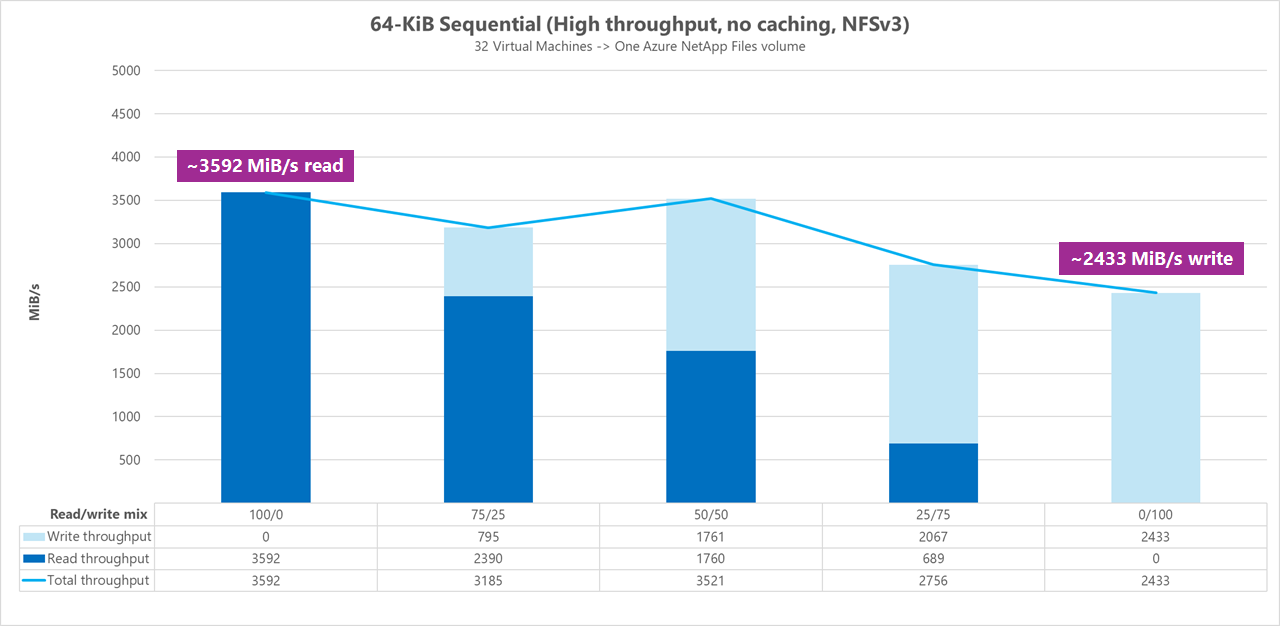
Results: 64 KiB sequential I/O, reads vs. write, baseline without caching
In this baseline benchmark, testing demonstrates that an Azure NetApp Files regular volume can handle between approximately 3,600 MiB/s pure sequential 64-KiB reads and approximately 2,400 MiB/second pure sequential 64-KiB writes. During the tests, a 50/50 mix showed total throughput on par with a pure sequential read workload.
With respect to pure read, the 64-KiB baseline performed slightly better than the 256-KiB baseline. When it comes to pure write and all mixed read/write workloads, however, the 256-KiB baseline outperformed 64 KiB, indicating a larger block size of 256 KiB is more effective overall for high throughput workloads.
The read-write mix for the workload was adjusted by 25% for each run.
Results: 256 KiB sequential I/O without caching
In the following two baseline benchmarks, FIO was used to measure the amount of sequential I/O (read and write) a single regular volume in Azure NetApp Files can deliver. In order to produce a baseline that reflects the true bandwidth that a fully uncached read workload can achieve, FIO was configured to run with the parameter randrepeat=0 for data set generation. Each test iteration was offset by reading a completely separate large dataset not part of the benchmark in order to clear any caching that might have occurred with the benchmark dataset.
In this graph, testing shows that an Azure NetApp Files regular volume can handle between approximately 3,500 MiB/s pure sequential 256-KiB reads and approximately 2,500 MiB/s pure sequential 256-KiB writes. During the tests, a 50/50 mix showed total throughput peaked higher than a pure sequential read workload.
Parallel network connections (nconnect)
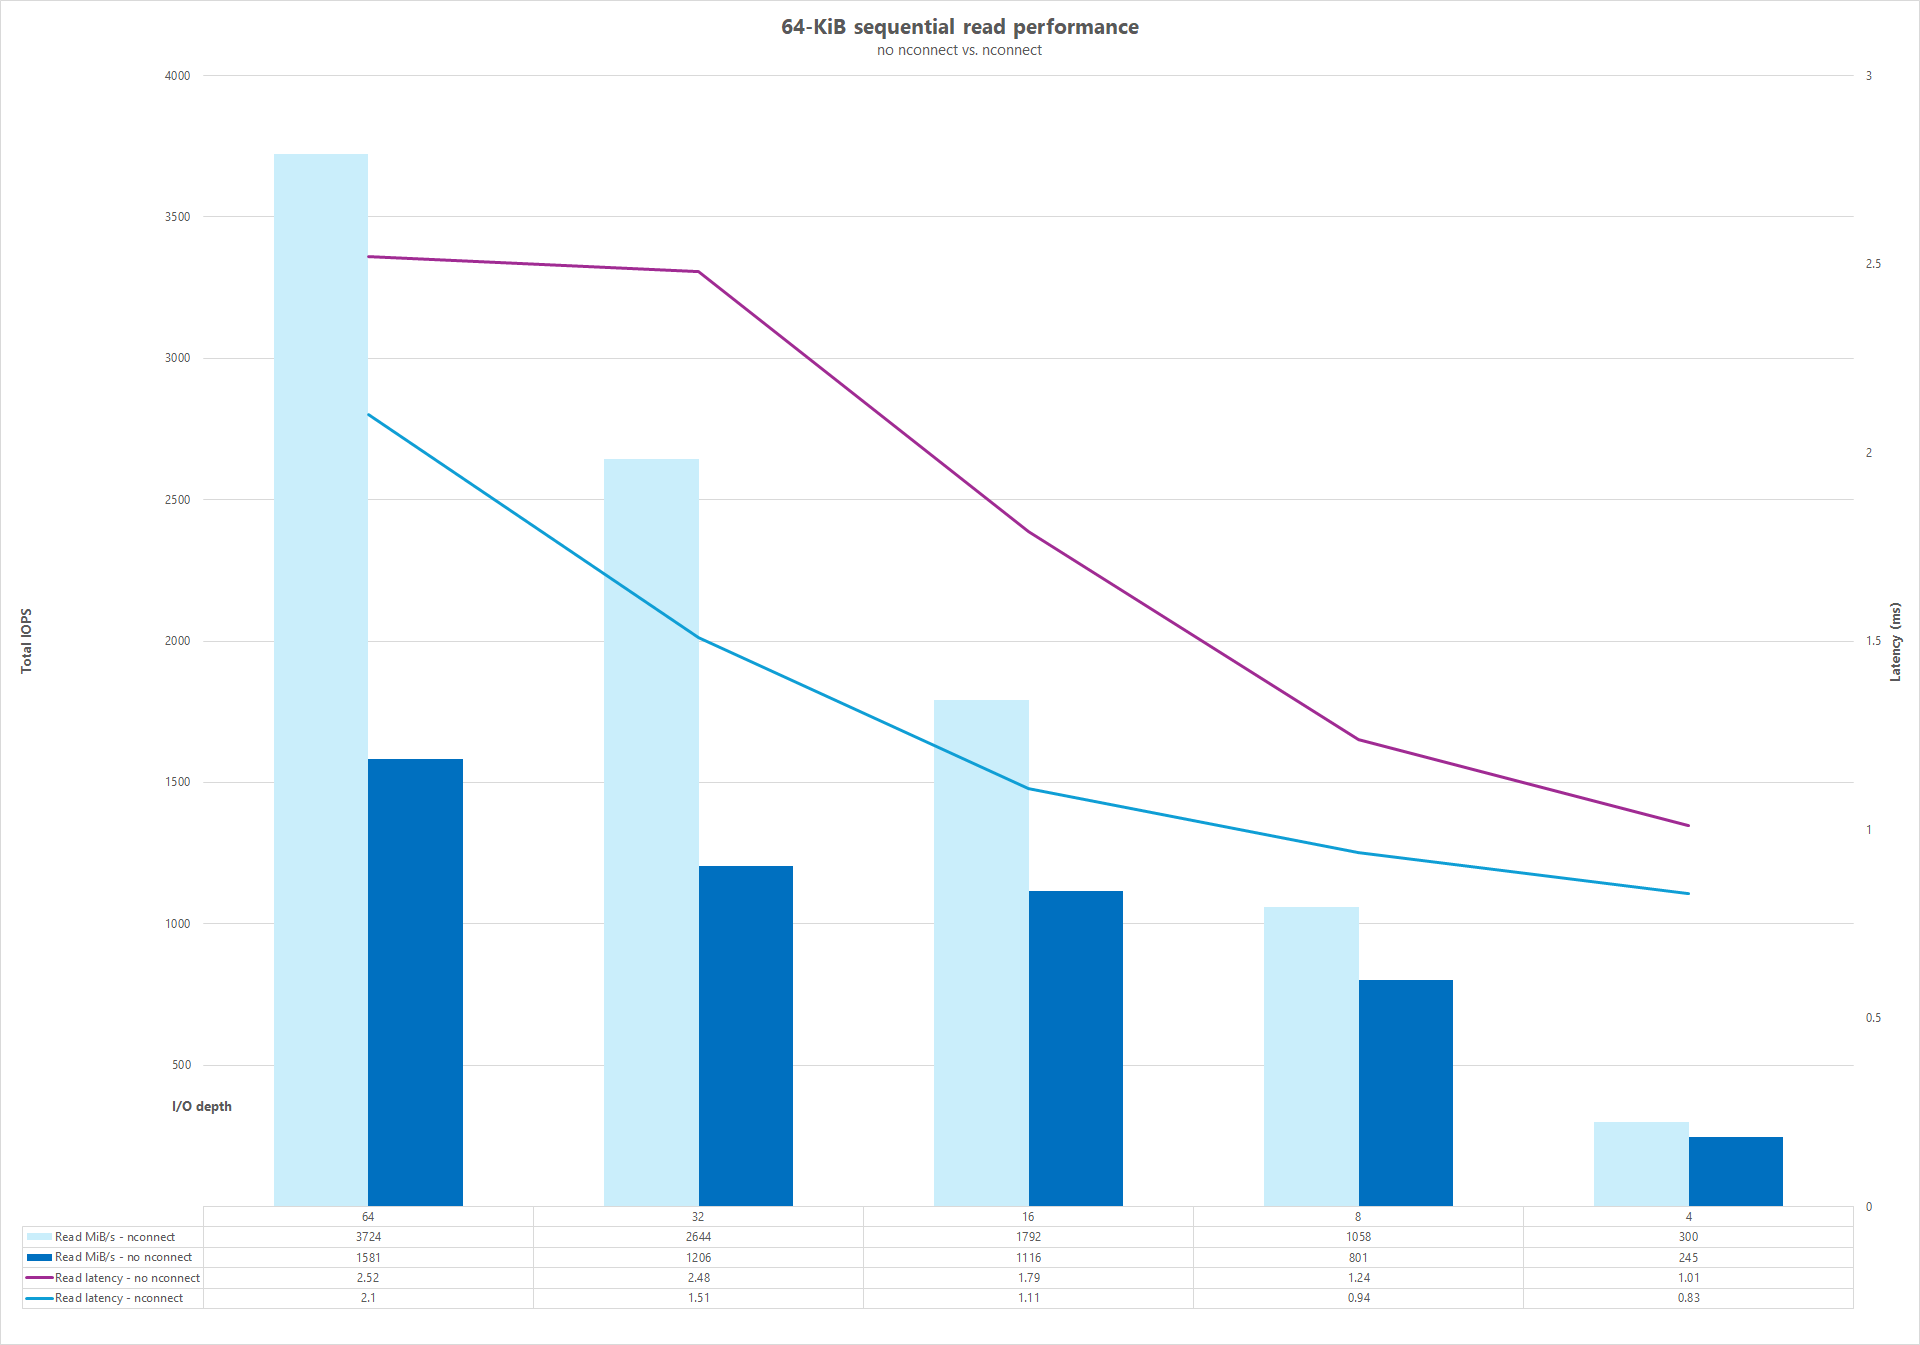
The following tests show a high I/OP benchmark using a single client with 64-KiB random workloads and a 1-TiB dataset. The workload mix generated uses a different I/O depth each time. To boost the performance for a single client workload, the nconnect mount option was leveraged for better parallelism in comparison to client mounts that didn't use the nconnect mount option. These tests were run only with caching excluded.
Results: 64KiB sequential I/O, read throughput cache comparison
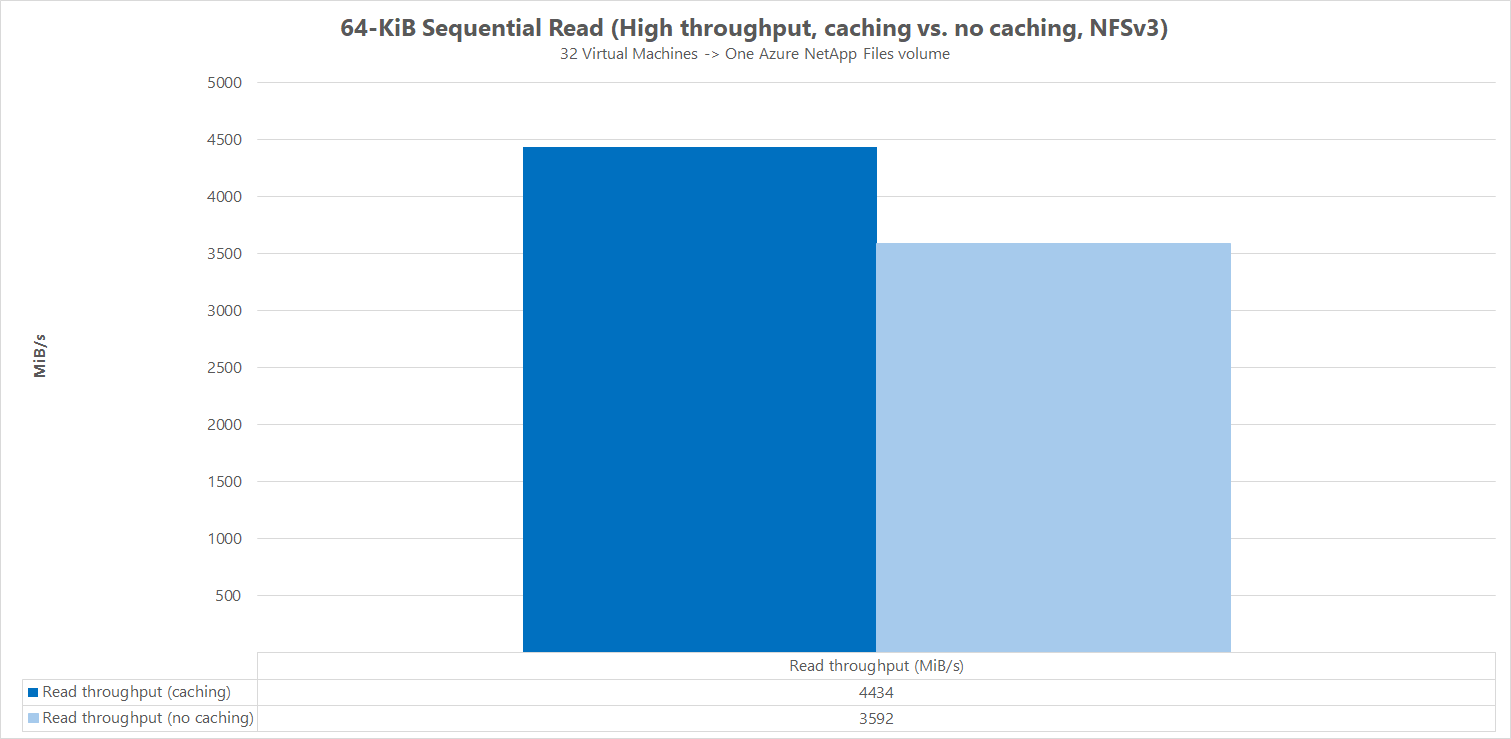
To demonstrate how caching influences performance results, FIO was used in the following micro benchmark comparison to measure the amount of sequential I/O (read and write) a single regular volume in Azure NetApp Files can deliver. This test is contrasted with the benefits a partially cacheable workload may provide.
In the result without caching, testing was designed to mitigate any caching taking place as described in the baseline benchmarks above.
In the other result, FIO was used against Azure NetApp Files regular volumes without the randrepeat=0 parameter and using a looping test iteration logic that slowly populated the cache over time. The combination of these factors produced an indeterminate amount of caching, boosting the overall throughput. This configuration resulted in slightly better overall read performance numbers than tests run without caching.
The test results displayed in the graph display the side-by-side comparison of read performance with and without the caching influence, where caching produced up to ~4500 MiB/second read throughput, while no caching achieved around ~3600 MiB/second.
Side-by-side comparison (with and without nconnect)
The following graphs show a side-by-side comparison of 64-KiB sequential reads and writes with and without nconnect to highlight the performance improvements seen when using nconnect: higher overall throughput, lower latency.
