नोट
इस पेज तक पहुँच के लिए प्रमाणन की आवश्यकता होती है. आप साइन इन करने या निर्देशिकाओं को बदलने का प्रयास कर सकते हैं.
इस पेज तक पहुँच के लिए प्रमाणन की आवश्यकता होती है. आप निर्देशिकाओं को बदलने का प्रयास कर सकते हैं.
The R ecosystem offers multiple graphing libraries that come packed with many different features. By default, every Apache Spark Pool in Microsoft Fabric contains a set of curated and popular open-source libraries. Add or manage extra libraries or versions by using the Microsoft Fabric library management capabilities.
Prerequisites
Get a Microsoft Fabric subscription. Or, sign up for a free Microsoft Fabric trial.
Sign in to Microsoft Fabric.
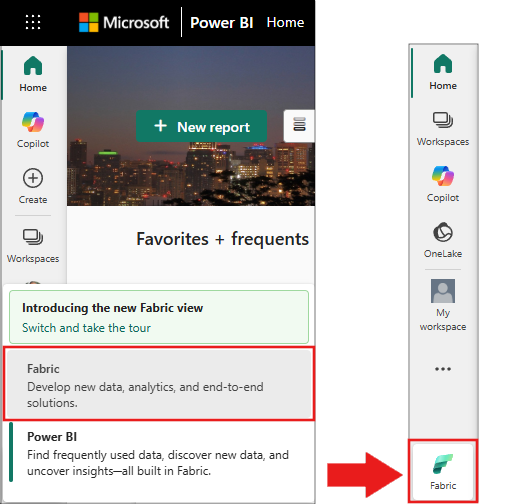
Switch to Fabric by using the experience switcher on the lower-left side of your home page.
Open or create a notebook. To learn how, see How to use Microsoft Fabric notebooks.
Set the language option to SparkR (R) to change the primary language.
Attach your notebook to a lakehouse. On the left side, select Add to add an existing lakehouse or to create a lakehouse.
ggplot2
The ggplot2 library is popular for data visualization and exploratory data analysis.
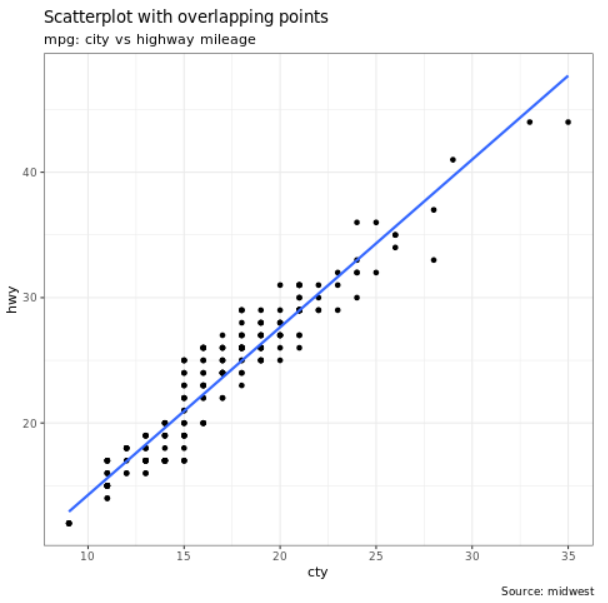
%%sparkr
library(ggplot2)
data(mpg, package="ggplot2")
theme_set(theme_bw())

g <- ggplot(mpg, aes(cty, hwy))

# Scatterplot
g + geom_point() +
  geom_smooth(method="lm", se=F) +
  labs(subtitle="mpg: city vs highway mileage",
       y="hwy",
       x="cty",
       title="Scatterplot with overlapping points",
       caption="Source: midwest")
rbokeh
rbokeh is a native R plotting library for creating interactive graphics.
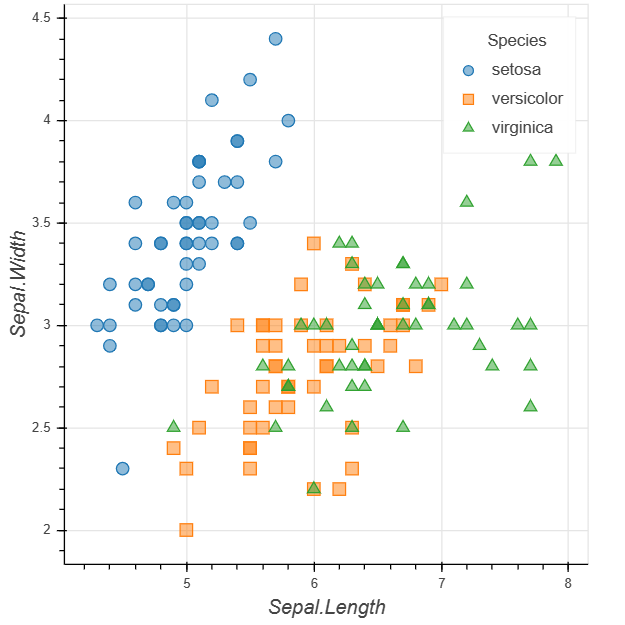
library(rbokeh)
p <- figure() %>%
  ly_points(Sepal.Length, Sepal.Width, data = iris,
    color = Species, glyph = Species,
    hover = list(Sepal.Length, Sepal.Width))
p
R Plotly
Plotly is an R graphing library that makes interactive, publication-quality graphs.

library(plotly)

fig <- plot_ly() %>%
  add_lines(x = c("a","b","c"), y = c(1,3,2))%>%
  layout(title="sample figure", xaxis = list(title = 'x'), yaxis = list(title = 'y'), plot_bgcolor = "#c7daec")

fig
Highcharter
Highcharter is an R wrapper for Highcharts JavaScript library and its modules.
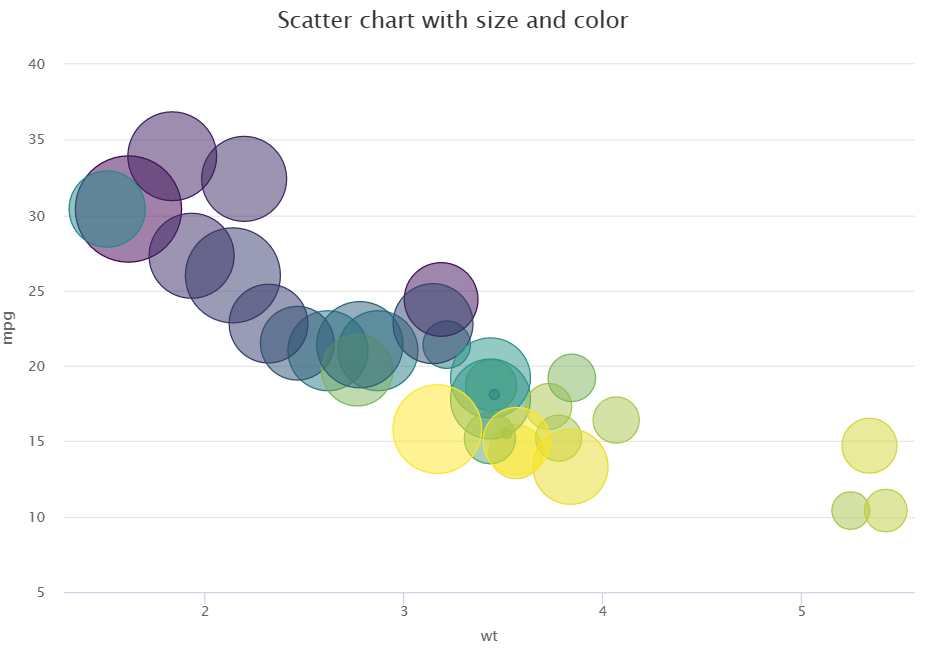
library(magrittr)
library(highcharter)
hchart(mtcars, "scatter", hcaes(wt, mpg, z = drat, color = hp)) %>%
  hc_title(text = "Scatter chart with size and color")