Create paginated reports that you can export in the Power BI service
APPLIES TO: ![]() Power BI service
Power BI service ![]() Power BI Report Builder
Power BI Report Builder ![]() Power BI Desktop
Power BI Desktop
In this article, you learn how to create a paginated report with all the data from your Power BI semantic model, and then export it. The feature lets you quickly create a paginated report on the web, and apply styling. You can then export it using the rich export functionality of paginated reports, which retains the applied formatting & styling.
You can use the feature to create paginated reports in any workspace in the Power BI service, including workspaces that aren't in a Power BI Premium capacity.
Prerequisites
See the Prerequisites section in Get started creating paginated reports in the Power BI service.
Get started
See the article Get started creating paginated reports in the Power BI service for all the ways you can get started creating paginated reports in the Power BI service.
No matter which way you start, the new paginated report online editing experience opens.
Create a table
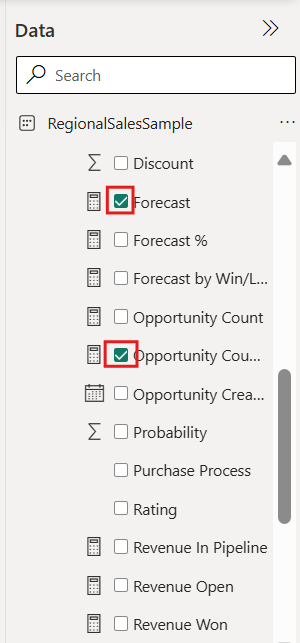
To create the table, select field names in the Data pane on the right. This pane gives you a table-and-column based view of the chosen dataset. When you find a column that you wish to add to your table, select the column.
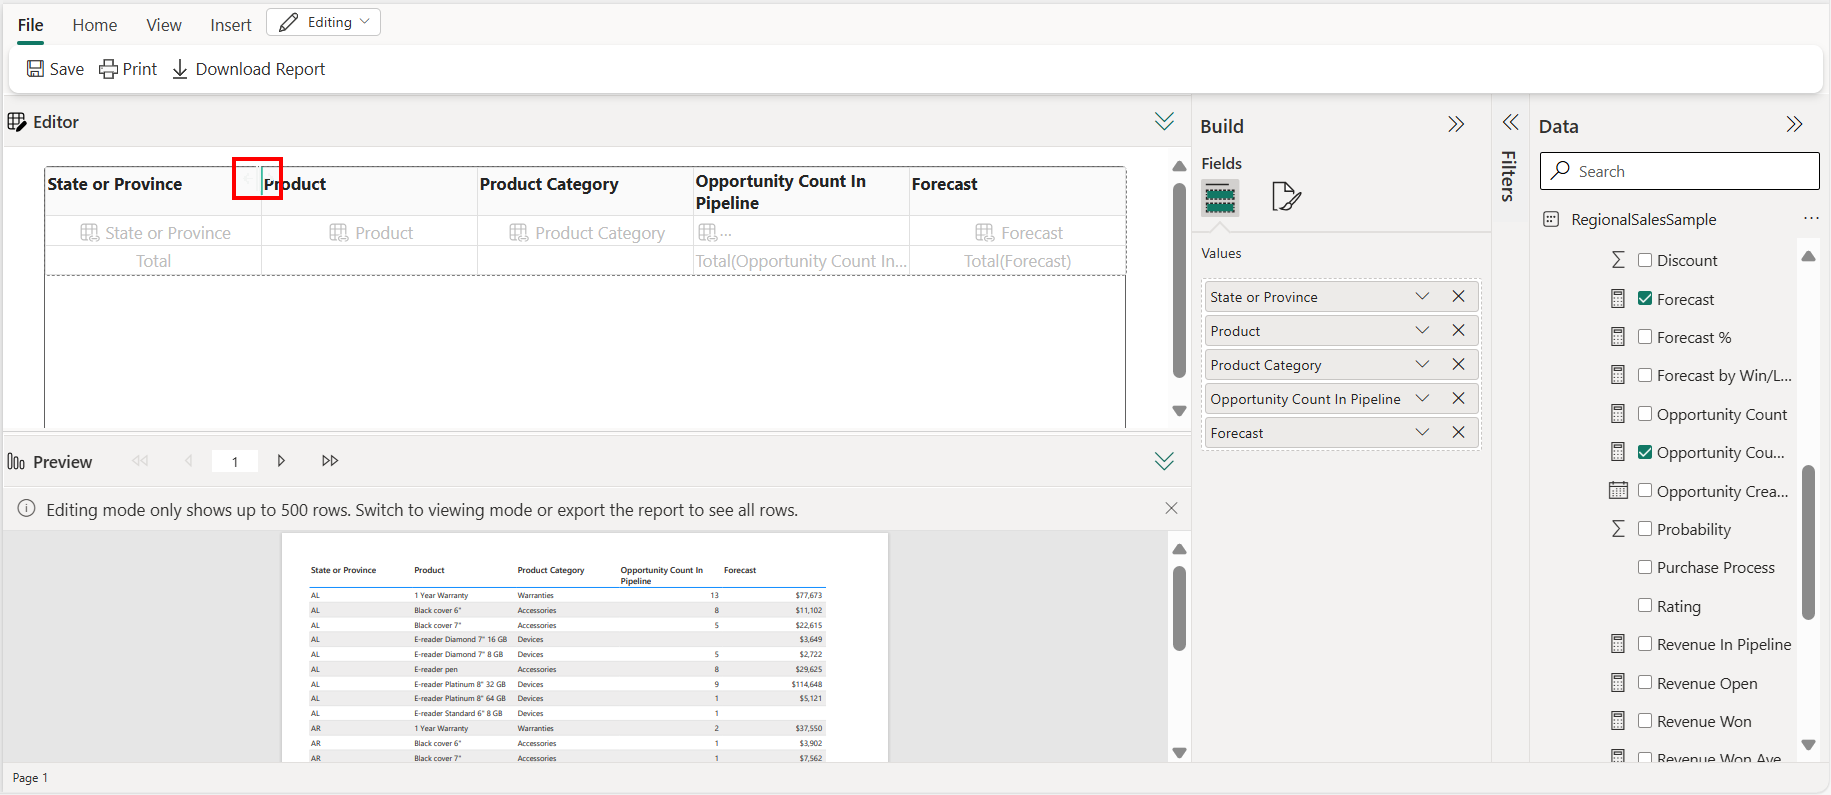
The selected columns appear in the Editor portion of the canvas. Give the editor a few moments to run the query on the dataset. The formatted table shows up in the Preview section of the canvas.

This viewer shows you a preview of your currently unsaved paginated report. Use this pane to make sure everything in your report looks good before editing or saving the report.
If columns are in the wrong order in the Build pane, don't worry. You can easily reorder the columns in the Build pane columns by dragging the columns into the desired order.

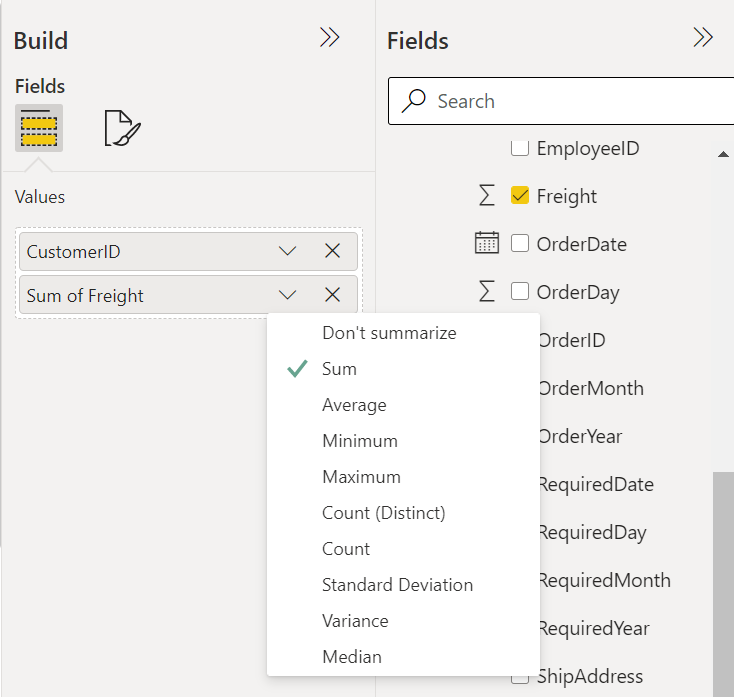
When you select a field, we use the default aggregate set on the field. You can change the aggregate behavior. Select the arrow next to the field item in the Build pane.
Format the table
You can format the table from the Build pane or from the Editor ribbon. In the Build pane, you can format the table using the built-in format options.
In the Build pane, select the Format tab.
Select the drop-down arrow in the Style box, and experiment with the available styles.

In the Editor:
To resize the width of the columns, hover over the edge of a column header, and drag the double-headed arrow that appears.
To edit the text in a column header select the header you would like to edit, double-click and make your changes.

To sort the table on a column, select the sort icon in the column header.

After you sort it, you see the arrow icon showing the direction of the sort on the column.

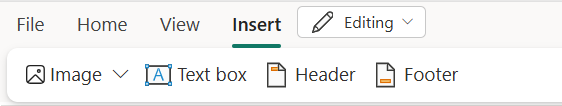
Insert textboxes, images, headers and footers from the ribbon.
Note
To revert to using the original column header based on your data source, remove and add the field again in the Data pane.
When you export to CSV, it doesn't reflect the renamed column name. To learn more, see data renderer formats.


Edit a paginated report
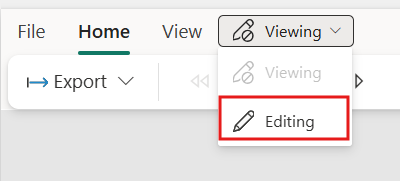
If you are Viewing a paginated report that you've authored in the Power BI service, you have the option to edit the report by switching to Editing
Add images to the paginated report
Add images to the body of the paginated report
For any paginated report that you author in the Power BI service, you can insert images above or below the table in the report, into the header or footer of the report.
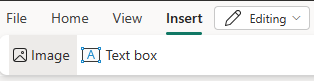
To add an image to the body of your report, select Insert, then Image.
Note
At this time, you can only insert images from your local machine or external images that are available over the internet without needing authentication.
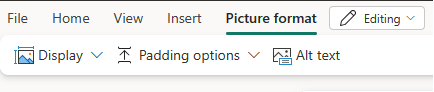
After you insert the image, you can use the Picture format tab to set an Alternate text for the image, set padding options, or set the display size option.
To learn more about external images, refer to Add external images to paginated reports.
Add images to the header or footer of the paginated report
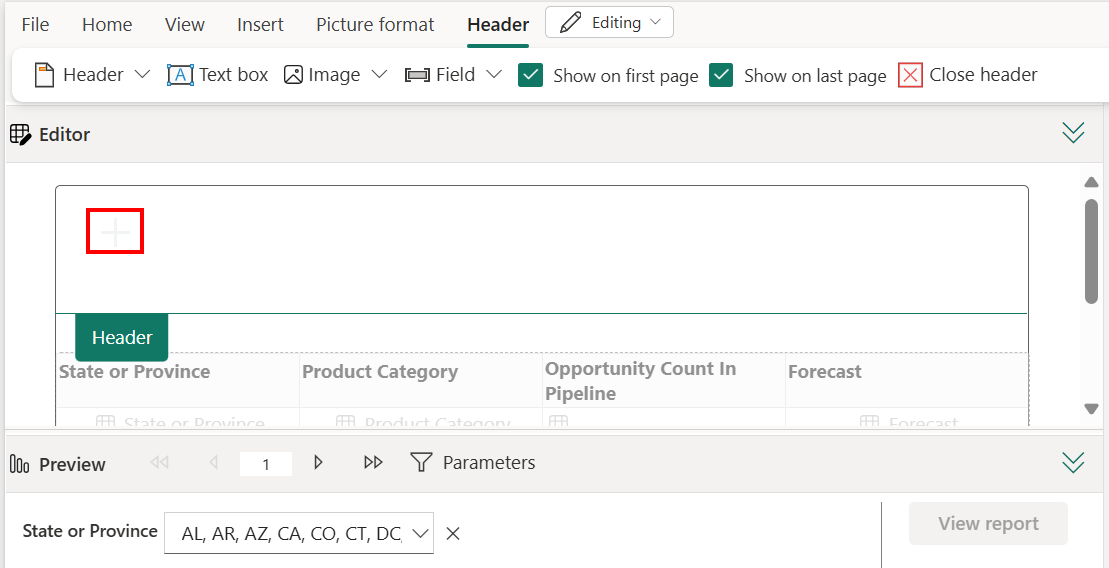
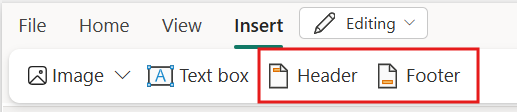
To add images to the header or footer of the report, select Insert, then Header or Footer.

Select Image, then the location and click where you want to place the image within the header or footer.


Add text to the paginated report
For any paginated report you author in the Power BI service, you can insert text boxes above or below the table in the report, as well as the header or footer of the report.
Add a text box and begin typing
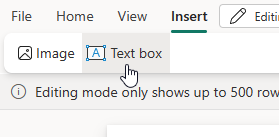
To add a text box to your report, select Insert and then Text box.
Note
When you insert a new text box or select a text box, you're immediately editing the text in the text box.
Begin typing within the text box.
Select, move, and resize text boxes
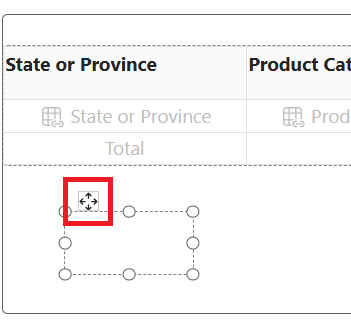
To select a text box, click on the text box and a text box outline appears.
To move a selected text box, select and drag the move indicator on the text box outline.
To resize a text box, select the text box itself and then select and drag any sizing handle. Alternatively, press the SHIFT + arrow keys to resize horizontally or vertically.
Note
Text that doesn't fit within the text box area may show only while the text box is selected. Text outside the text box area doesn't show in the final design of your report. Resize the text box area to show the text you would like visible.
Format and style text in a text box
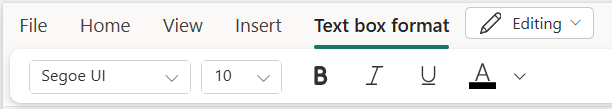
After you select a text box, the Text box format tab is displayed. From this tab you can format the font style, including font, color, size, and text decoration like bold, italics, and underline.
You can format font styles at the character and line level while you're editing the text box. Or select the text box to highlight all text and format all text within the text box at once.
Delete a text box
To delete a text box, right-click a text box and select Remove. Alternatively, with a text box selected press DELETE.
Considerations and limitations when working with text
- As with other objects in a report, you can only select one text box at a time.
- Text boxes can't be duplicated, or copied and pasted. You can highlight, copy, and paste text within text boxes.
Add header and footer to your report
To add a header to the report, select Header from the Insert option on the ribbon.
You can add a textbox, images, page numbers or execution times in the header/footer. You can also unselect Show on first page or Show on last page if you don't want the header/footer to be displayed on those pages.
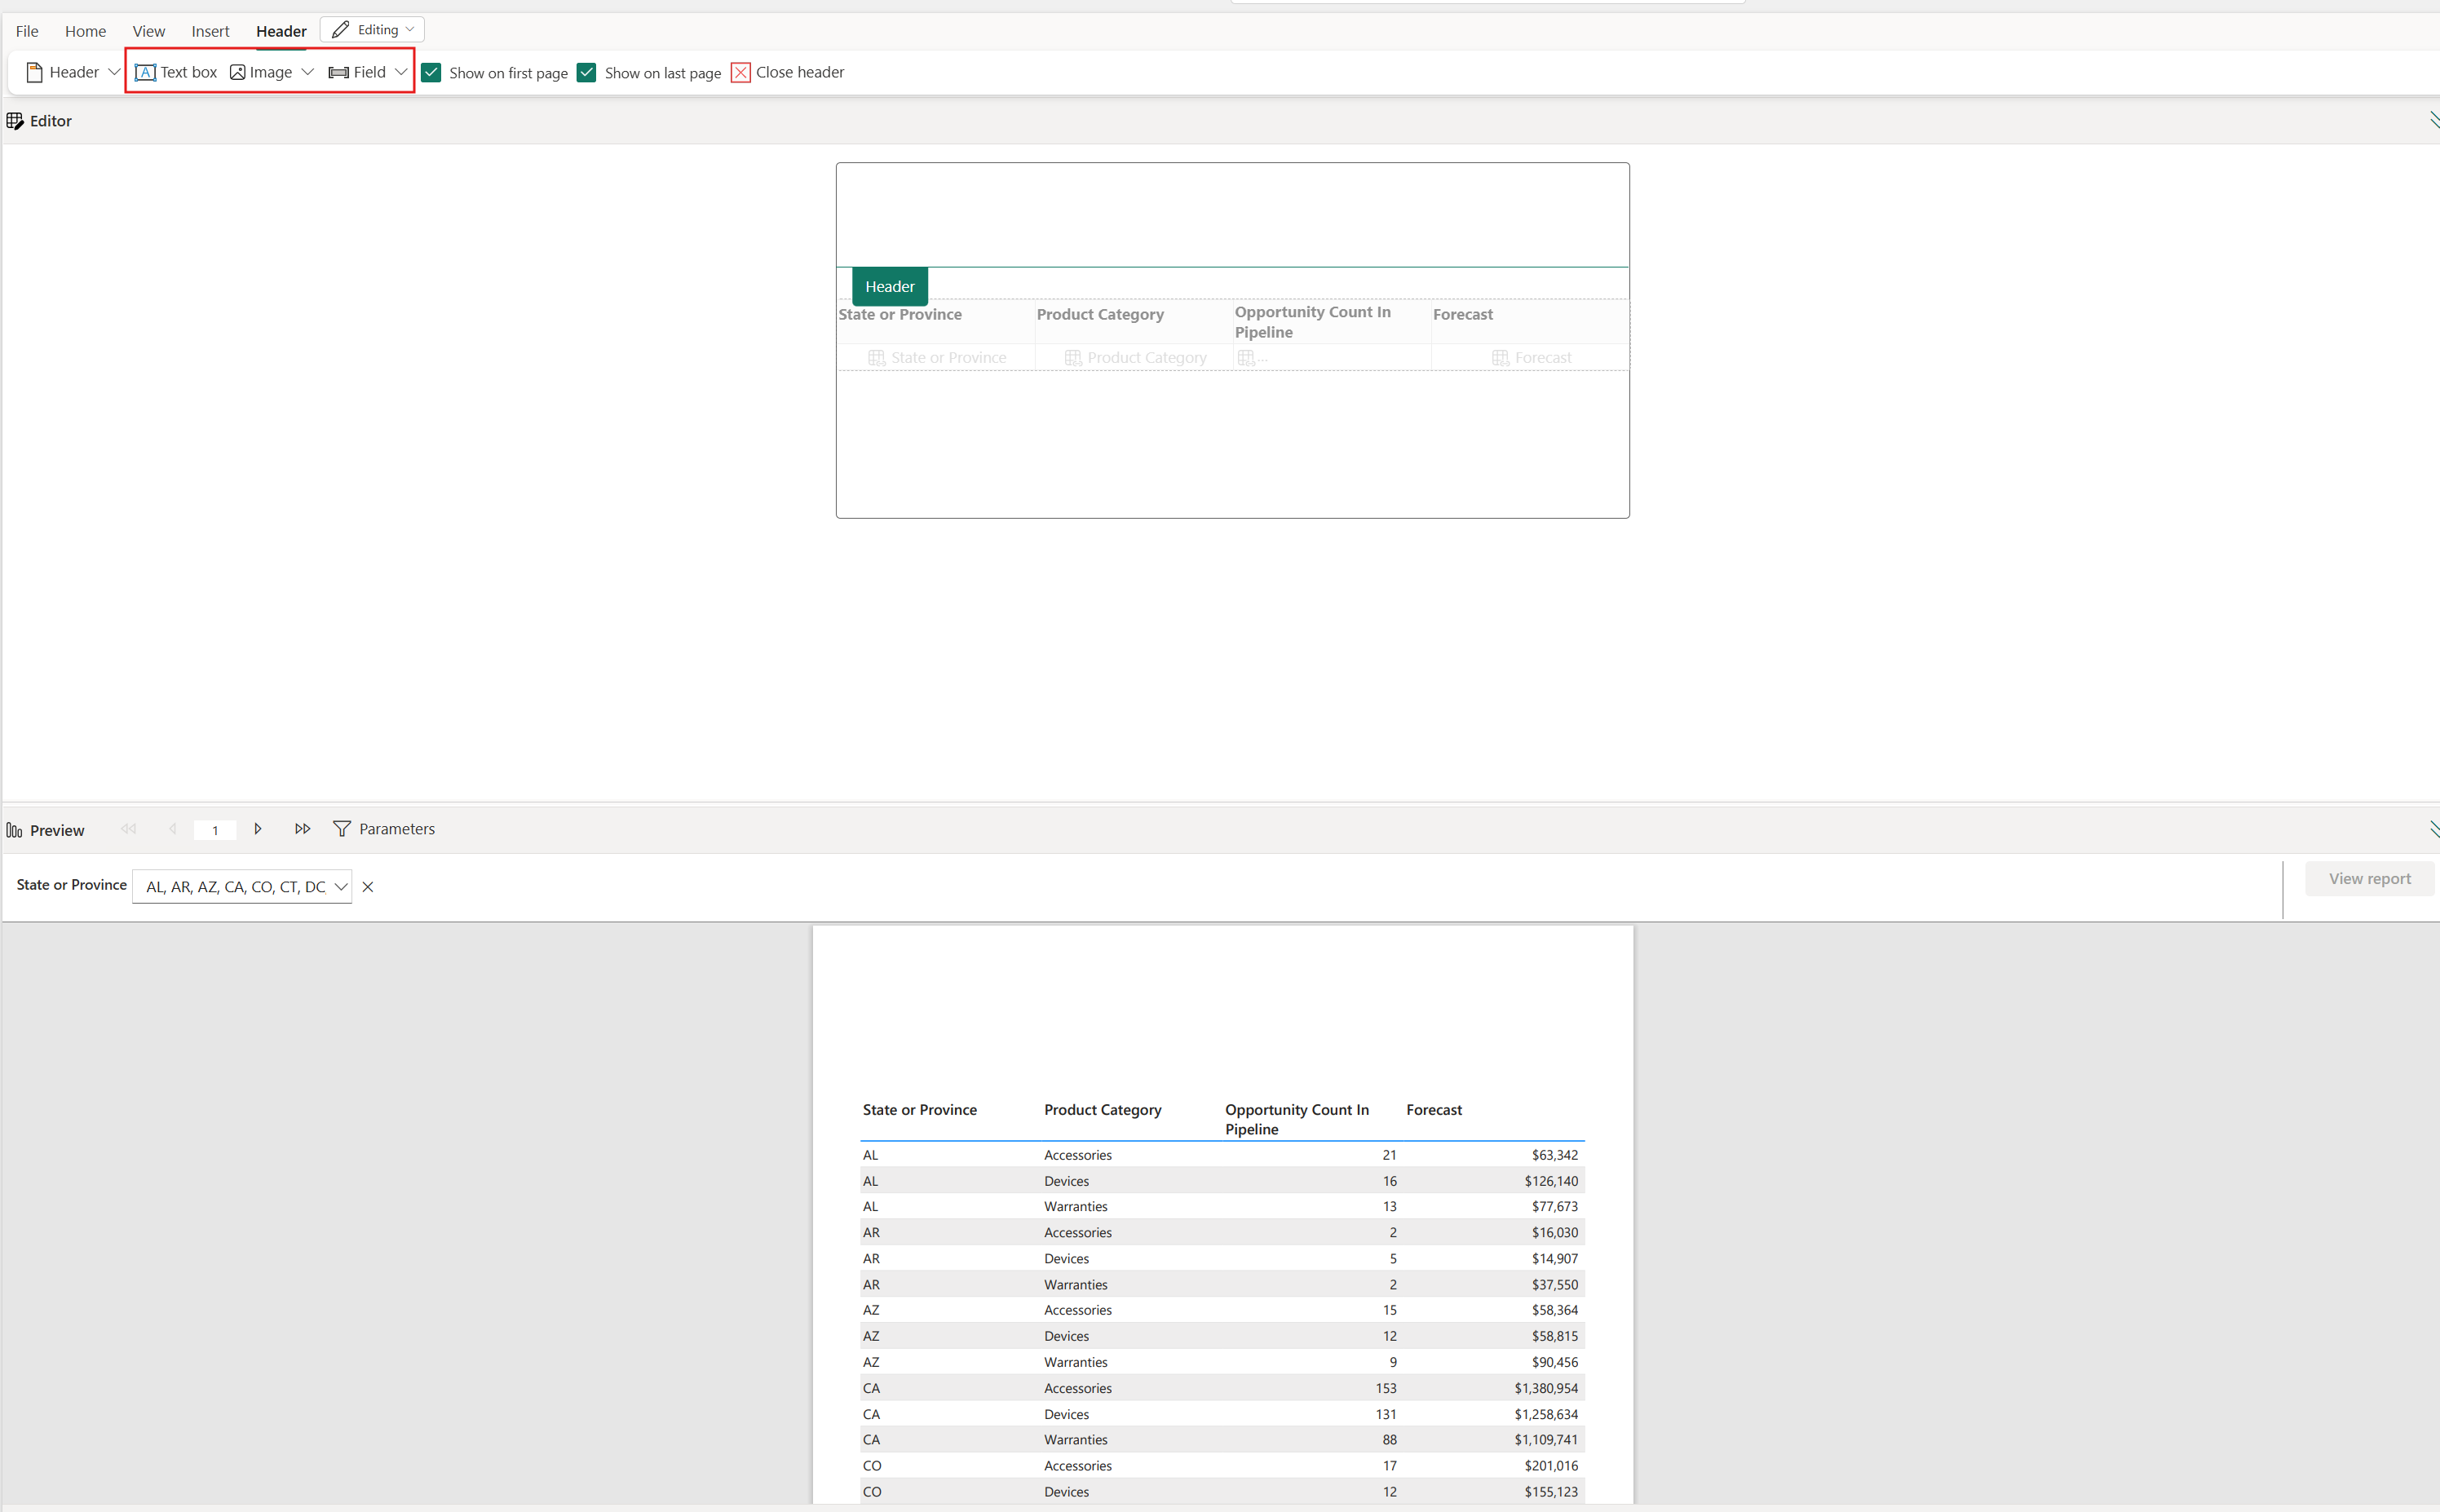
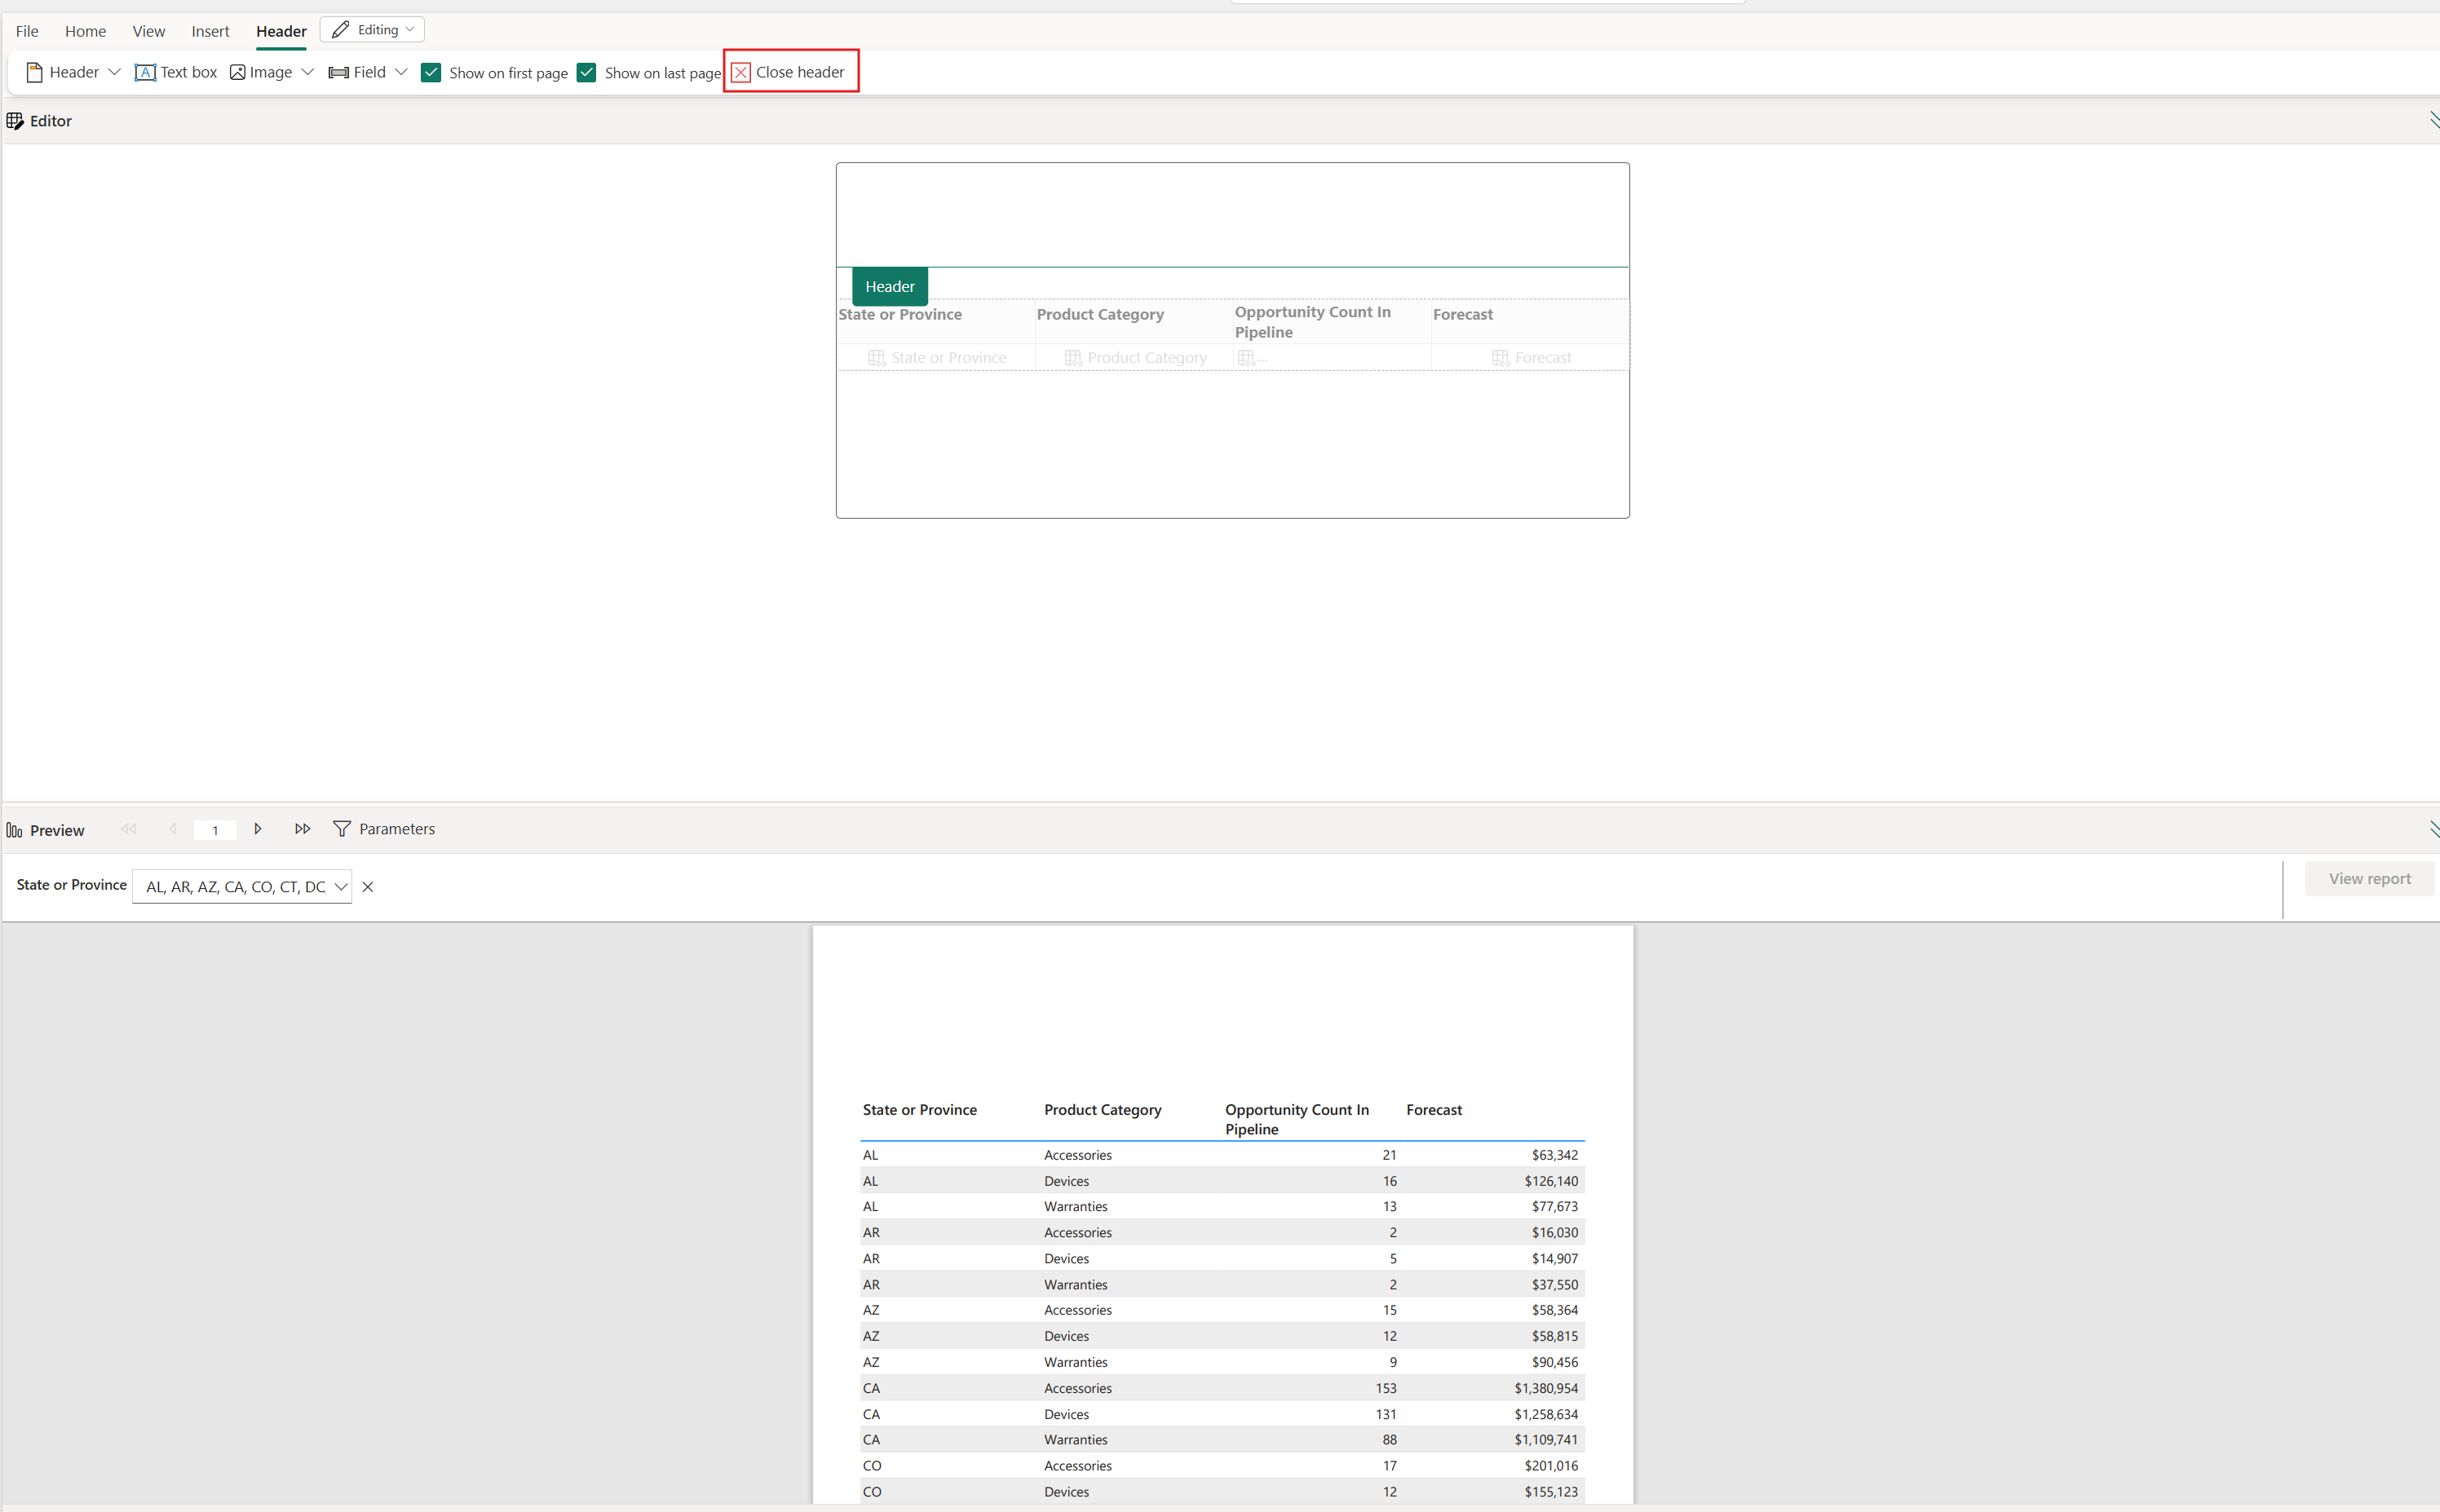
Once you are done creating your header/footer, you can exit either by selecting the Close Header or Close Footer option or double clicking outside the header or footer area.
Considerations and limitations when working with headers and footers
- You must exit the header or footer before you can continue editing the body of the report.
- The format of the page number is limited. We only support absolute page numbers.
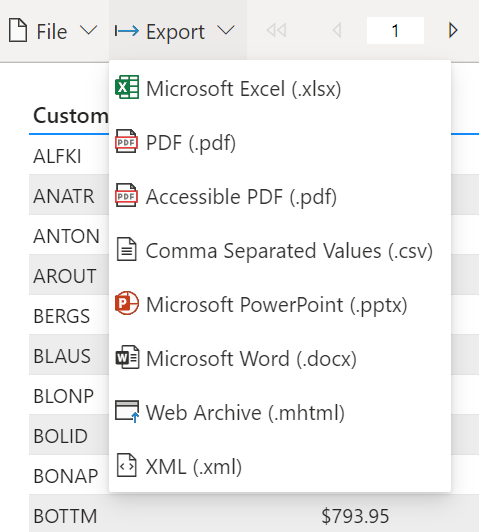
Export your report
You can export the table before or after you save it. Paginated reports have rich export capabilities to any of the supported formats, preserving full fidelity. The exported report is saved to your default Downloads folder.
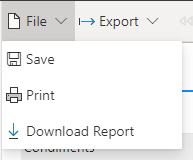
Save your report
You can save the report to any workspace.
On the File menu, save, download, or print your report.
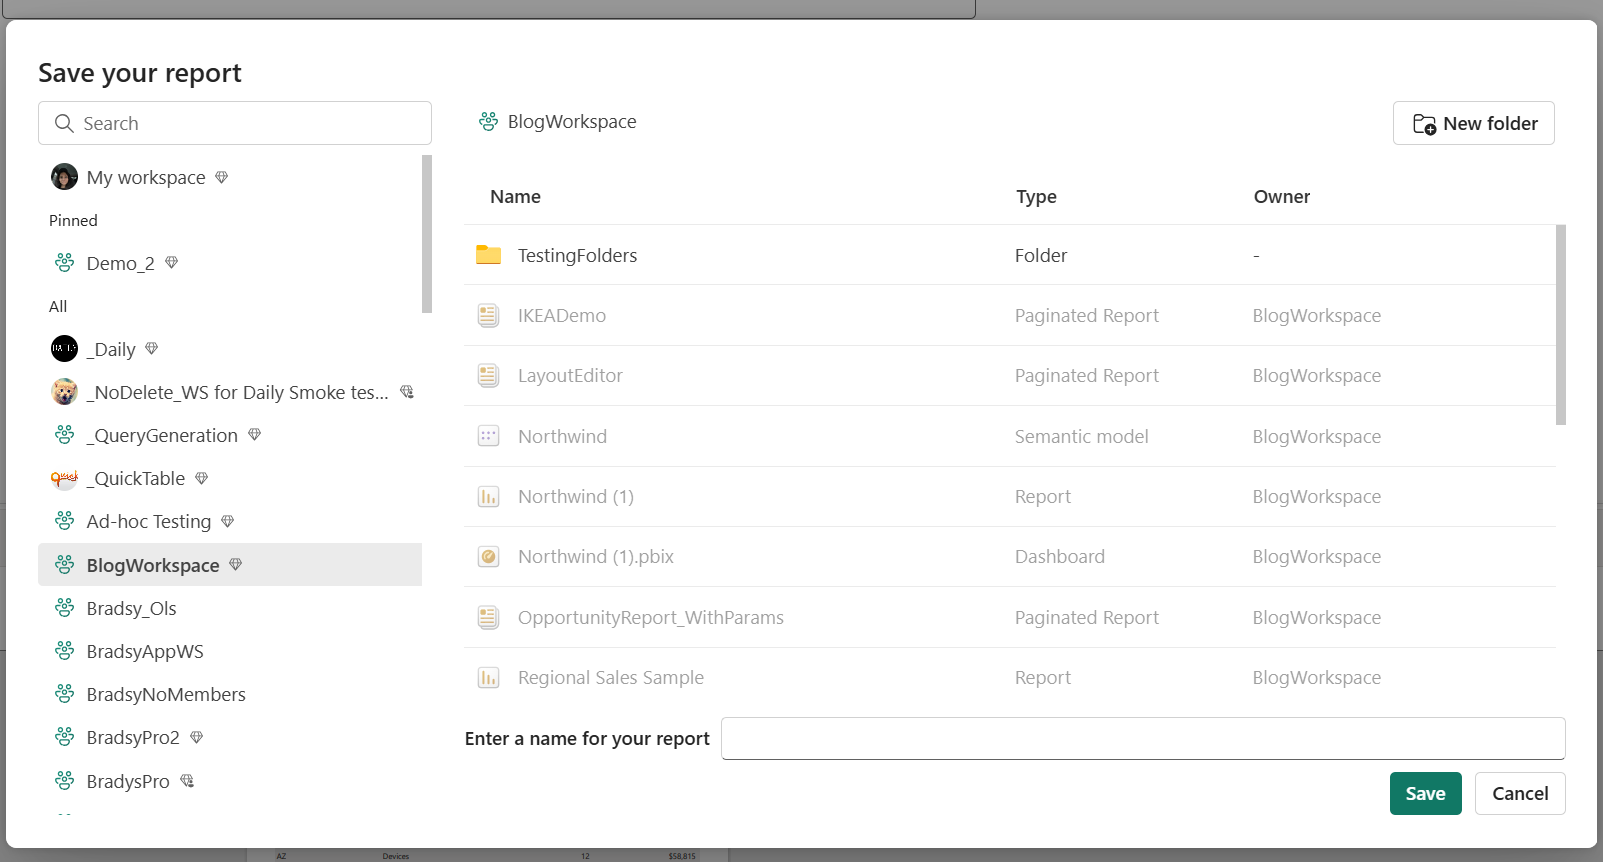
In Save your report, give your report a name and select a workspace.
After you save the report, you see a success or failure notification in the top right of the editor.
- If a report already exists where you have chosen to save, it asks you if you wish to overwrite the existing report.
- If it succeeds, you see a link to the report. You can either follow this link or continue editing.
Considerations and limitations
- You can create a paginated report in any workspace.
- You can't create a paginated report from Power BI semantic models based on a live connection.
- The online editor does not replicate all existing Power BI Report Builder functionality.
Related content
प्रतिक्रिया
जल्द आ रहा है: 2024 के दौरान हम सामग्री के लिए फीडबैक तंत्र के रूप में GitHub मुद्दों को चरणबद्ध तरीके से समाप्त कर देंगे और इसे एक नई फीडबैक प्रणाली से बदल देंगे. अधिक जानकारी के लिए, देखें: https://aka.ms/ContentUserFeedback.
के लिए प्रतिक्रिया सबमिट करें और देखें