नोट
इस पृष्ठ तक पहुंच के लिए प्राधिकरण की आवश्यकता होती है। आप साइन इन करने या निर्देशिकाएँ बदलने का प्रयास कर सकते हैं।
इस पृष्ठ तक पहुंच के लिए प्राधिकरण की आवश्यकता होती है। आप निर्देशिकाएँ बदलने का प्रयास कर सकते हैं।
One very common trick developers use to debug their applications is to
make calls to Console.WriteLine. However, on a mobile platform like
Android there is no console. Android devices provides a log that you
can use while writing apps. This is sometimes referred to as logcat
due to the command that you type to retrieve it. Use the Debug Log
tool to view the logged data.
Android Debug Log Overview
The Debug Log tool provides a way to view log output while debugging an app through Visual Studio. The debug log supports the following devices:
- Physical Android phones, tablets, and wearables.
- An Android Virtual device running on the Android Emulator.
Note
The Debug Log tool does not work with Xamarin Live Player.
The Debug Log does not display log messages that are generated while the app is running standalone on the device (i.e., while it is disconnected from Visual Studio).
Accessing the Debug Log from Visual Studio
To open the Device Log tool, click Device Log (logcat) icon on the toolbar:
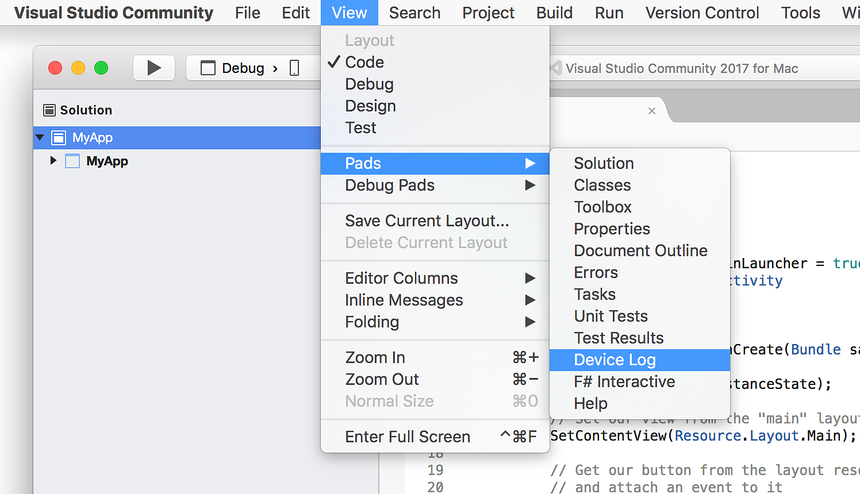
Alternately, launch the Device Log tool from one of the following menu selections:
- View > Other Windows > Device Log
- Tools > Android > Device Log
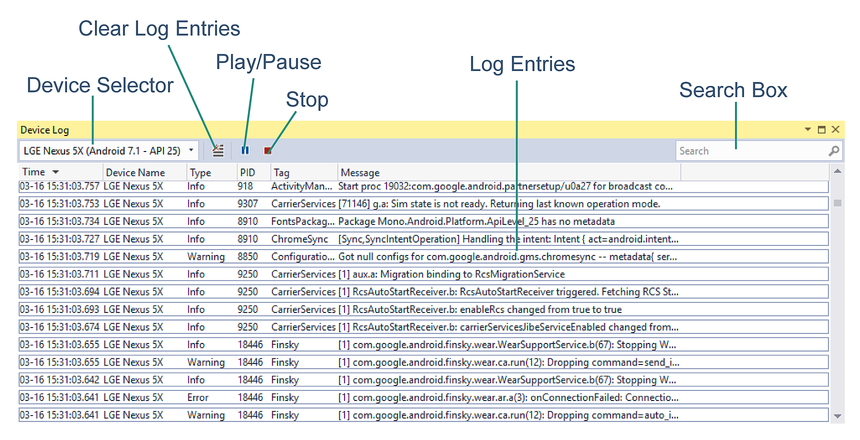
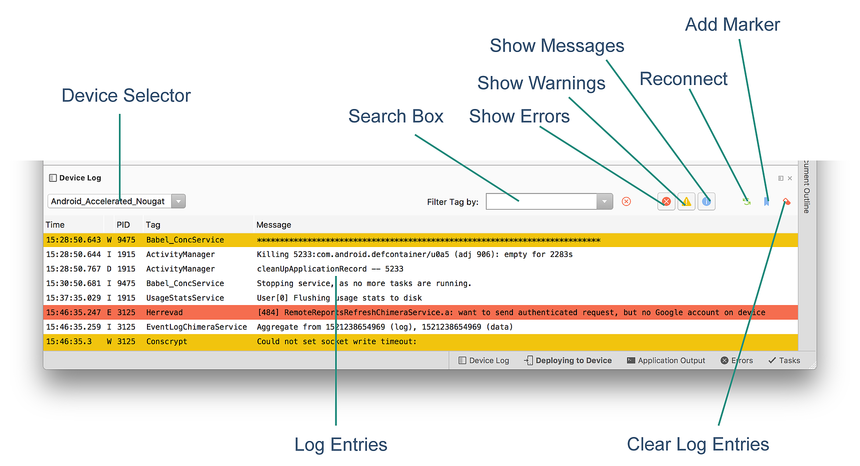
The following screenshot illustrates the various parts of the Debug Tool window:
Device Selector – Selects which physical device or running emulator to monitor.
Log Entries – A table of log messages from logcat.
Clear Log Entries – Clears all current log entries from the table.
Play/Pause – Toggles between updating or pausing the display of new log entries.
Stop – Halts the display of new log entries.
Search Box – Enter search strings in this box to filter for a subset of log entries.
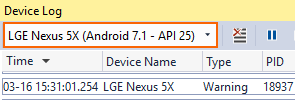
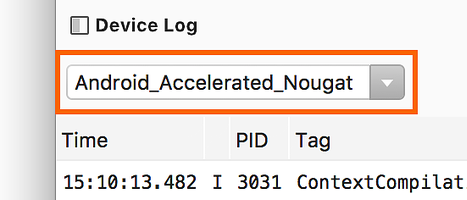
When the Debug Log tool window is displayed, use the device pull-down menu to choose the Android device to monitor:
After the device is selected, the Device Log tool automatically adds log entries from a running app – these log entries are shown in the table of log entries. Switching between devices stops and starts device logging. Note that an Android project must be loaded before any devices will appear in the device selector. If the device does not appear in the device selector, verify that it is available in the Visual Studio device drop-down menu next to the Start button.
Accessing from the Command Line
Another option is to view the debug log via the command line. Open a command prompt window and navigate to the Android SDK platform-tools folder (typically, the SDK platform-tools folder is located at C:\Program Files (x86)\Android\android-sdk\platform-tools).
If only a single device (physical device or emulator) is attached, the log can be viewed by entering the following command:
$ adb logcat
If more than one device is attached, the device must be explicitly identified. For example adb -d logcat displays the log of the only physical device connected, while adb -e logcat shows the log of the only emulator running.
More commands can be found by entering adb and reading the help messages.
Writing to the Debug Log
Messages can be written to the Debug Log by using the methods of the Android.Util.Log class. For example:
string tag = "myapp";

Log.Info (tag, "this is an info message");
Log.Warn (tag, "this is a warning message");
Log.Error (tag, "this is an error message");
This produces output similar to the following:
I/myapp   (11103): this is an info message
W/myapp   (11103): this is a warning message
E/myapp   (11103): this is an error message
It is also possible to use Console.WriteLine to write to the Debug
Log – these messages appear in logcat with a slightly different
output format (this technique is particularly useful when debugging
Xamarin.Forms apps on Android):
System.Console.WriteLine ("DEBUG - Button Clicked!");
This produces output similar to the following in logcat:
Info (19543) / mono-stdout: DEBUG - Button Clicked!
Interesting Messages
When reading the log (and especially when providing log snippets to others), perusing the log file in its entirety is often too cumbersome. To make it easier to navigate through log messages, start by looking for a log entry that resembles the following:
I/ActivityManager(12944): Starting: Intent { act=android.intent.action.MAIN cat=[android.intent.category.LAUNCHER] flg=0x10200000 cmp=GcTest.GcTest/gctest.Activity1 } from pid 24175
In particular, look for a line matching the regular expression that also contains the name of the application package:
^I.*ActivityManager.*Starting: Intent
This is the line which corresponds to the start of an activity, and most (but not all) of the following messages should relate to the application.
Notice that every message contains the process identifier (pid) of
the process generating the message. In the above ActivityManager
message, process 12944 generated the message. To determine which
process is the process of the application being debugged, look for the
mono.MonoRuntimeProvider message:
I/ActivityThread( 602): Pub TouchTest.TouchTest.__mono_init__: mono.MonoRuntimeProvider
This message comes from the process that was started. All subsequent messages that contain this pid come from the same process.

