Napomena
Za pristup ovoj stranici potrebna je autorizacija. Možete se pokušati prijaviti ili promijeniti direktorije.
Za pristup ovoj stranici potrebna je autorizacija. Možete pokušati promijeniti direktorije.
The Azure Stream Analytics (ASA) extension for Visual Studio Code lets you manage your cloud Stream Analytics jobs without leaving your editor. You can monitor and troubleshoot jobs on Windows, macOS, and Linux. By using the extension, you can:
- Create, start, and stop a cloud job in Azure.
- Export existing jobs to a local machine.
- List jobs and view job entities.
- View and debug a job by using the Job Diagram and Job Monitor.
Export a job to a local machine
Export an existing cloud job to your local machine so you can edit and manage it in Visual Studio Code.
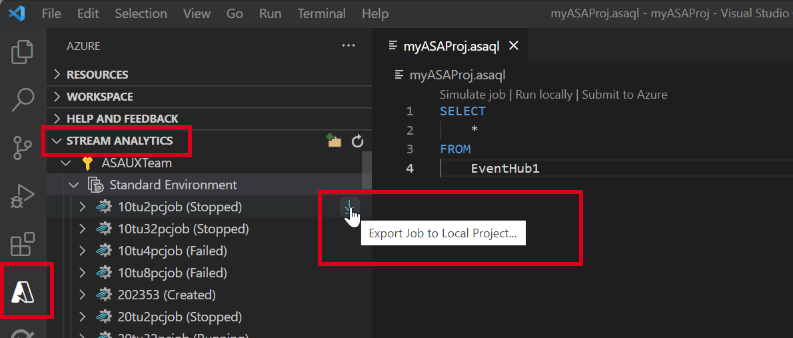
- Open Visual Studio Code and select the Azure icon on the activity bar. If you didn't install the ASA extension, follow the steps to set up the Stream Analytics extension.
- Select STREAM ANALYTICS in the explorer to locate the job you want to export.
List a job and view job entities
Use the job view to interact with Azure Stream Analytics jobs from Visual Studio Code.
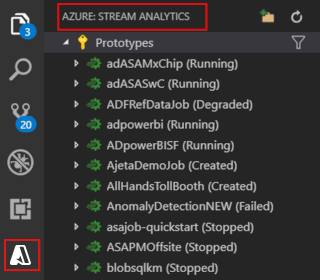
Select the Azure icon on the Visual Studio Code activity bar and then expand the Stream Analytics node. Your jobs appear under your subscriptions.
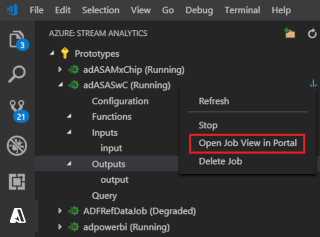
Expand your job node to open and view the job query, configuration, inputs, outputs, and functions.
Select and hold (or right-click) your job node, and select Open Job View in Portal to open the job view in the Azure portal.
View job diagram and job summary
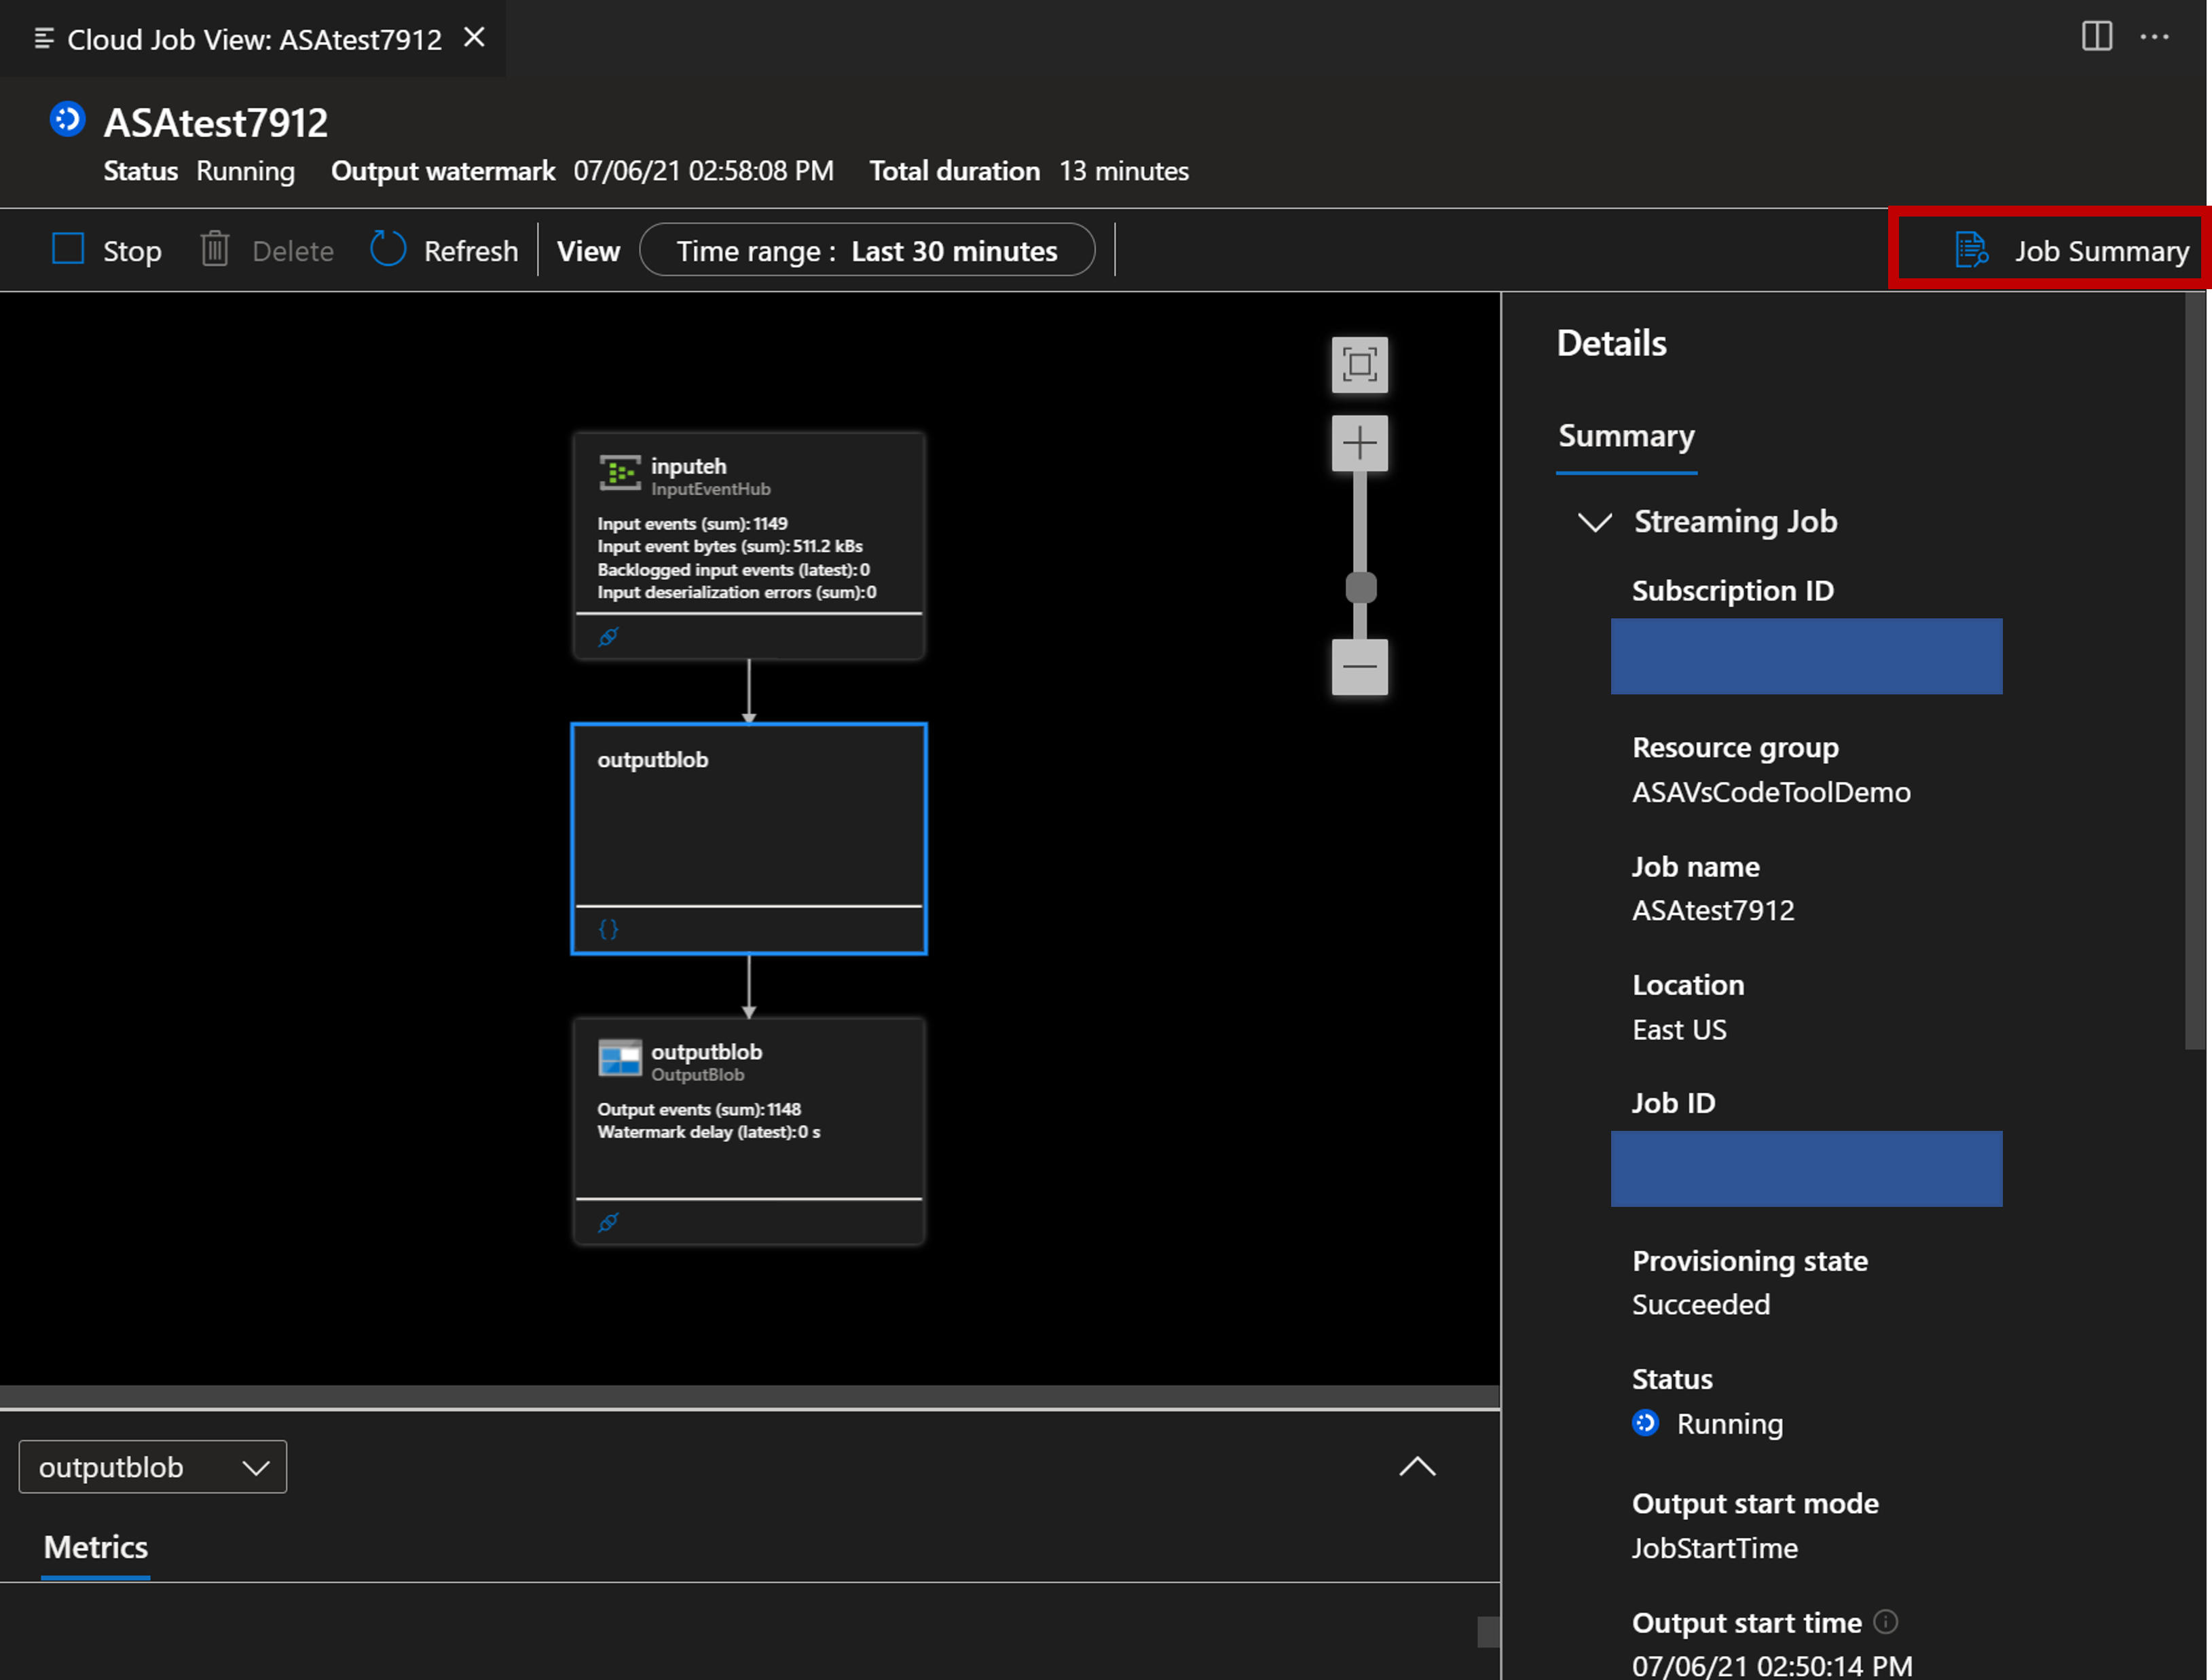
Use Job Monitor in Visual Studio Code to view and troubleshoot your Azure Stream Analytics jobs. Open the job diagram and review the job summary to get started.
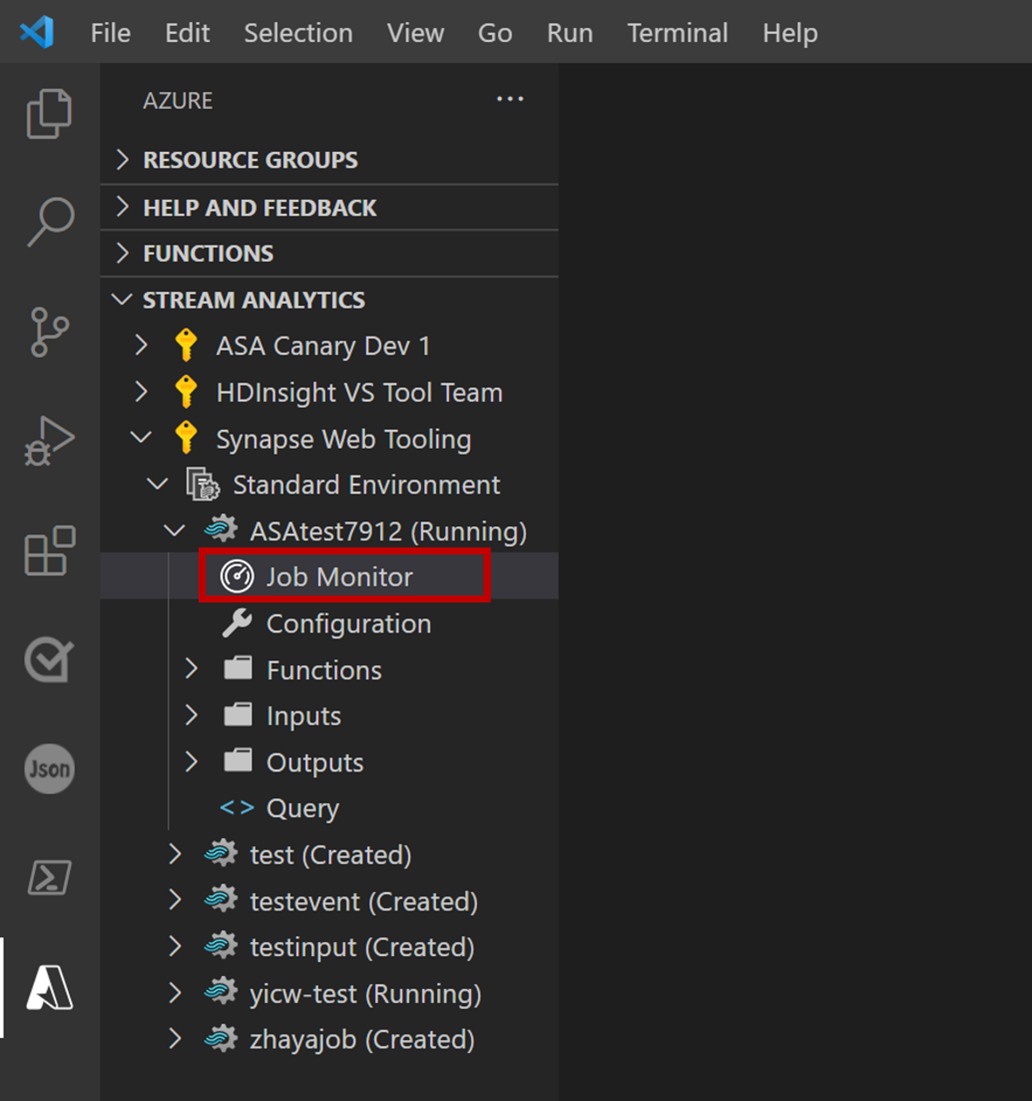
Select Job Monitor. The Job Monitor opens, and the job diagram loads automatically.
View your job diagram and select Job Summary to view the properties and information of your job.
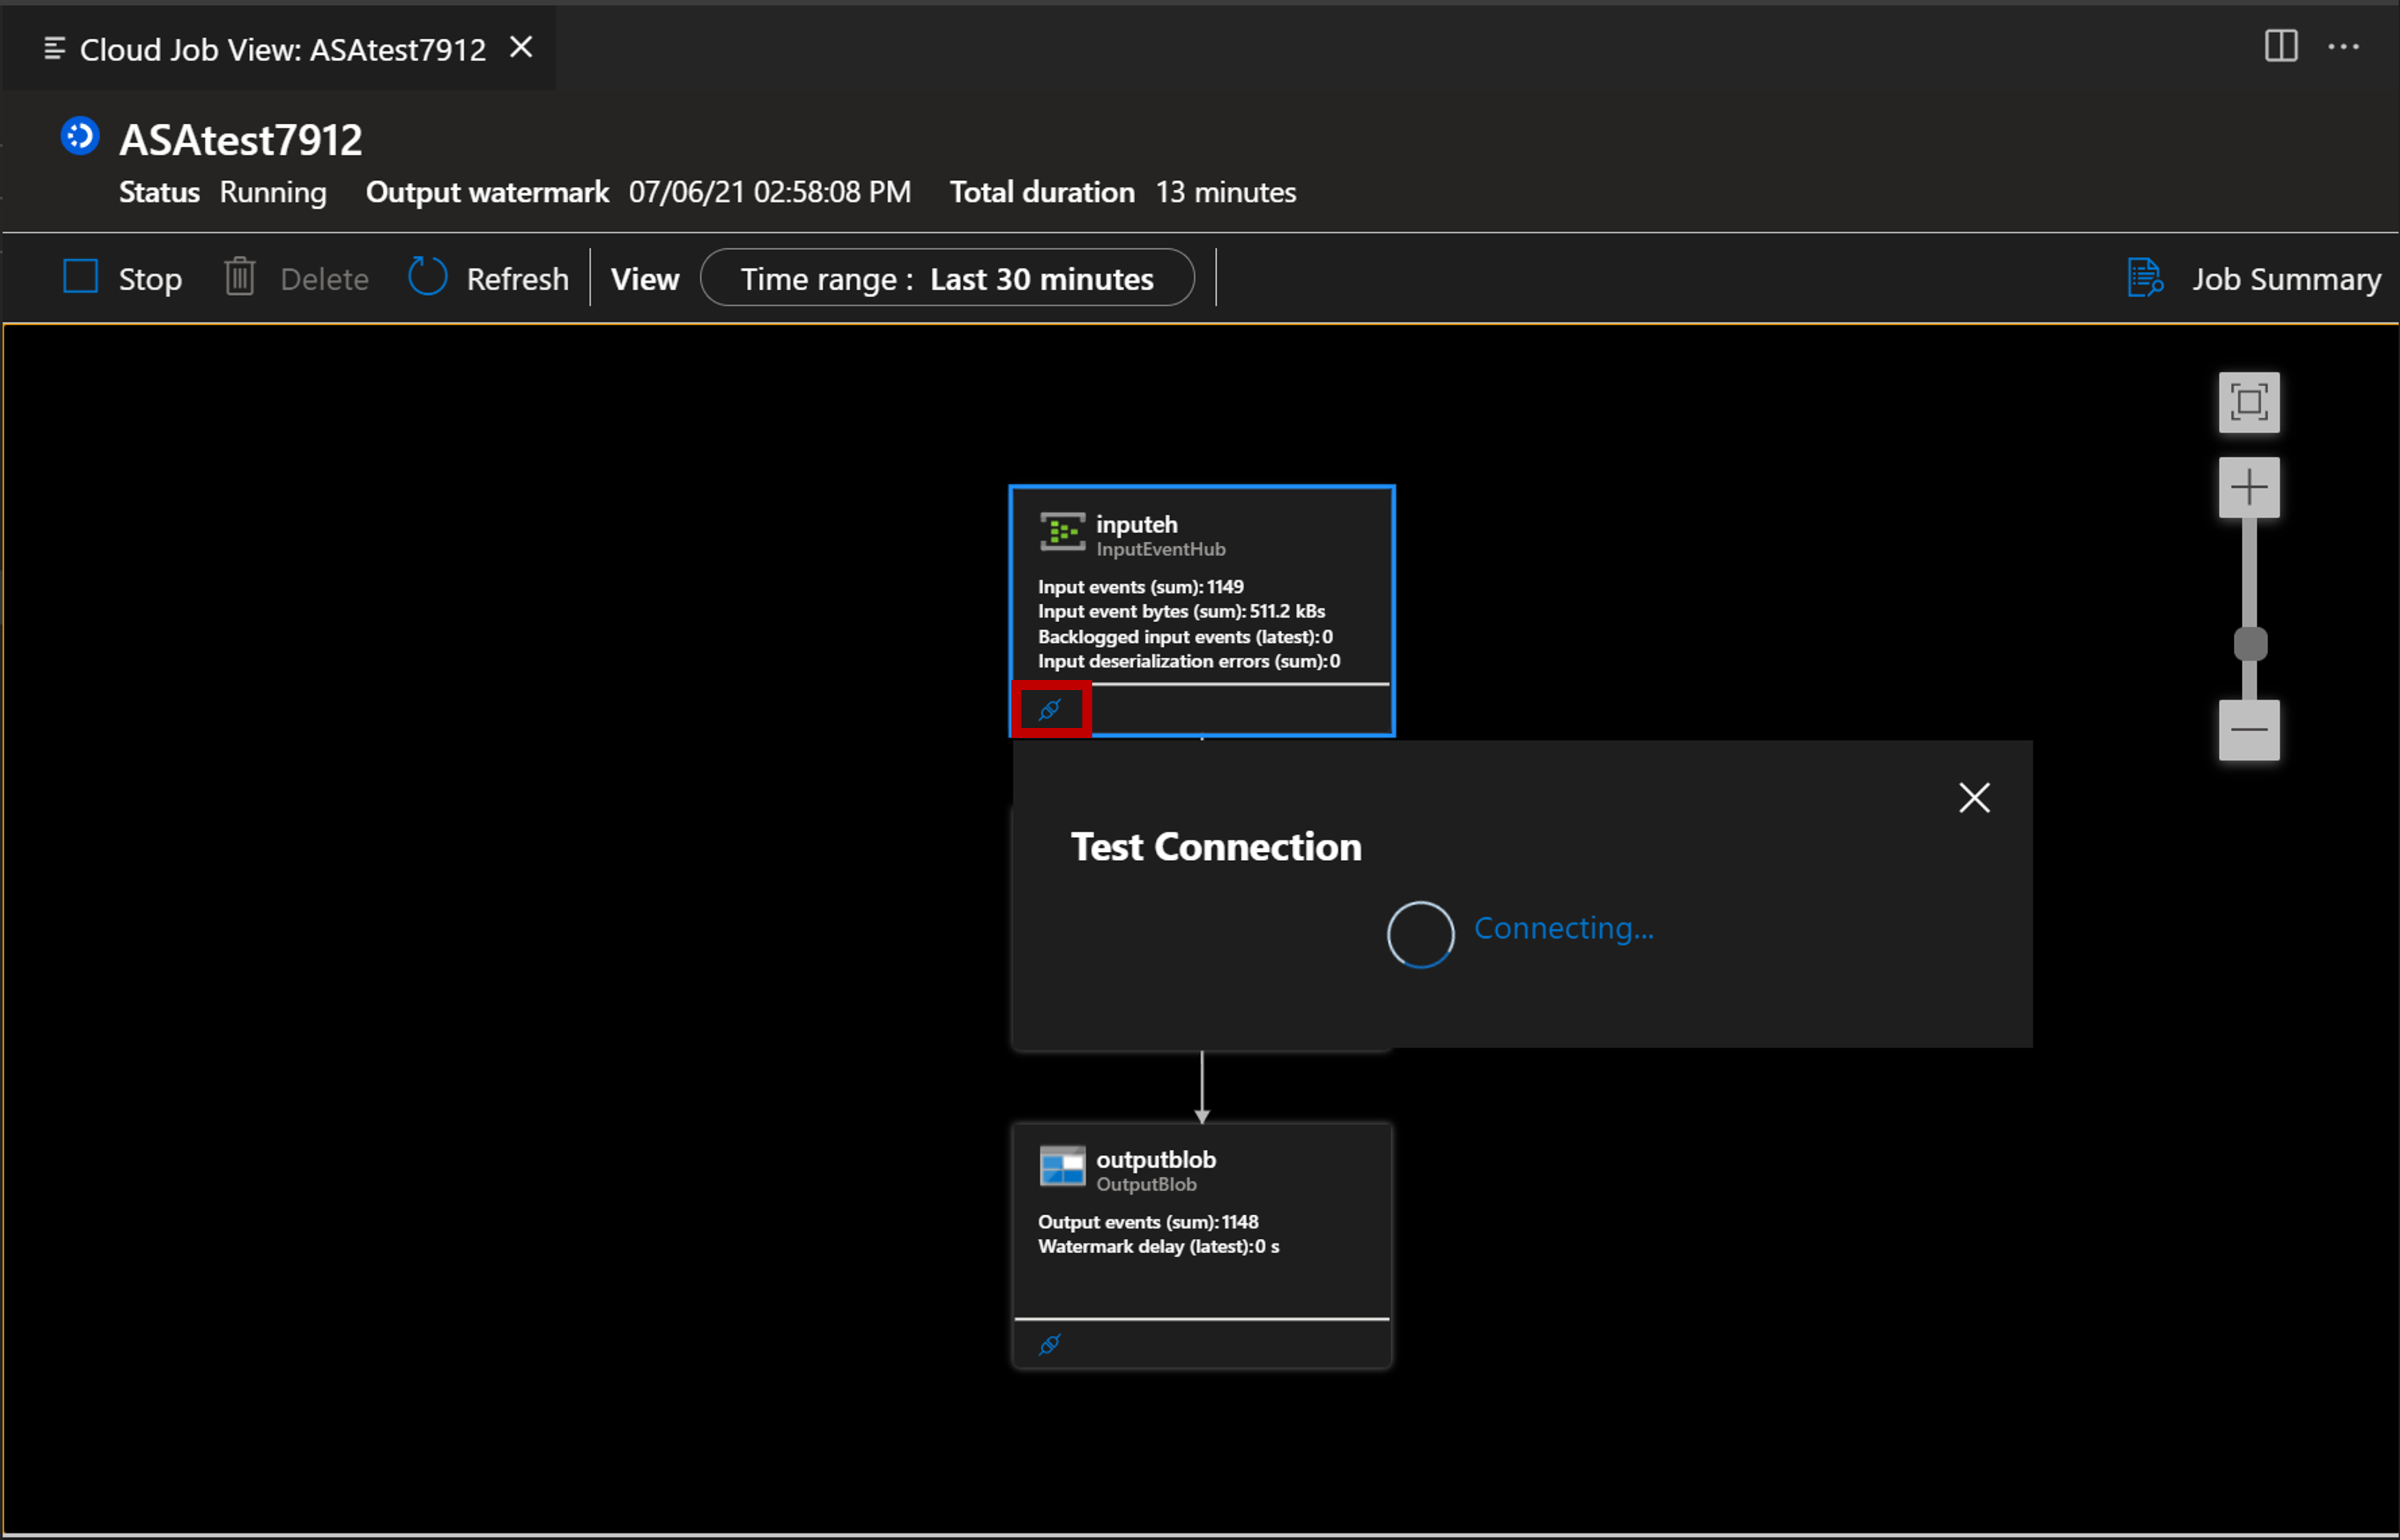
Select Test Connection to test the connection to your input and output.
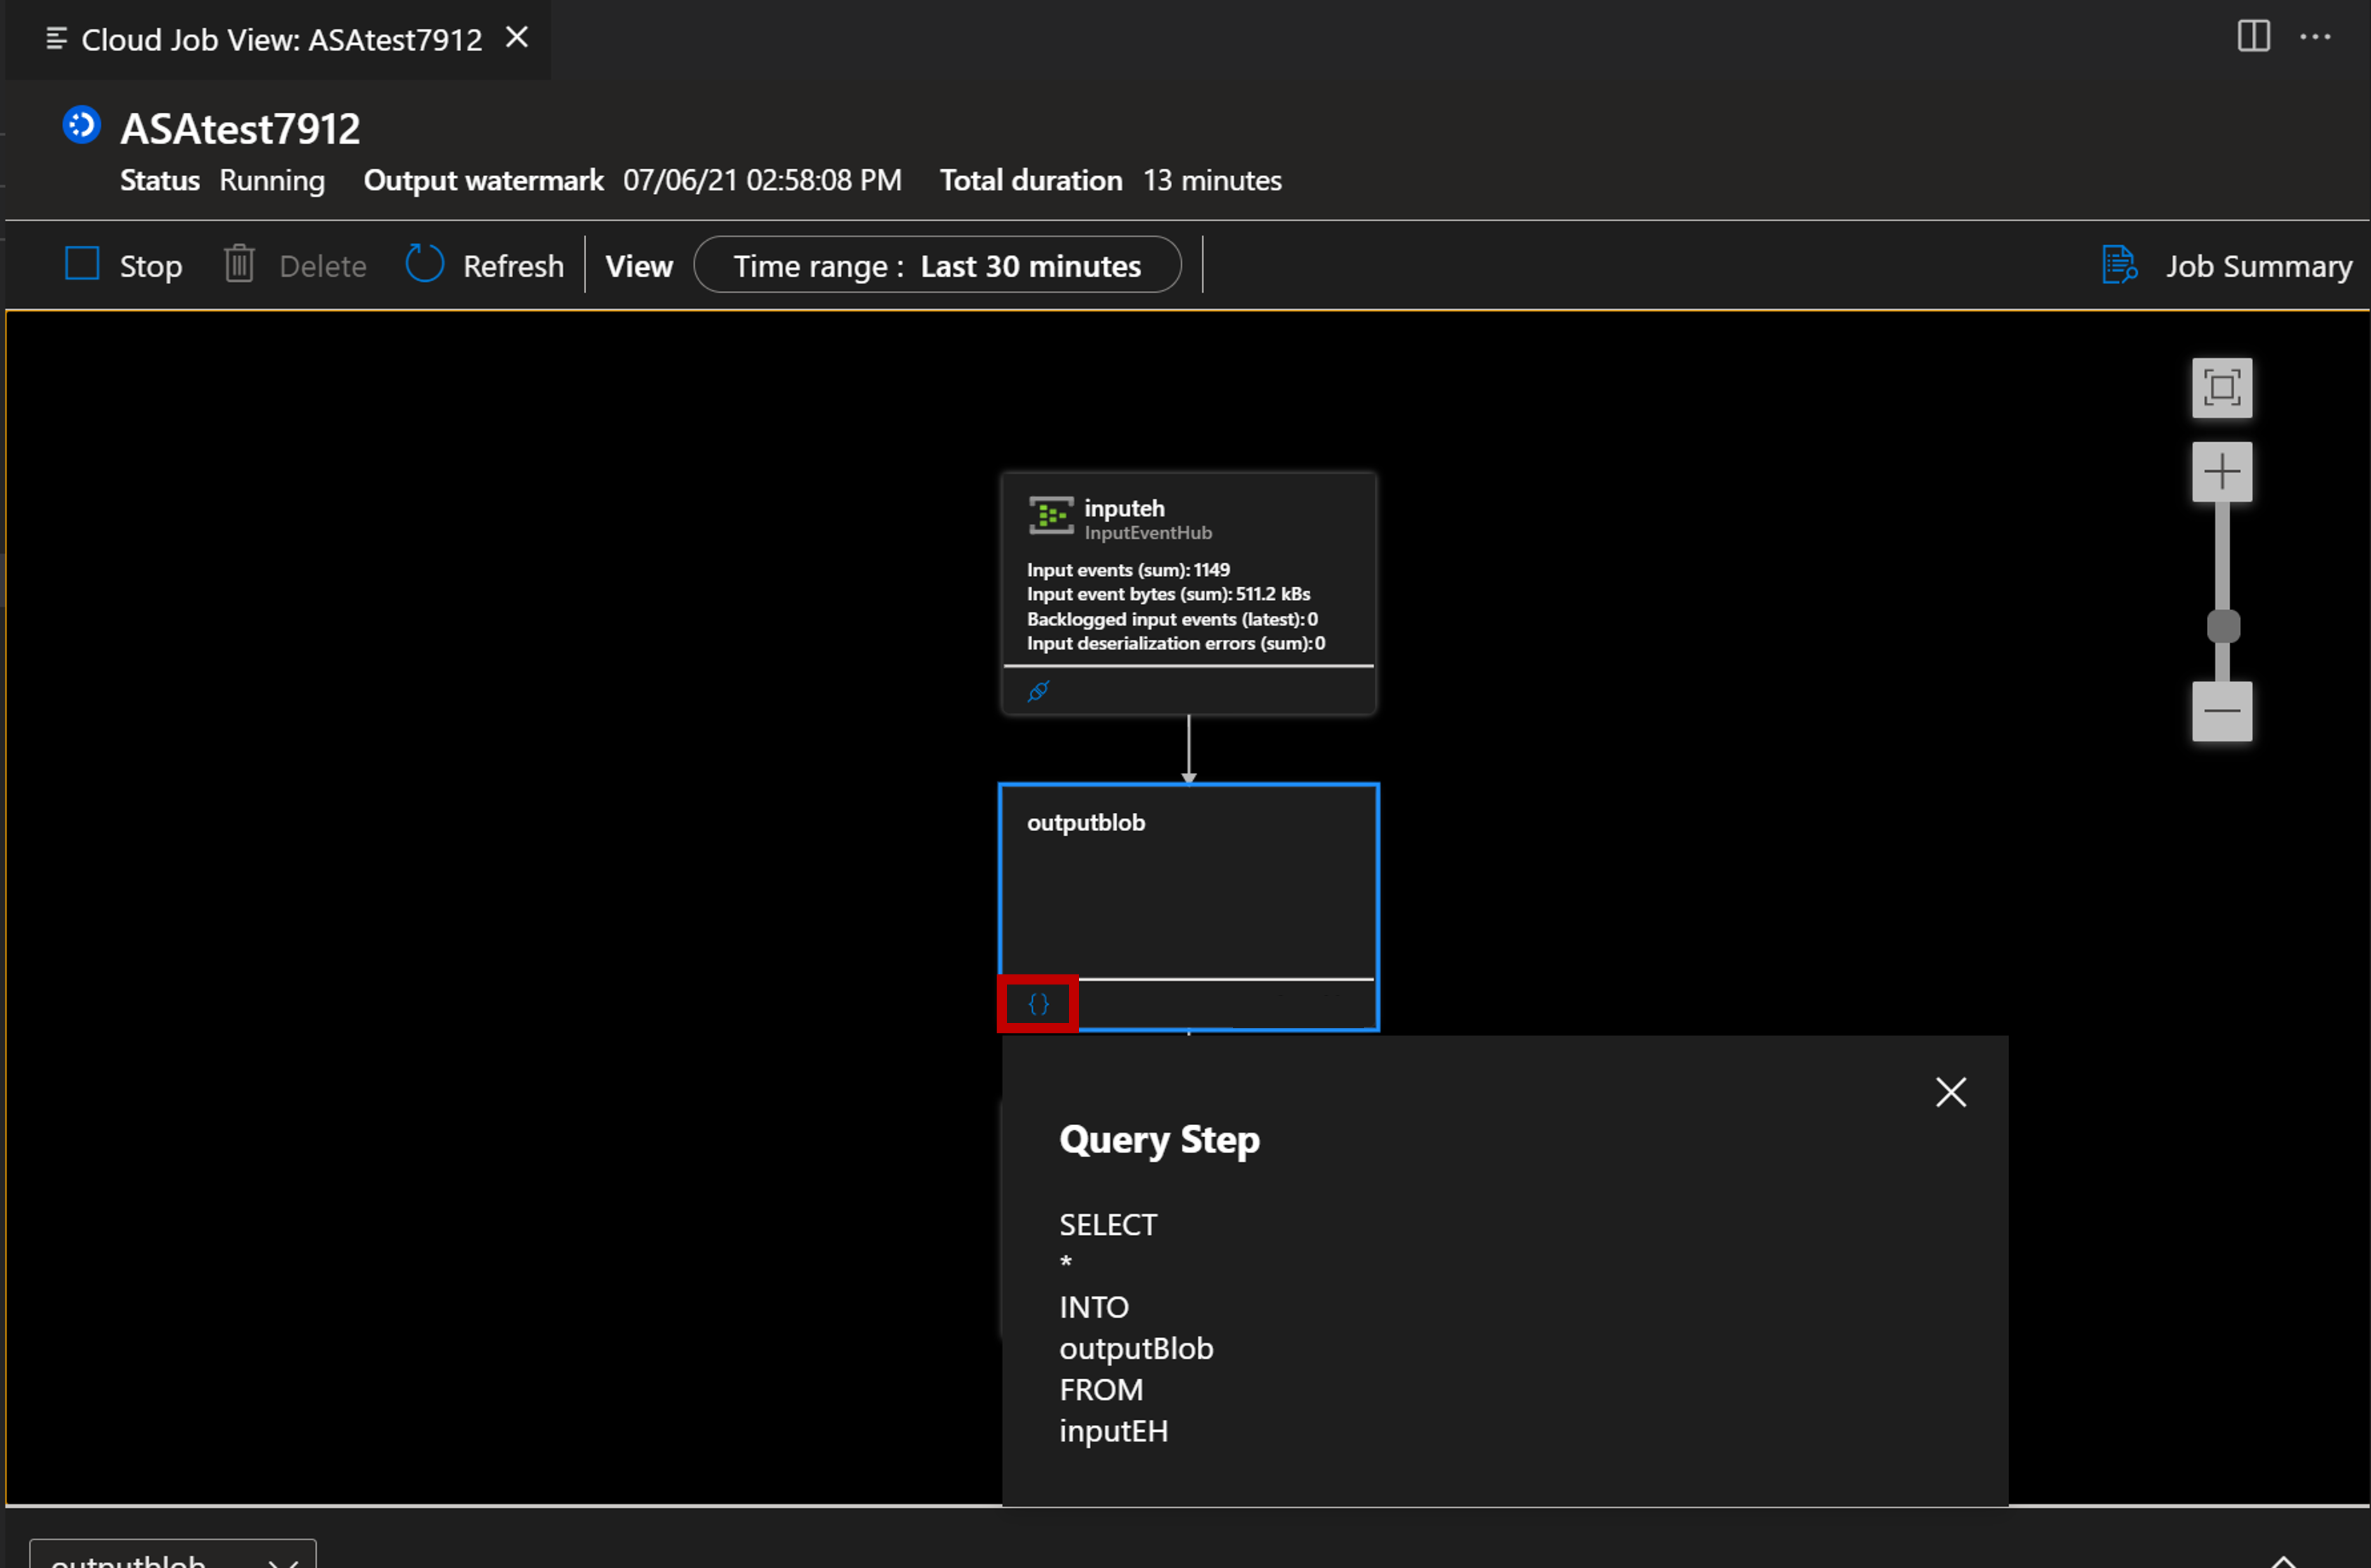
Select Locate Script to view your query.
Monitor and debug with metrics
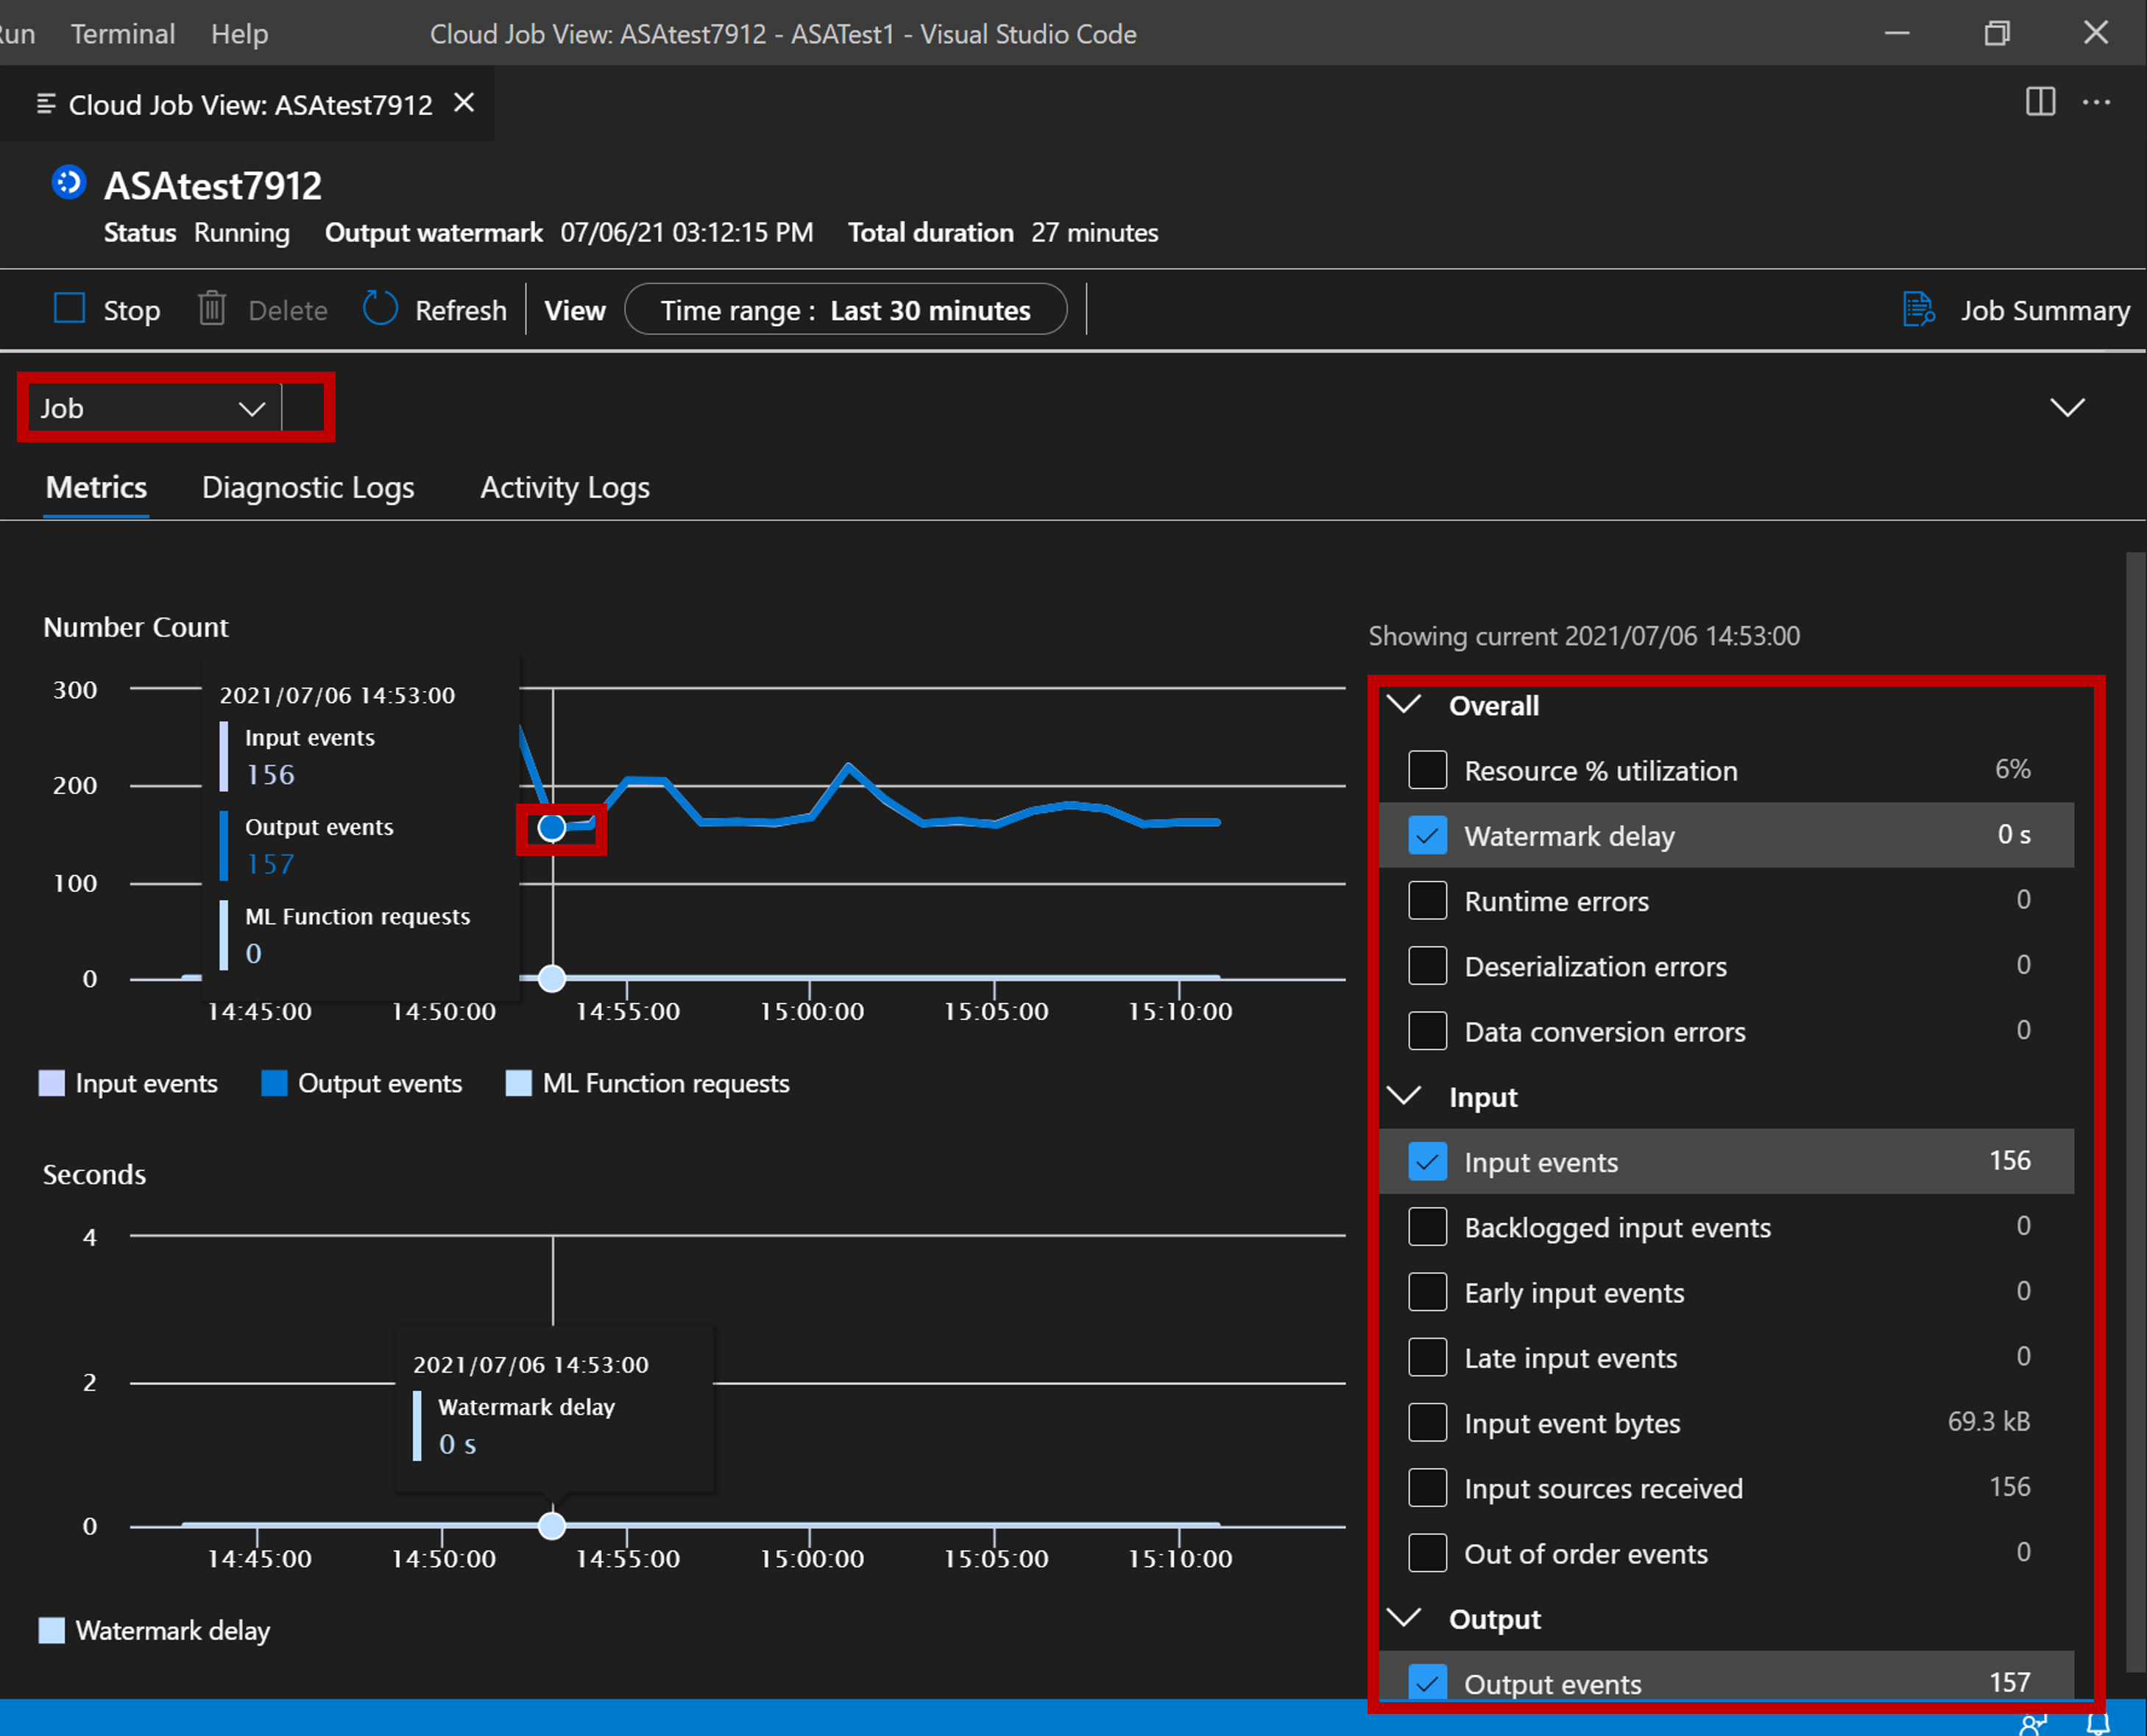
Use the Metrics panel to analyze job-level and node-level metrics while you debug your job.
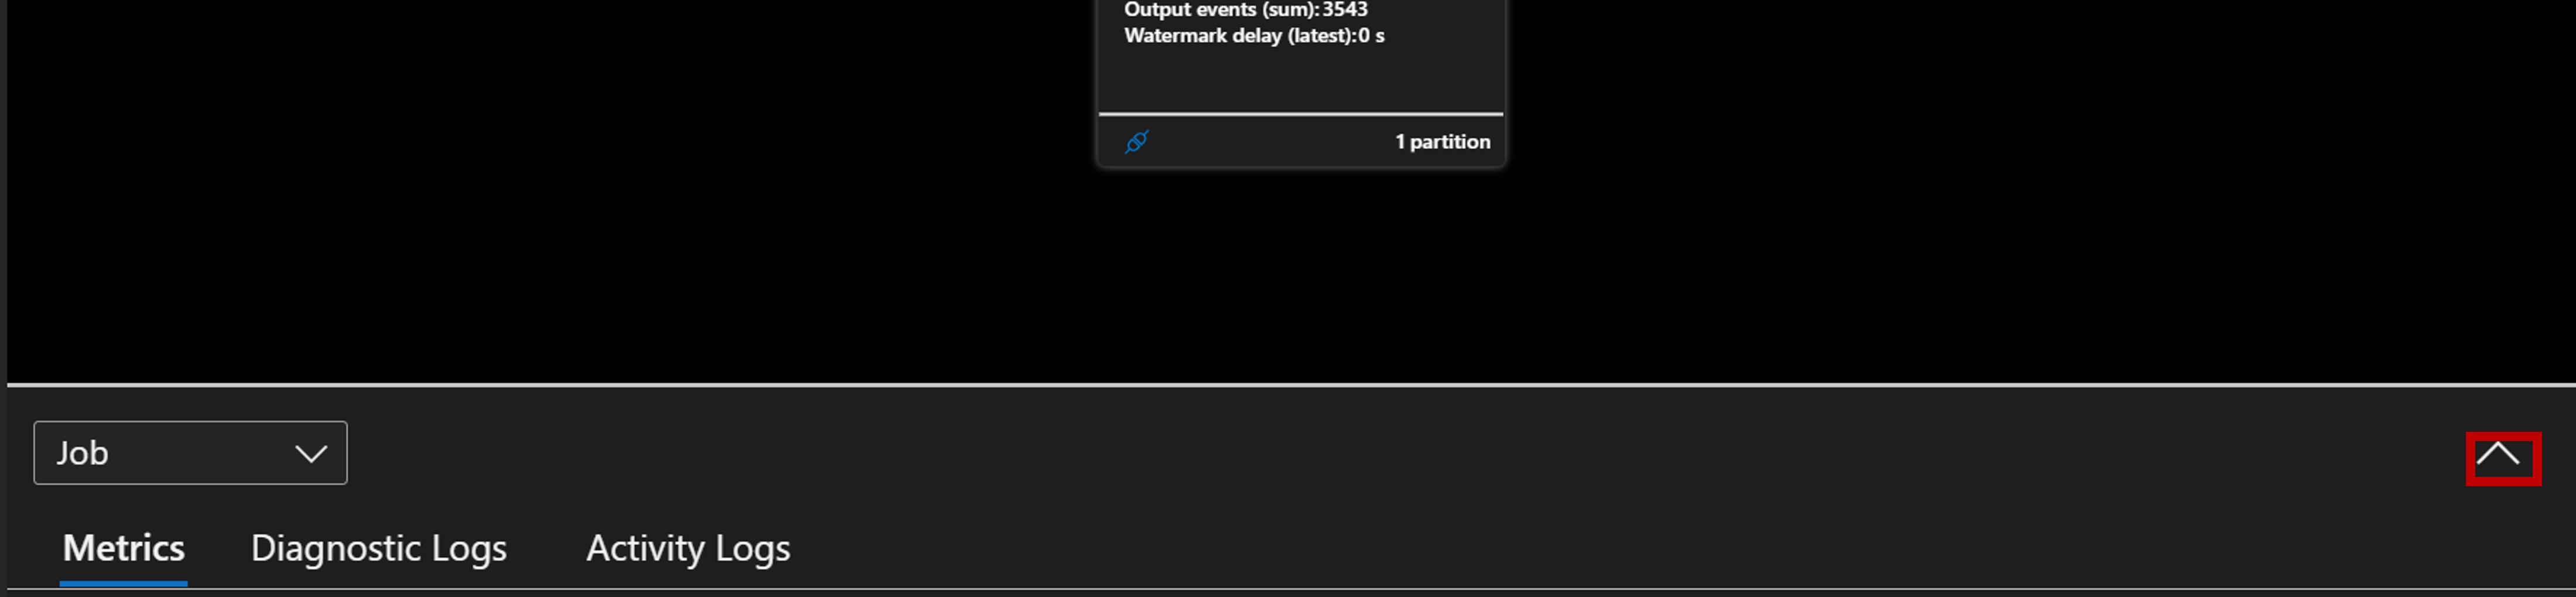
Select the arrow button to open the Metrics panel.
Analyze your job with the key metrics shown in the chart. View job-level or node-level metrics, and select which metrics to show in the chart.
Debug with diagnostic logs and activity logs
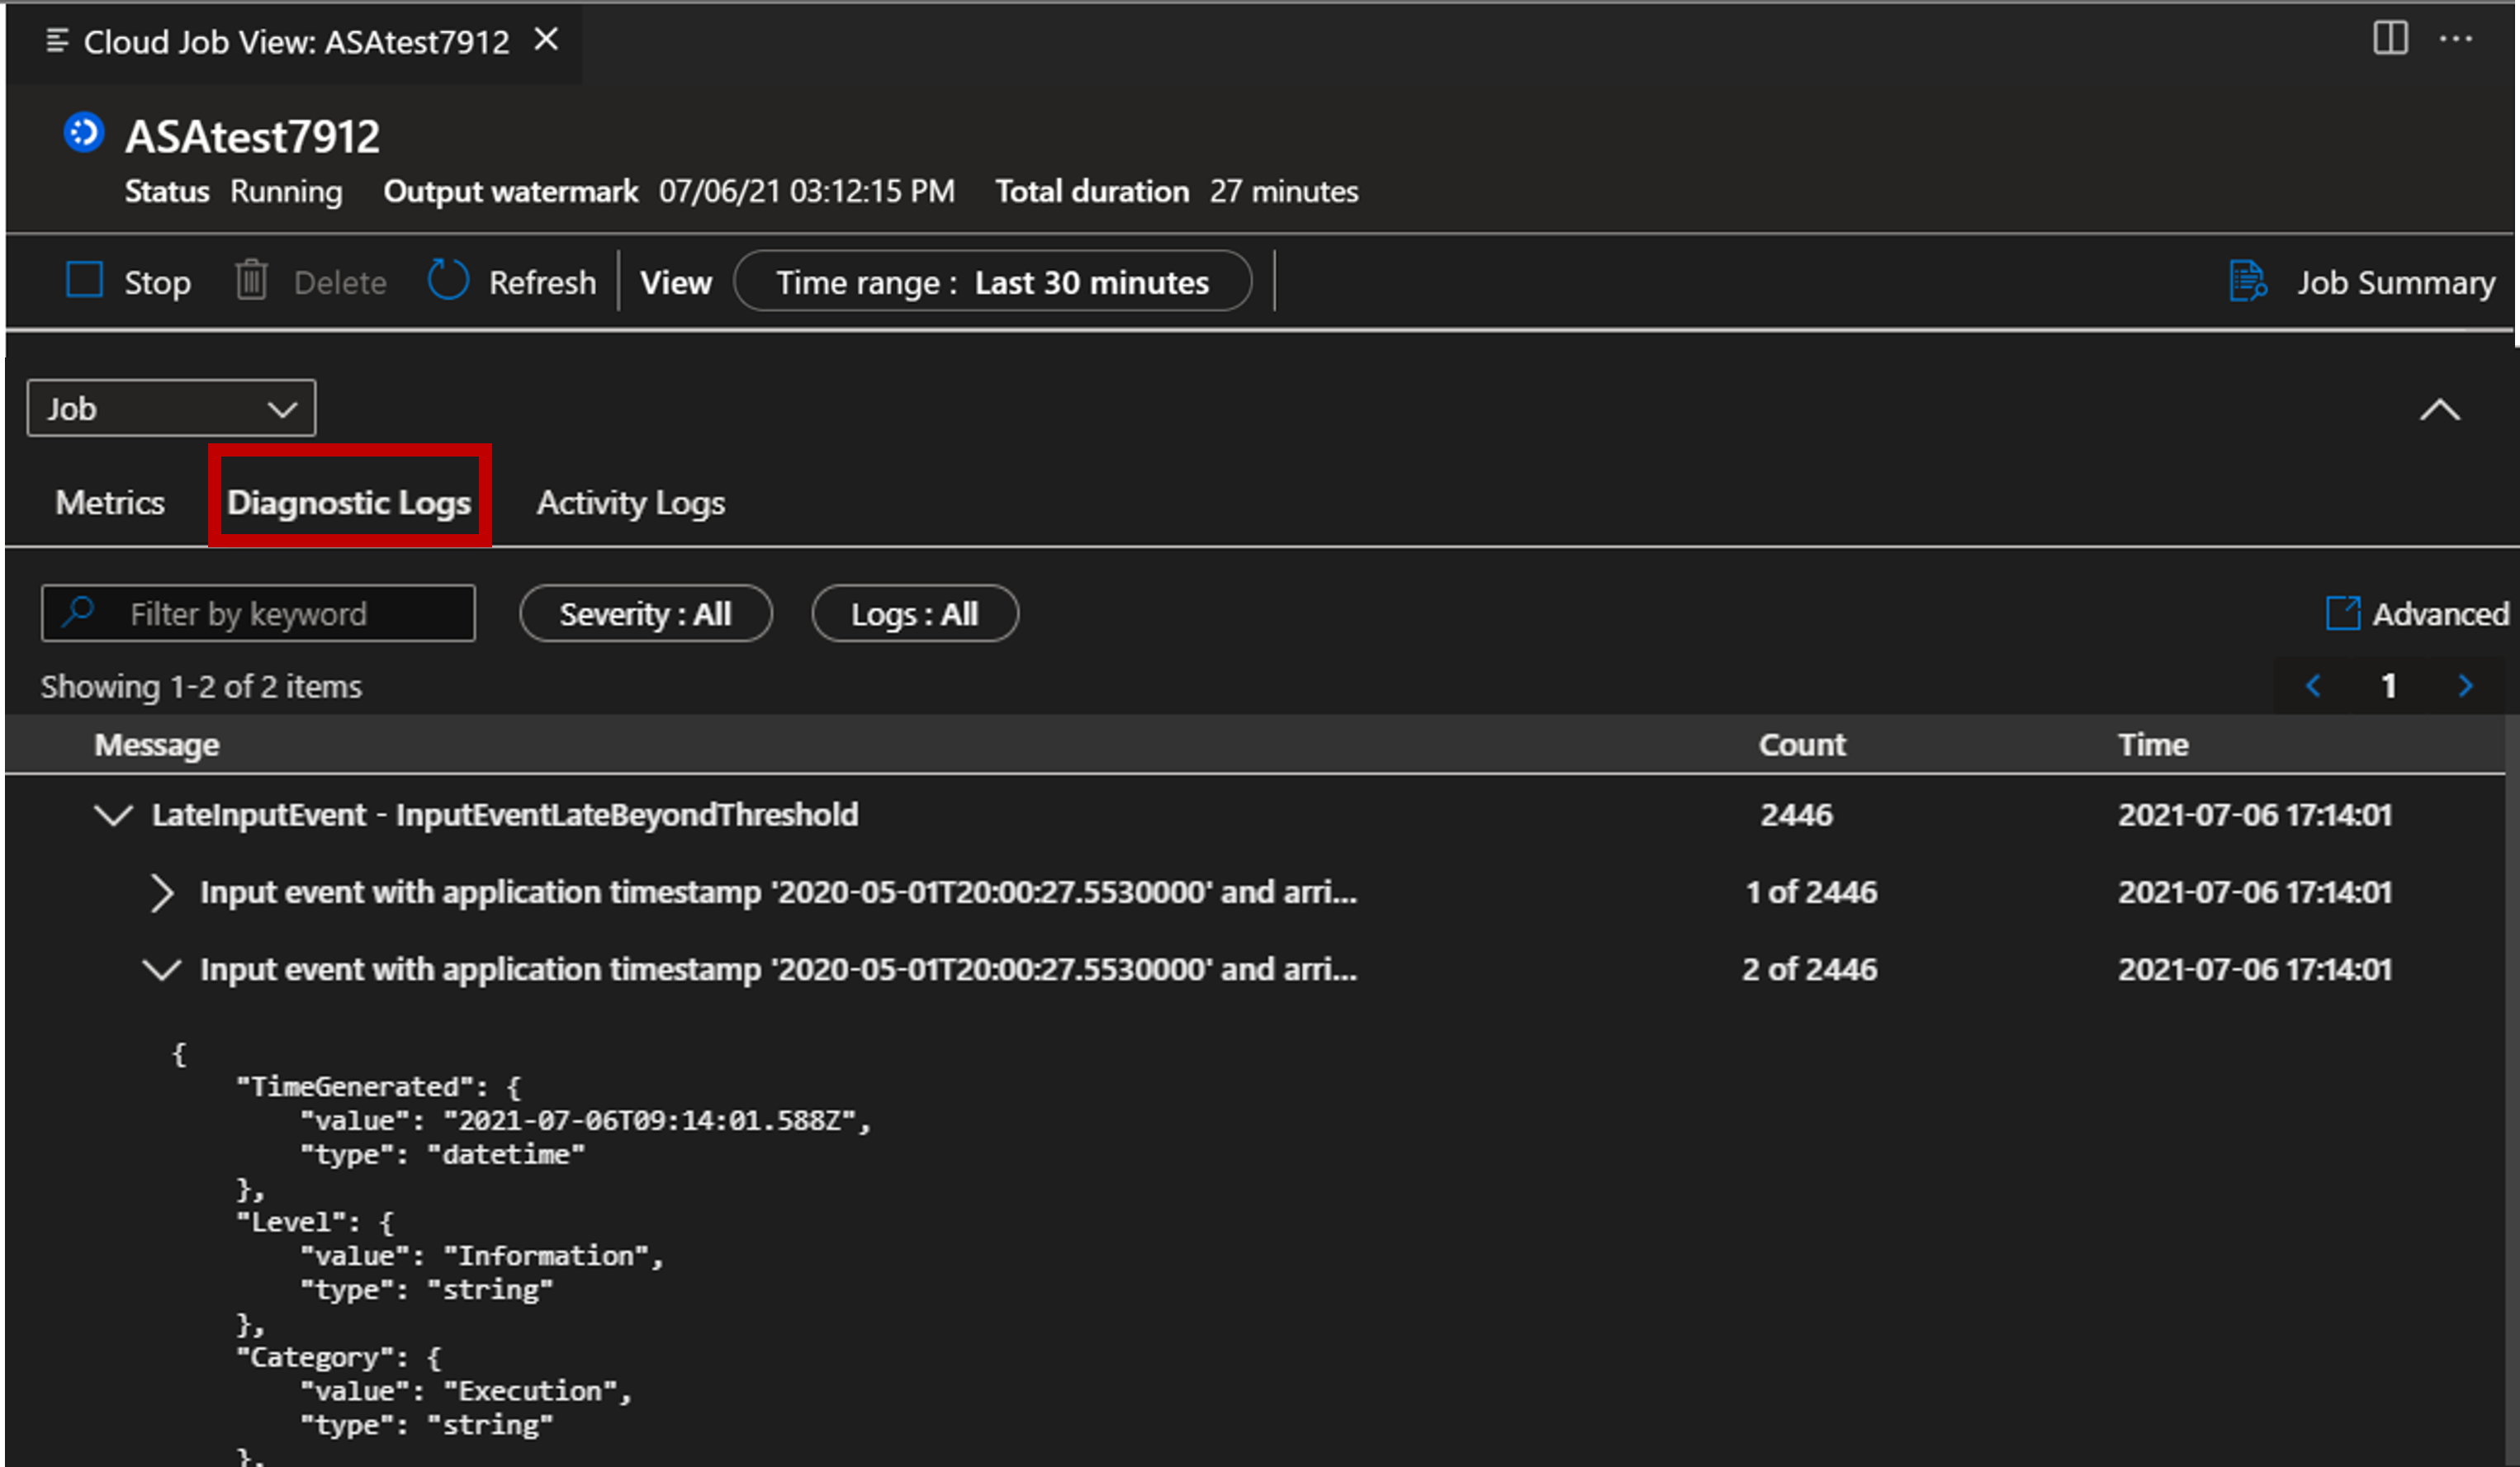
View your job's diagnostic logs and activity logs to troubleshoot issues.
Select the Diagnostic Logs tab.
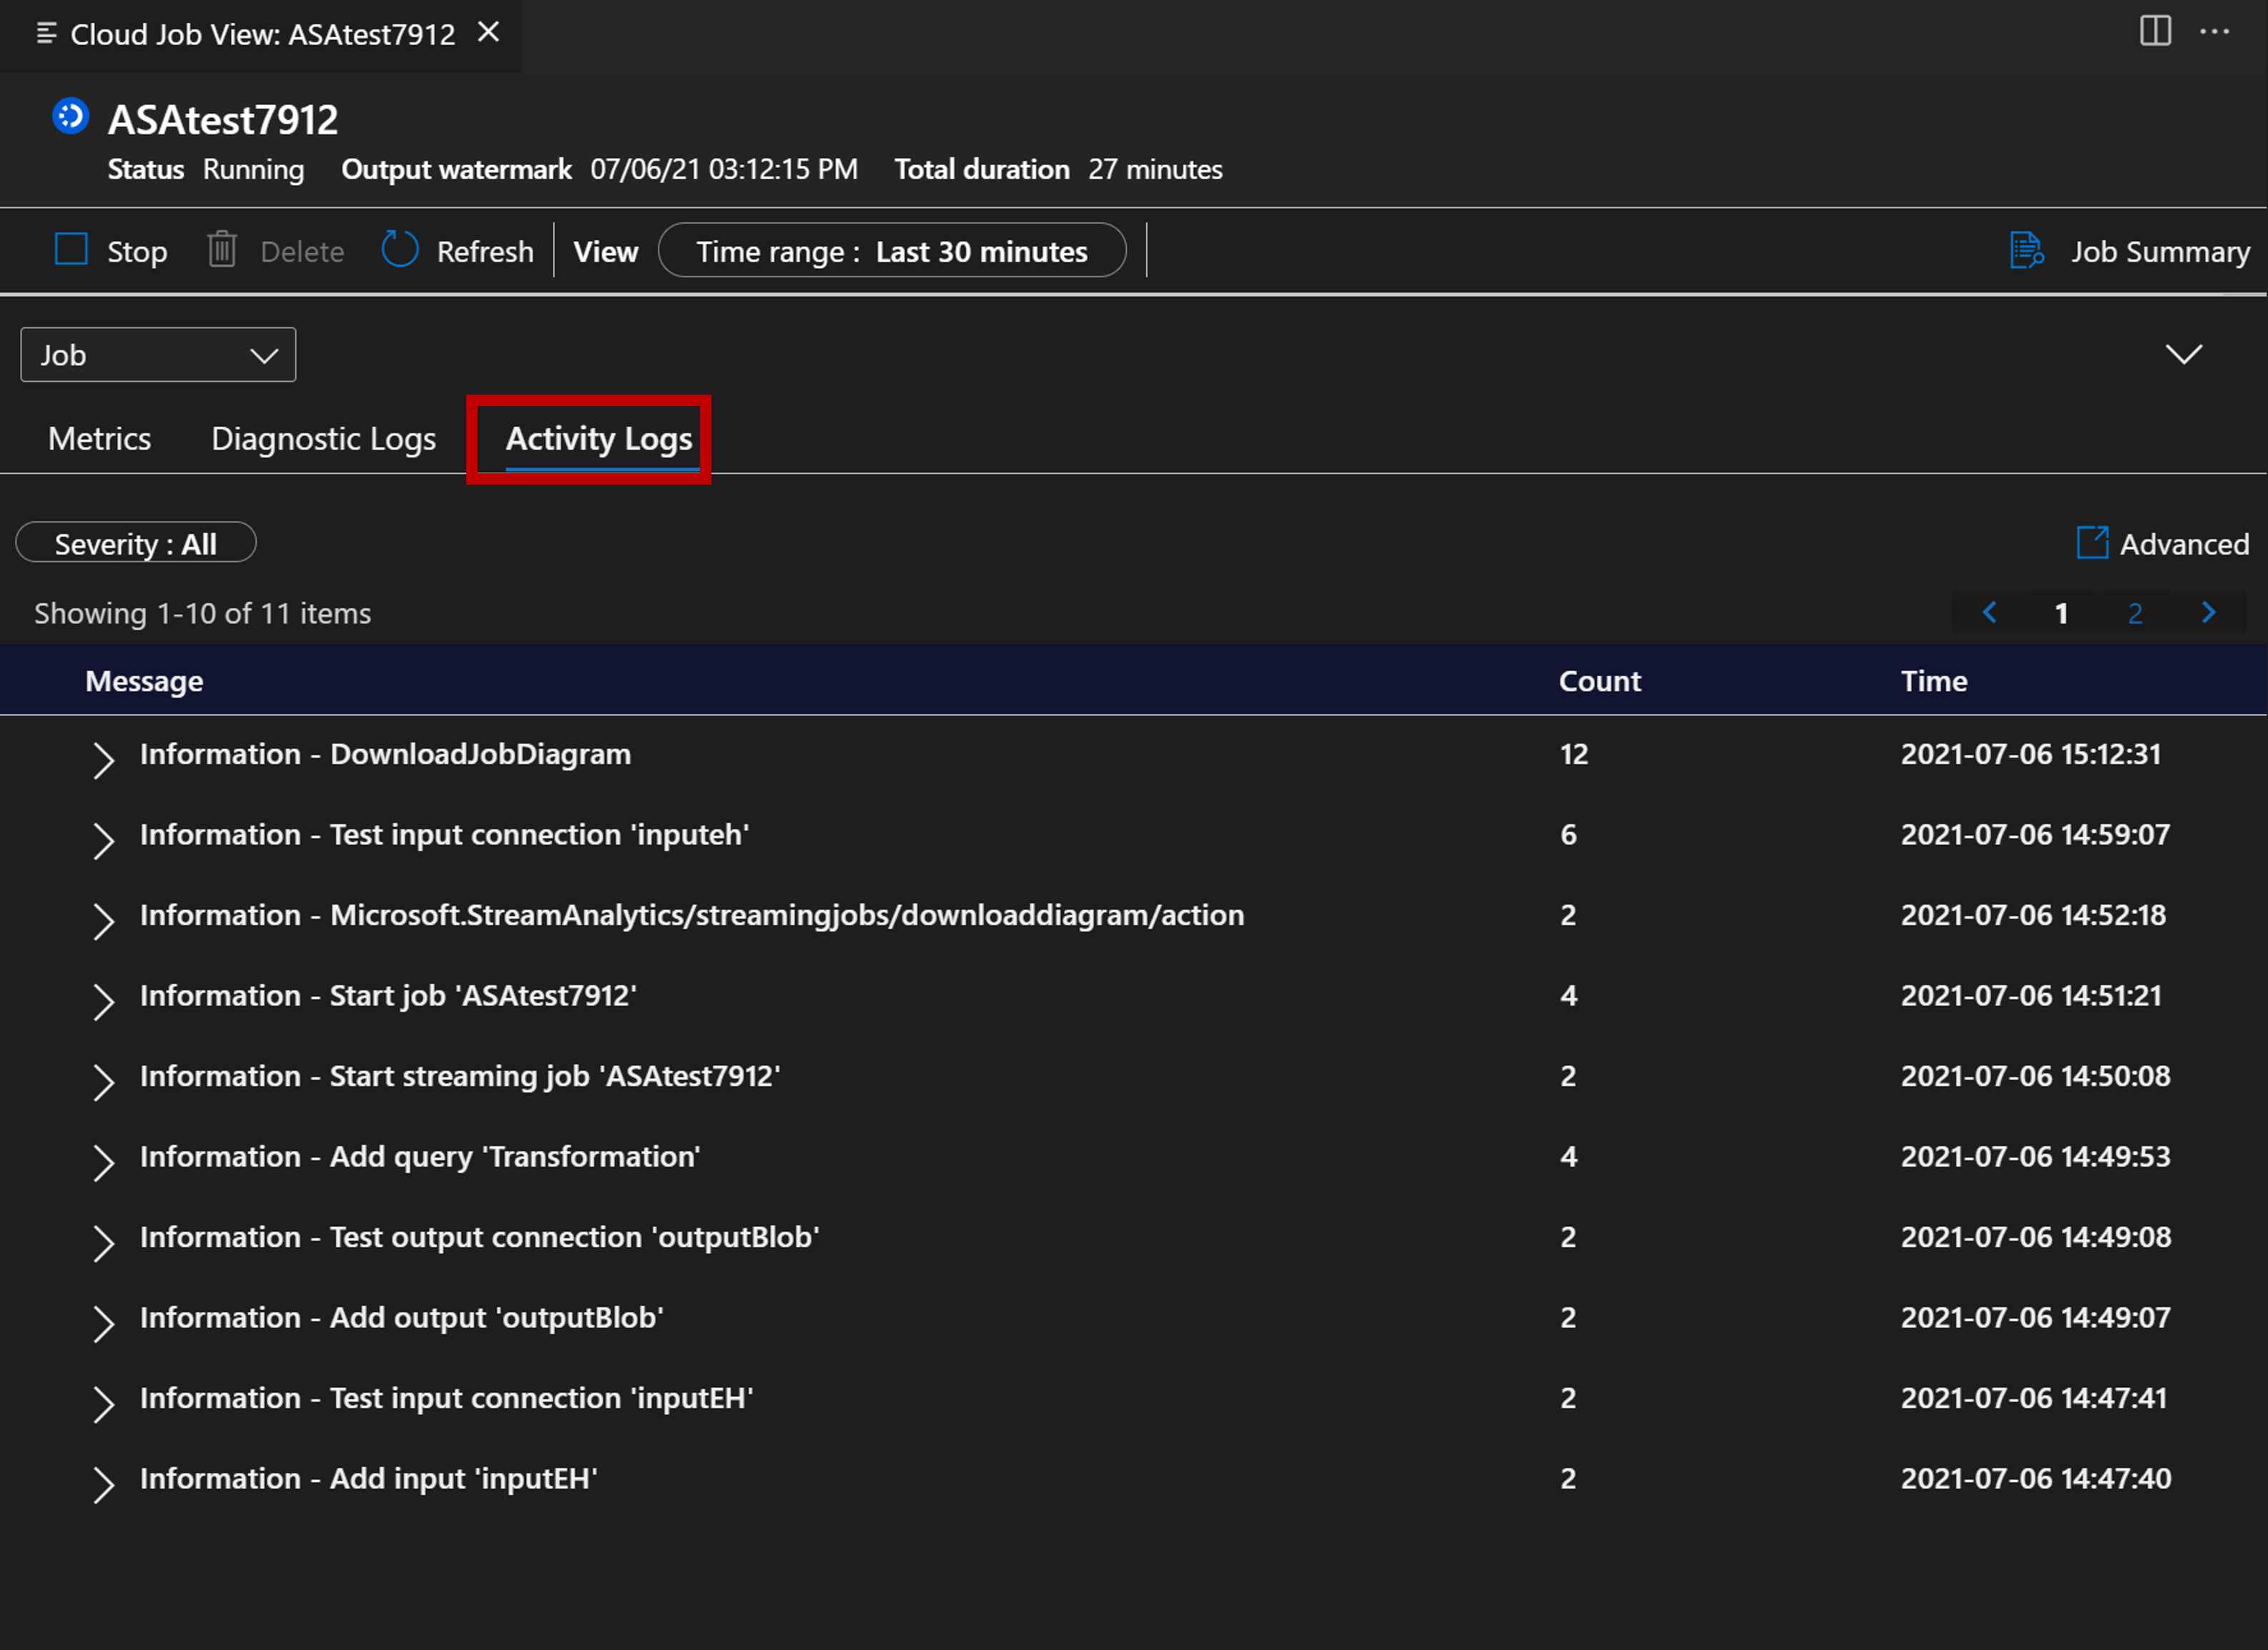
Select the Activity Logs tab.