Napomena
Za pristup ovoj stranici potrebna je autorizacija. Možete se pokušati prijaviti ili promijeniti direktorije.
Za pristup ovoj stranici potrebna je autorizacija. Možete pokušati promijeniti direktorije.
Microsoft Purview Data Map is the foundation for data discovery and data governance in Microsoft Purview. It captures metadata about data in analytics, software-as-a-service (SaaS), and operational systems across hybrid, on-premises, and multicloud environments. Built-in scanning and classification keep the Data Map up to date.
This overview helps Microsoft Purview admins plan capacity and monitor Data Map usage and costs. Every Microsoft Purview account has a Data Map that starts at one capacity unit and can scale based on request load and the amount of metadata stored.
Capacity and autoscaling
The Data Map has two capacity components: metadata storage and operation throughput. A capacity unit (CU) represents both components. By default, a Microsoft Purview account starts with one capacity unit and scales based on usage up to a maximum of 10 capacity units. Each capacity unit includes throughput of 25 operations per second and 10 GB of metadata storage.
The Data Map includes the following capabilities:
- Elastic Data Map with autoscale: Start with one capacity unit and automatically scale based on load up to 10 capacity units.
- Enhanced scanning and ingestion: Track and control how scanning and ingestion populate data assets, classifications, and lineage. This capability affects pricing.
Operation throughput
Operations measure the throughput of Microsoft Purview Data Map. They include create, read, write, update, and delete operations on metadata stored in the Data Map. Examples include:
- Creating an asset in the Data Map.
- Adding a relationship to an asset, such as an owner, steward, parent, or lineage.
- Editing an asset to add business metadata, such as a description or glossary term.
- Running a keyword search that returns results to the search results page.
Metadata storage
Storage includes technical, business, operational, and semantic metadata.
Technical metadata includes schemas, data types, and columns discovered through Microsoft Purview scanning. Business metadata includes automated metadata, such as metadata promoted from Microsoft Power BI datasets or descriptions from SQL tables, and manually added descriptions and glossary terms. Semantic metadata includes collection mappings to data sources or classifications. Operational metadata includes data factory copy and data flow activity run statuses and run times.
Example scenario
Claudia is a Microsoft Azure admin at Contoso who wants to create a Microsoft Purview account from the Azure portal. She doesn't know the Data Map size that the future state of the platform requires. However, she knows that Data Map billing uses capacity units and is affected by storage and operations throughput. She wants to start with the smallest Data Map to keep costs low and grow it elastically based on consumption.
Claudia can create a Microsoft Purview account with the default Data Map size of one capacity unit, which can automatically scale up and down. Autoscaling also allows capacity to adjust for intermittent or planned data bursts during specific periods. Claudia then configures the network settings and completes the account creation.
On the Microsoft Purview account's Metrics page in the Azure portal, Claudia can view Data Map storage and operations throughput consumption. She can also create an alert for when storage or operations throughput reaches a specified limit.
Data Map billing
Billing for classic Microsoft Purview accounts
You pay for one capacity unit, which includes 25 operations per second and 10 GB of metadata storage. Extra billing is based on the consumption of each extra capacity unit, calculated hourly. Data Map operations scale in increments of 25 operations per second, and metadata storage scales in increments of 10 GB. Data Map can automatically scale up and down within the elasticity window. You can increase the elasticity window only for classic Microsoft Purview accounts. To request an increase, review the current limits and create a support request.
Data Map capacity units come with a cap on operations throughput and storage. If storage exceeds the current capacity unit, you pay for the next capacity unit even if you don't use the operations throughput. The following table shows the Data Map capacity unit ranges. Contact support if the Data Map capacity unit goes beyond 10 capacity units.
| Data Map capacity unit | Operations-per-second throughput | Storage capacity in GB |
|---|---|---|
| 1 | 25 | 10 |
| 2 | 50 | 20 |
| 3 | 75 | 30 |
| 4 | 100 | 40 |
| 5 | 125 | 50 |
| 6 | 150 | 60 |
| 7 | 175 | 70 |
| 8 | 200 | 80 |
| 9 | 225 | 90 |
| 10 | 250 | 100 |
Billing examples
- The operation throughput for the hour is less than or equal to 25 operations per second, and the storage size is 1 GB. You pay for one capacity unit.
- The operation throughput for the hour is less than or equal to 25 operations per second, and the storage size is 15 GB. You pay for two capacity units.
- The operation throughput for the hour is 50 operations per second, and the storage size is 15 GB. You pay for two capacity units.
- The operation throughput for the hour is 50 operations per second, and the storage size is 25 GB. You pay for three capacity units.
- The operation throughput for the hour is 250 operations per second, and the storage size is 15 GB. You pay for 10 capacity units.
Detailed billing example
The Data Map billing example shows growing metadata storage and variable operations per second over a six-hour window from 12 PM to 6 PM. The dashed line shows operations per second, and the solid line shows metadata storage:
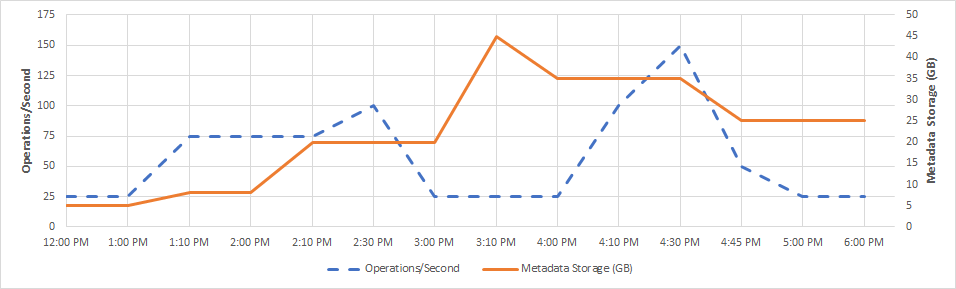
Each Data Map capacity unit supports 25 operations per second and 10 GB of metadata storage. The Data Map is billed hourly. The billing process considers the maximum Data Map capacity units needed within the hour, with a minimum of one capacity unit. At times, you might need more operations per second within the hour, and more operations increase the number of capacity units needed within that hour. At other times, your operations per second usage could be low, but you might still need a large volume of metadata storage. The metadata storage determines how many capacity units you need within the hour.
The table shows the maximum number of operations per second and metadata storage used per hour for this billing example:
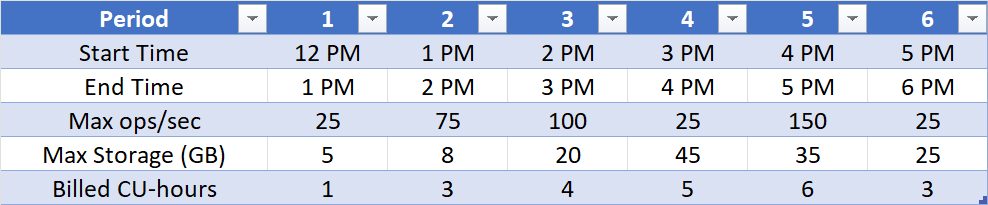
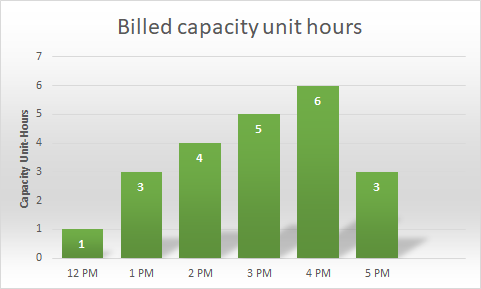
Based on the operations-per-second and metadata storage consumption during this period, the Data Map is billed for 22 capacity-unit hours over six hours (1 + 3 + 4 + 5 + 6 + 3):
Important
Data Map can automatically scale up and down within the elasticity window. To increase the elasticity window, review the current limits and create a support request.
Operations throughput limits
The default throughput limit is 10 capacity units. If you're working with a large Microsoft Purview environment and need higher throughput, you can request a larger elasticity window by creating a quota request. Select Data map capacity unit as the quota type. Include relevant information about your environment and the extra capacity that you need. You can increase the elasticity window only for classic Microsoft Purview accounts.
Important
There's no default limit for metadata storage. As you add more metadata to Data Map, it elastically increases.
When you increase the operations throughput limit, you also increase the minimum number of capacity units. For example, if you increase the throughput limit to 20, you pay for a minimum of two capacity units. The following table shows the possible throughput options. The number that you enter in the quota request is the minimum number of capacity units on the account.
| Minimum capacity units | Operations throughput limit |
|---|---|
| 1 | 10 (default) |
| 2 | 20 |
| 3 | 30 |
| 4 | 40 |
| 5 | 50 |
| 6 | 60 |
| 7 | 70 |
| 8 | 80 |
| 9 | 90 |
| 10 | 100 |
Optimize capacity units and operations throughput
Use these best practices to optimize capacity-unit and operations-throughput usage:
- Use incremental scans after the initial full scan. Incremental scans process only objects changed since the previous scan and typically provide the greatest reduction.
- Limit the scan scope and, where available, use Advanced mode to include or exclude specific paths instead of scanning the entire source.
- Stagger scan schedules. Avoid running several scans simultaneously; run them sequentially and outside peak usage periods.
- Reduce scan frequency. For example, change hourly scans to daily scans if the governance freshness requirement allows it.
- Disable lineage extraction if it is not required.
- Use separate, nonoverlapping scans.
- Clean up historical lineage regularly from Microsoft Purview storage.
- Manually remove nonessential or stale data from Microsoft Purview storage.
Monitoring and metrics
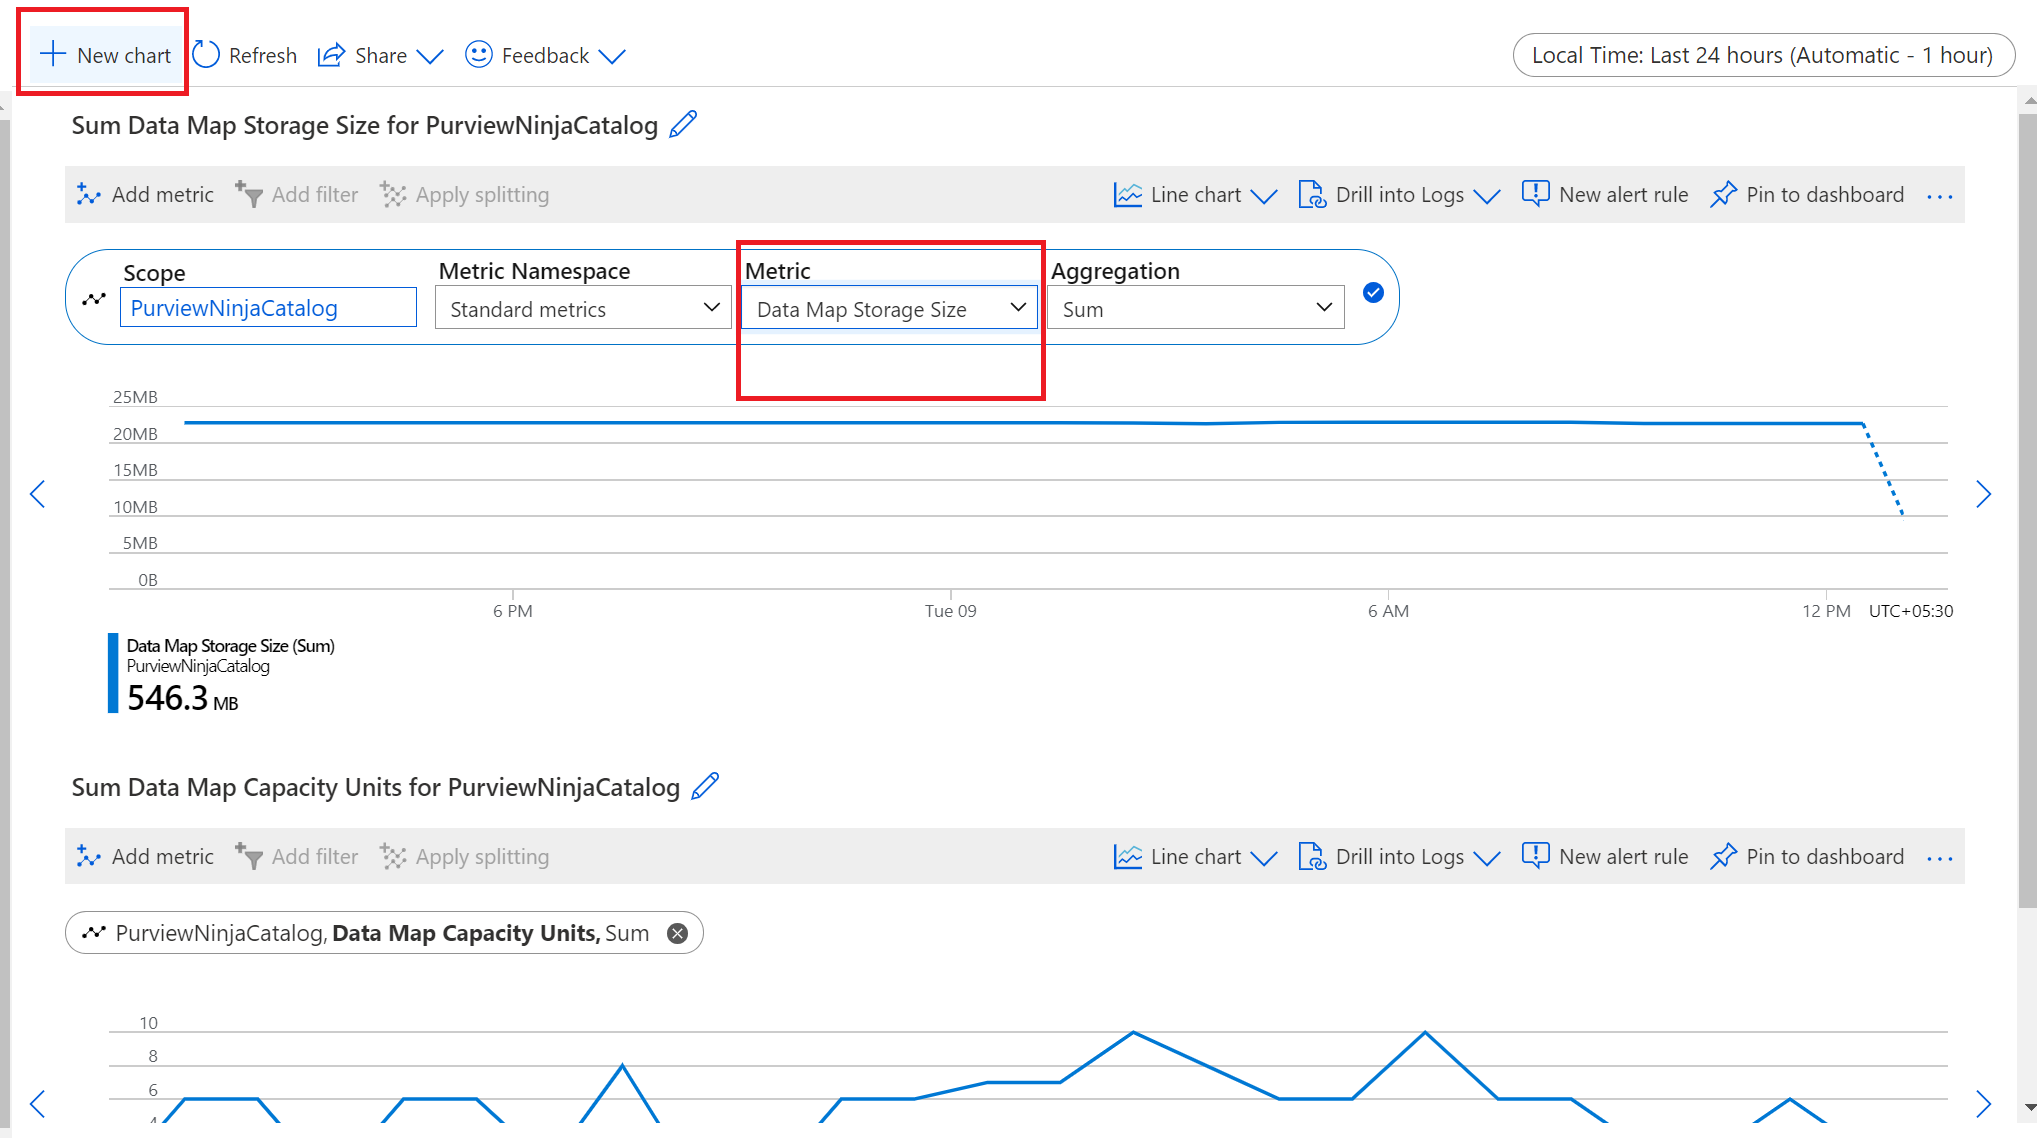
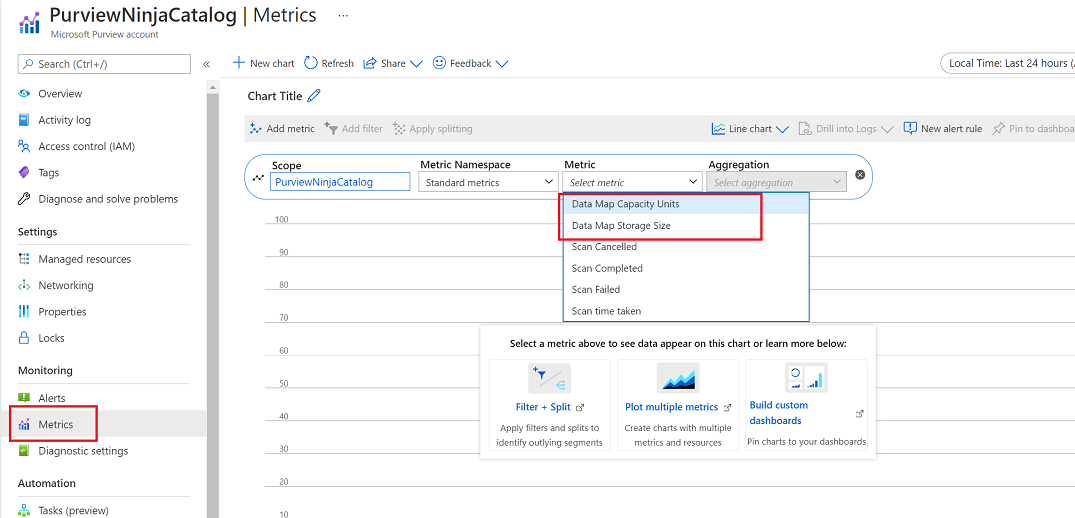
Monitor the Data Map Capacity Units and Data Map Storage Size metrics to understand the size and billing of your data estate.
In the Azure portal, go to Microsoft Purview accounts, and then select your Microsoft Purview account.
On the Overview page, scroll to the Monitoring section to view the Data Map Capacity Units and Data Map Storage Size metrics over different time periods.
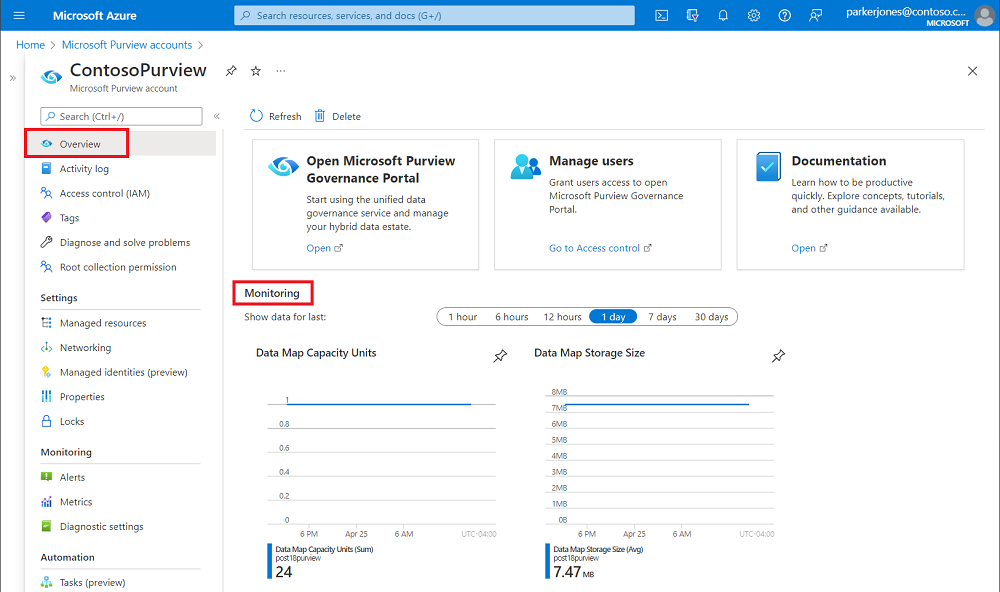
For more settings, go to Monitoring > Metrics to view Data Map Capacity Units and Data Map Storage Size.
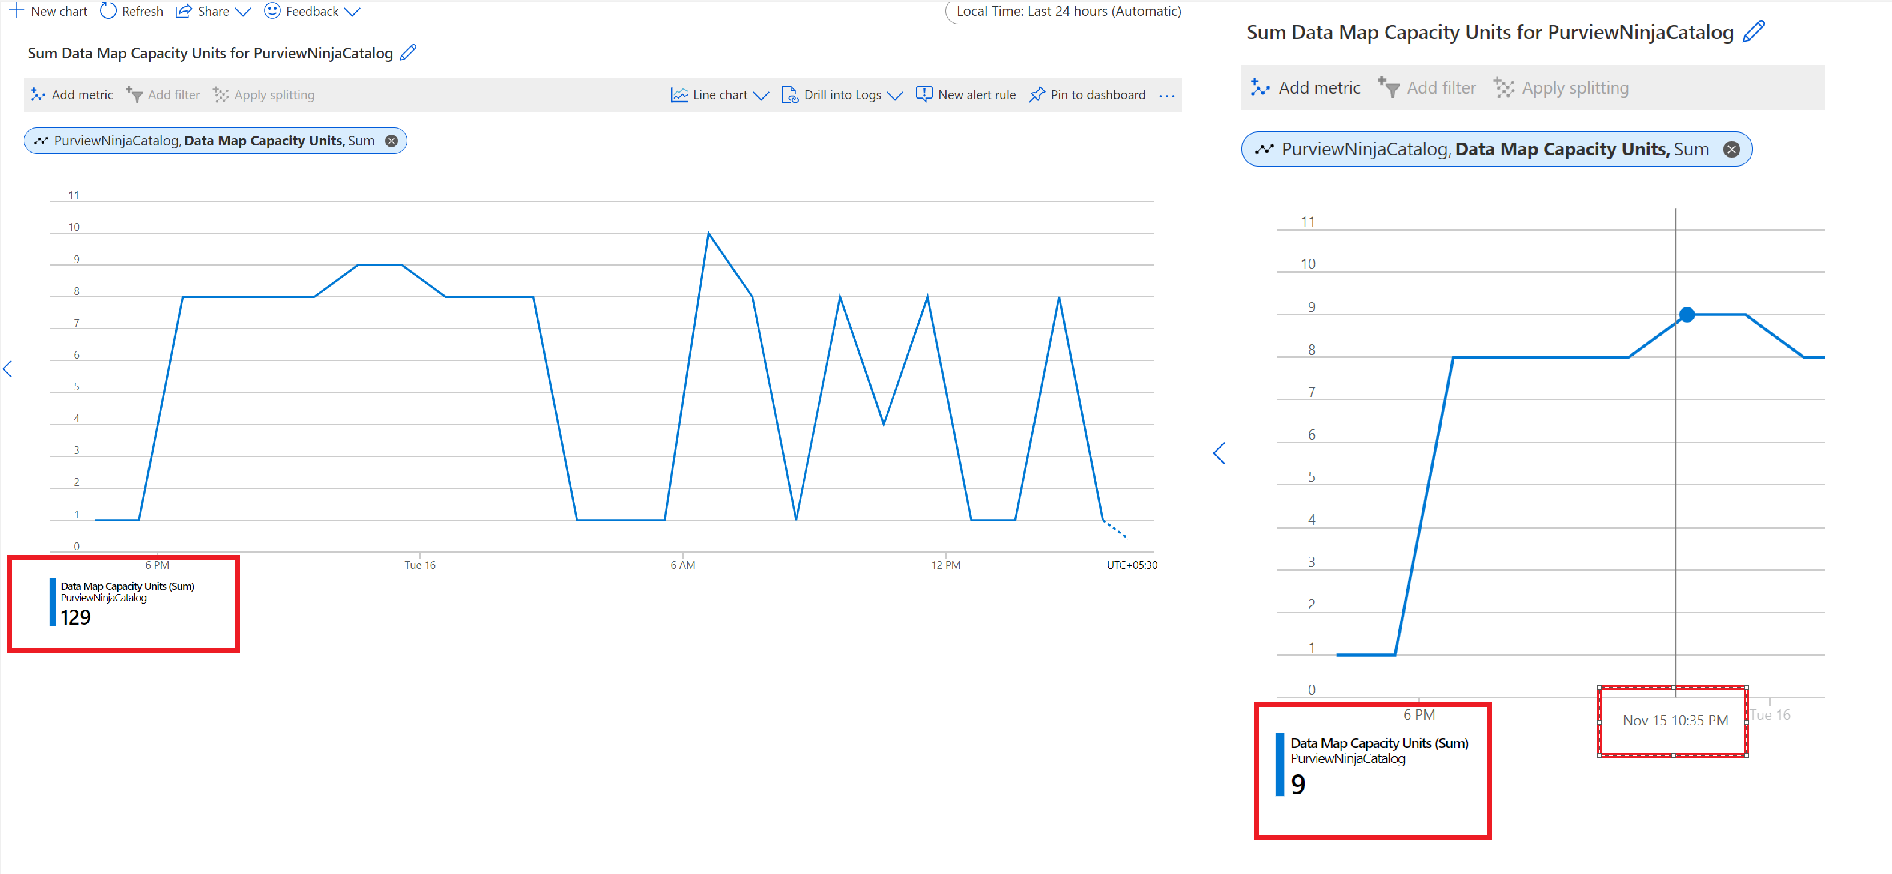
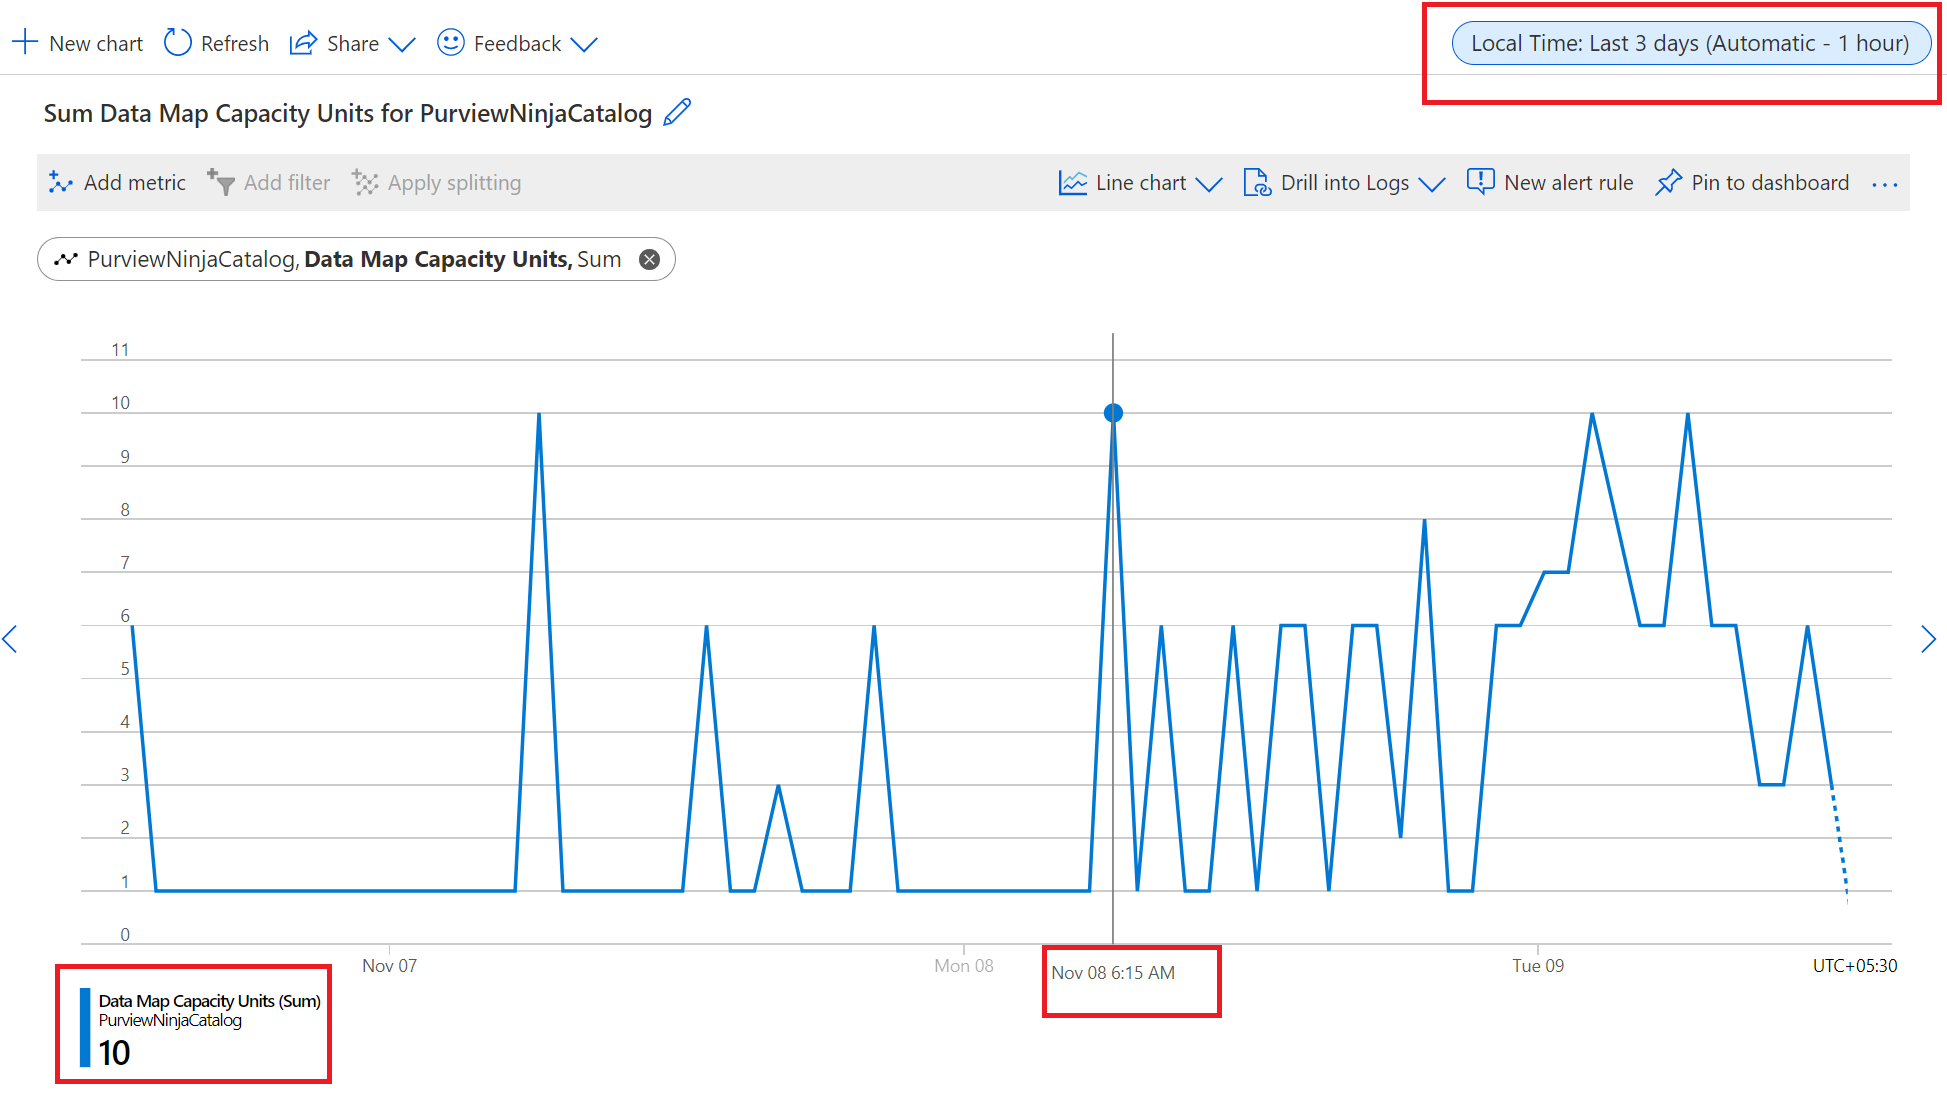
Select Data Map Capacity Units to view capacity unit usage over the last 24 hours. Hover over the line graph to view the Data Map capacity units consumed at a specific time.
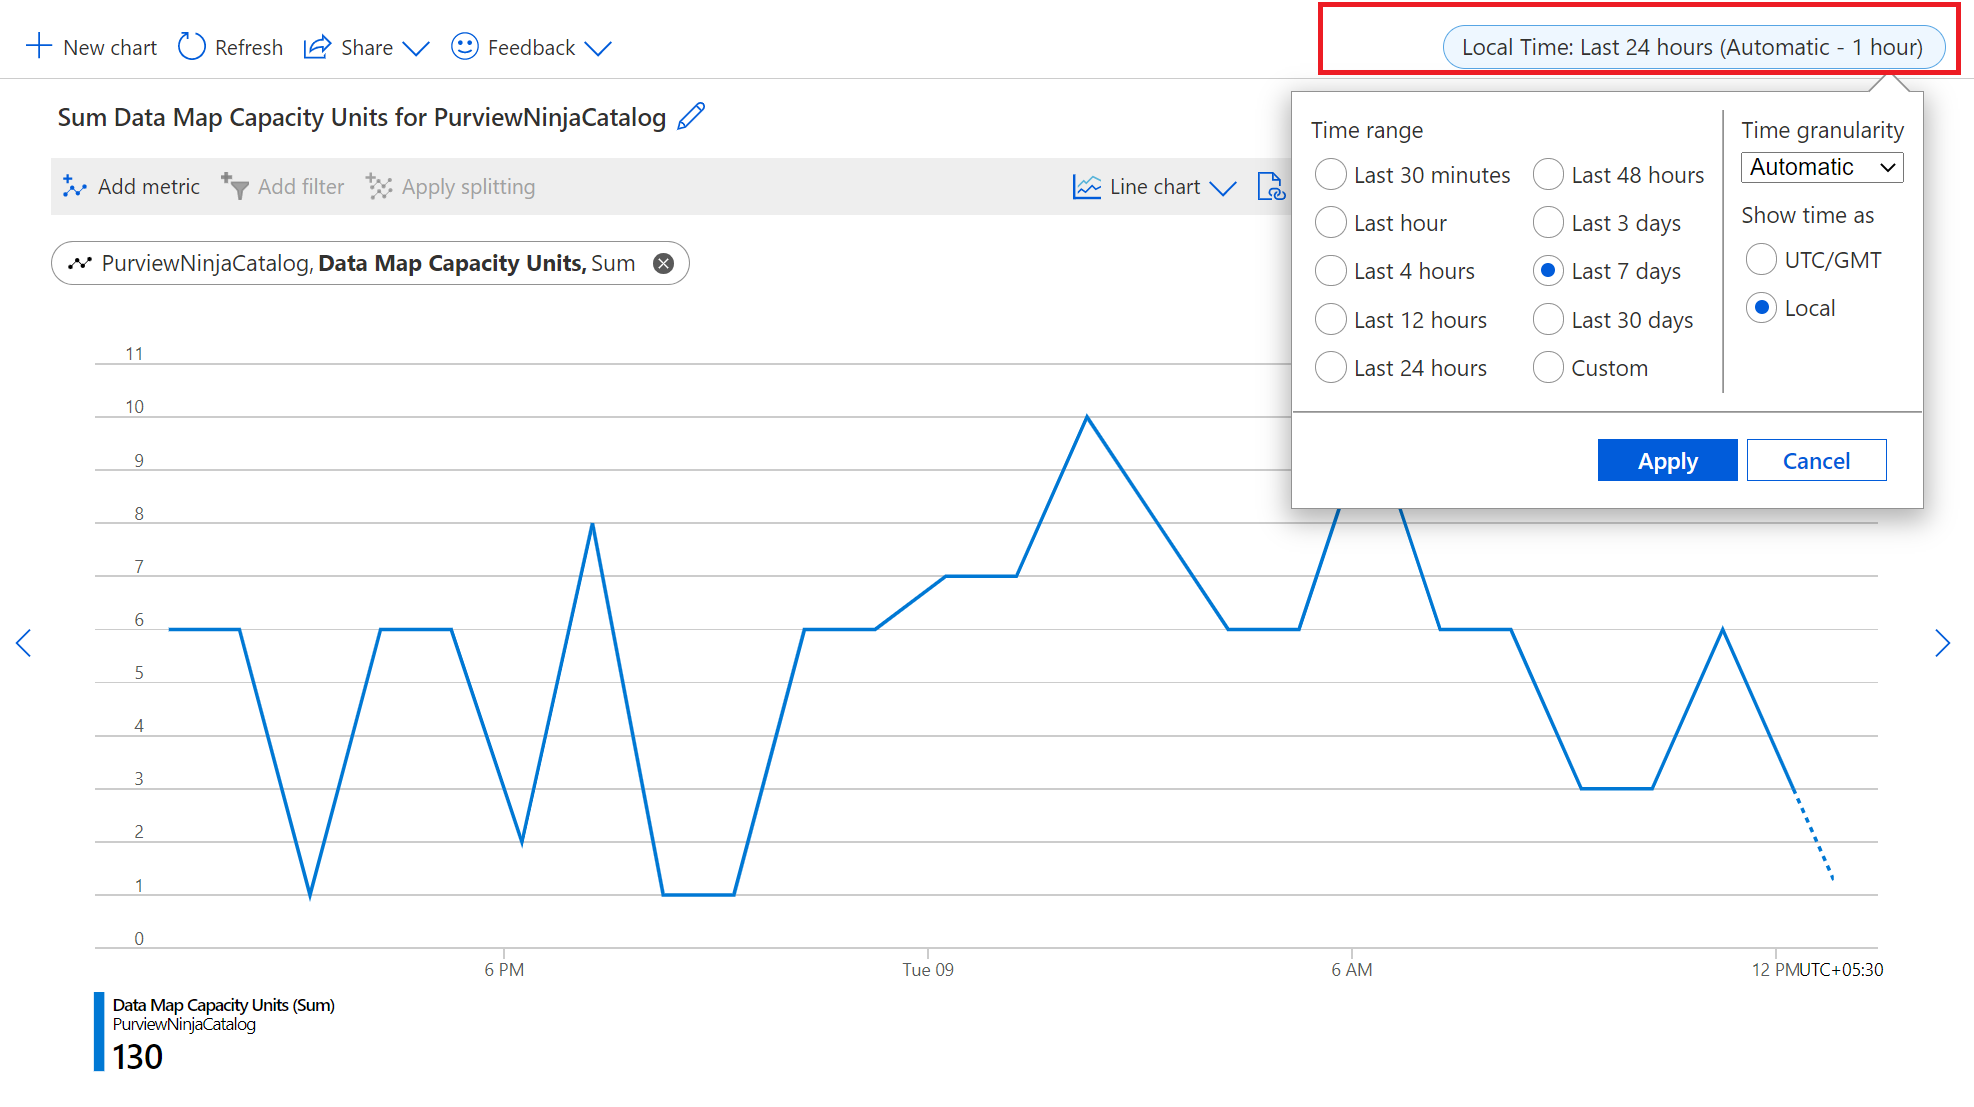
At the top of the page, select Local Time: Last 24 hours (Automatic - 1 hour) to change the time range displayed in the graph.
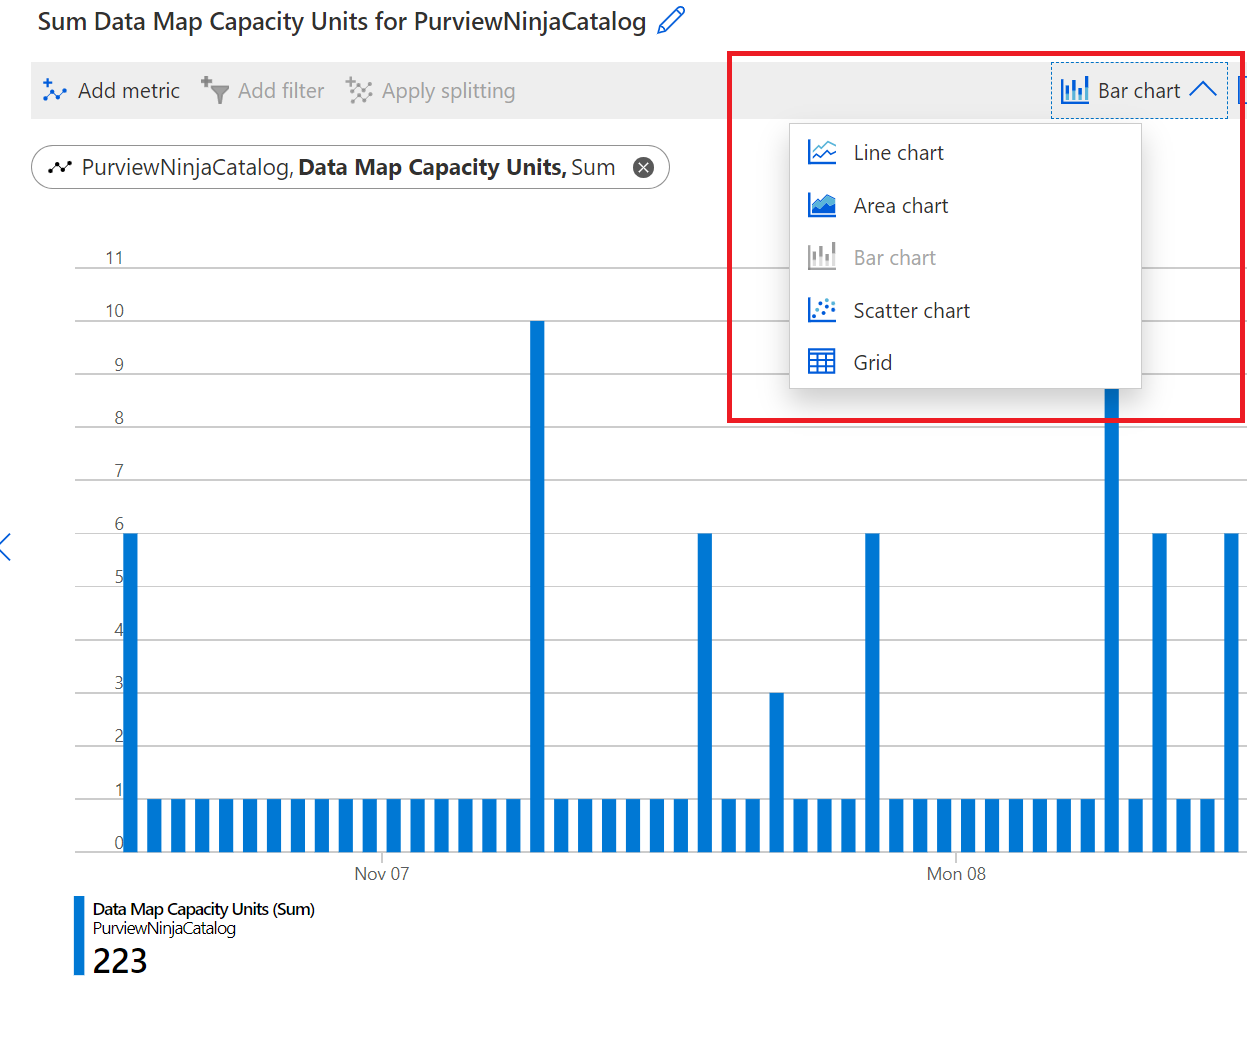
Select a graph type to customize the visualization.
Select New chart to add a Data Map Storage Size chart.