Add user marks to the profiling timeline (C#, C++)
User Marks enable you to track custom events against Visual Studio's profiling tools by adding user mark functions into your code. The user marks appear as visual marks on the timeline graphs. You can do this to track a single event, or track a range. For example, you could track a "stop" and "start" event range.
Note
This feature requires Visual Studio 2022 version 17.11 Preview 3. The feature is available in the Performance Profiler and not while debugging in the Diagnostics Hub.
Installation and setup
You can install support for the feature using either the NuGet package or by adding the correct source files.
Install using the NuGet Package (C#)
Download the package, Microsoft.VisualStudio.DiagnosticsHub.UserMarks.
Install by adding source files (C#, C++)
After installing Visual Studio, open the following folder: [VS installation path]\Common7\IDE\CommonExtensions\Platform\DiagnosticsHub.
For C# code, add UserMarks.cs and UserMarksRange.cs to your project.
For native C++ code, add UserMarks.h to your project.
Add user marks (C#)
Add the following preprocessor definition to the project build configuration: DIAGHUB_ENABLE_TRACE_SYSTEM.
To add the definition in Visual Studio:
Right-click the project in Solution Explorer and then select Properties.
Select Build > General > Conditional compilation symbols.
In the custom symbol fields for Debug and Release builds, add
DIAGHUB_ENABLE_TRACE_SYSTEMas the preprocessor definition.
Add the user marks object and emit. The following code shows an example of adding user marks.
using Microsoft.DiagnosticsHub;

// Create a user mark
var myUserMark = new UserMarks("MyMark");

// Emit the usermark
myUserMark.Emit("Event happened!");

// Emit statically
UserMarks.EmitMessage("Emitting just a message");

// Emitting a range
using (var myRange = new UserMarkRange("MyMethodRange"))
{
   // Your code here
}
Add user marks (C++)
To use the native user marks API, add UserMarks.h to the project and add the following code in your app:
#define DIAGHUB_ENABLE_TRACE_SYSTEM
#include "UserMarks.h"
DIAGHUB_DECLARE_TRACE;

// Start the trace system
DIAGHUB_START_TRACE_SYSTEM();

// Initialize user marks
USERMARKS_INITIALIZE(L"User mark name");

// Initialize user mark range
USERMARKRANGE_INITIALIZE(L"Range name");

// Emit events
USERMARKS_EMIT(L"Message to emit with user mark");
USERMARKRANGE_START(L"Message to emit with range");
USERMARKRANGE_END();

// Stop the trace system
DIAGHUB_STOP_TRACE_SYSTEM();
View user marks
With your project open in Visual Studio, open the Performance Profiler (Alt + F2), then select a tool and select the Start button.
Make sure that the user mark code you added to your app runs.
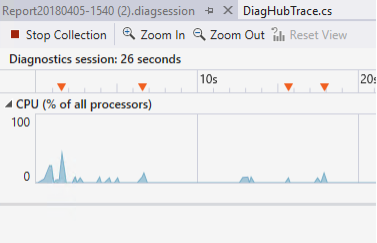
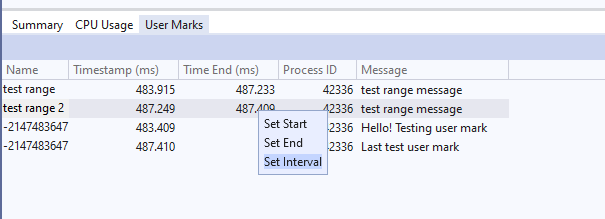
The user marks show on the ruler above the timeline graph and in a table with details about the timestamps, related process, and any messages you emitted.
In the timeline, the user mark appears as an inverted triangle.
In the Summary pane, select Show user marks to see details about the user marks.
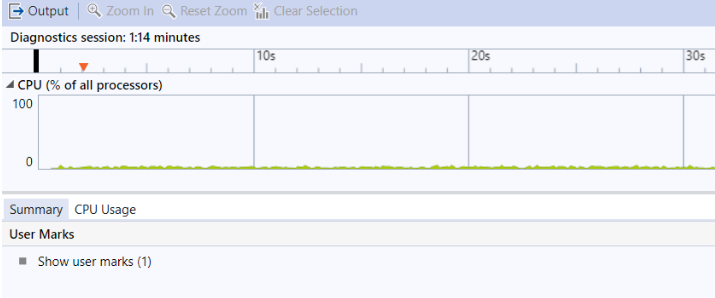
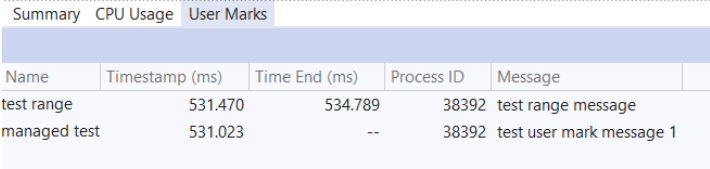
Details appear in the User Marks tab.
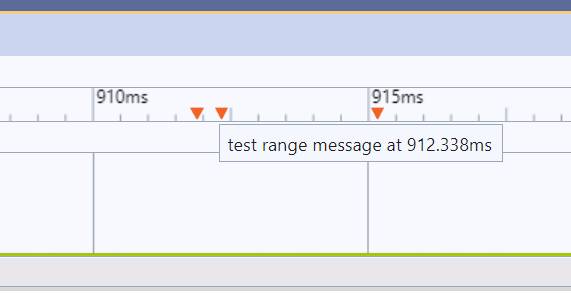
To see the user mark details in the timeline, hover over the marks in the ruler.
To filter the details view, select a time range in the timeline graph, or right-click a row and select start and end times to filter the timeline graph.
You can also filter the view by setting intervals on ranges or by selecting multiple user marks.
Related content
Povratne informacije
Stiže uskoro: Tijekom 2024. postupno ćemo ukinuti servis Problemi sa servisom GitHub kao mehanizam za povratne informacije za sadržaj i zamijeniti ga novim sustavom za povratne informacije. Dodatne informacije potražite u članku: https://aka.ms/ContentUserFeedback.
Pošaljite i pogledajte povratne informacije za