View events with IntelliTrace in Visual Studio Enterprise (C#, Visual Basic)
You can use IntelliTrace to collect information about specific events or categories of events, or about individual function calls in addition to events. The following procedures show how to do this.
You can use IntelliTrace in Visual Studio Enterprise edition, but not the Professional or Community editions.
Configure IntelliTrace
You can try debugging with just IntelliTrace events. IntelliTrace events are debugger events, exceptions, .NET Framework events, and other system events. You should turn on or turn off specific events to control the events that IntelliTrace records before you start debugging. For more information, see IntelliTrace Features.
- Turn on the IntelliTrace event for File Access. Go to the Tools > Options > IntelliTrace > IntelliTrace Events page, and expand the File category. Check the File event category. This causes all the file events (access, close, delete) to be checked.
Create your app
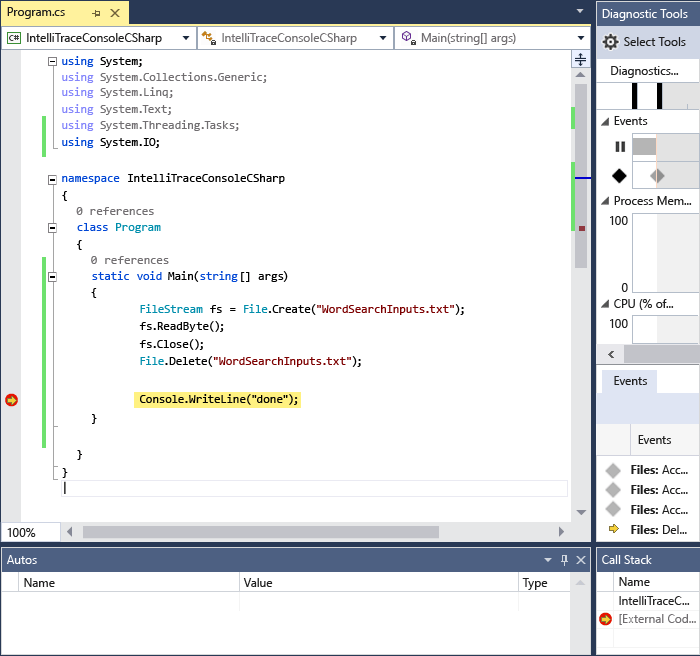
Create a C# console application. In the Program.cs file, add the following
usingstatement:using System.IO;Create a FileStream in the Main method, read from it, close it, and delete the file. Add another line just to have a place to set a breakpoint:
static void Main(string[] args)
{
    FileStream fs = File.Create("WordSearchInputs.txt");
    fs.ReadByte();
    fs.Close();
    File.Delete("WordSearchInputs.txt");

    Console.WriteLine("done");
}
Set a breakpoint on
Console.WriteLine("done");
Start debugging and view IntelliTrace events
Start debugging as usual. (Press F5 or click Debug > Start Debugging.)
Tip
Keep the Locals and Autos windows open while you're debugging to see and record the values in those windows.
Execution stops at the breakpoint. If you do not see the Diagnostic Tools window, click Debug > Windows > IntelliTrace Events.
In the Diagnostic Tools window, find the Events tab (You should see 3 tabs, Events, Memory Usage, and CPU Usage). The Events tab shows a chronological list of events, ending with the last event before the debugger broke execution. You should see an event named Access WordSearchInputs.txt.
Select the event to expand its details.
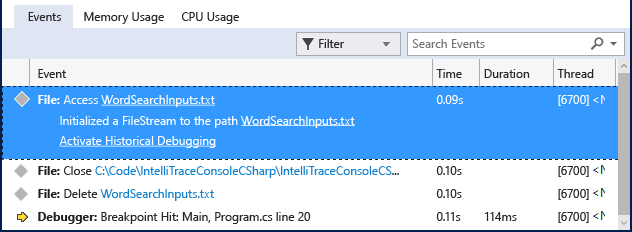
You can choose the pathname link to open the file. If the full pathname is not available, the Open File dialog box appears.
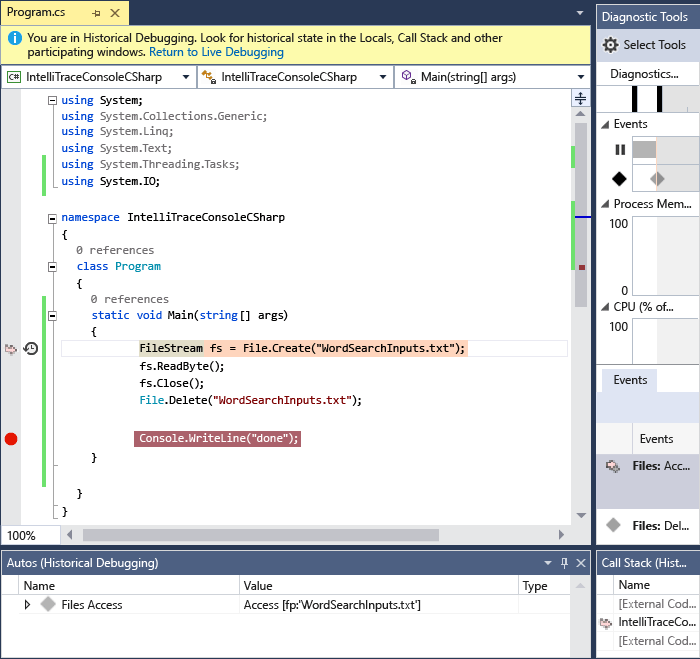
Click Activate Historical Debugging, which sets the debugger's context to the time when the selected event was collected, showing historical data in the Call Stack, Locals and the other participating debugger windows. If source code is available, Visual Studio moves the pointer to the corresponding code in the source window so you can examine it.
If you didn't find the bug, try examining other events leading up to the bug. You can also have IntelliTrace record call information so you can step through function calls.
Related content
You can use some of the advanced features of IntelliTrace with historical debugging:
- To view snapshots, see Inspect previous app states using IntelliTrace
- To learn how to inspect variables and navigate code, see Inspect your app with historical debugging
Visszajelzés
Hamarosan elérhető: 2024-ben fokozatosan kivezetjük a GitHub-problémákat a tartalom visszajelzési mechanizmusaként, és lecseréljük egy új visszajelzési rendszerre. További információ: https://aka.ms/ContentUserFeedback.
Visszajelzés küldése és megtekintése a következőhöz: