Generate a Report for Servers % Percent Memory Used
This post based on Windows Server Operating System Management Pack for Operations Manager 2007 version 6.0.6958.0, which contains a Windows Based Performance Collection Rule for the PercentMemoryUsed
Download here: https://www.microsoft.com/download/en/details.aspx?displaylang=en&id=9296
How to run a Performance Report
- Go to Reporting Space
- Microsoft Generic Report Library
- Open Performance Report
- Select Timeframe
- On Objects Space Select Change
- Create a Chart and a Series per Server
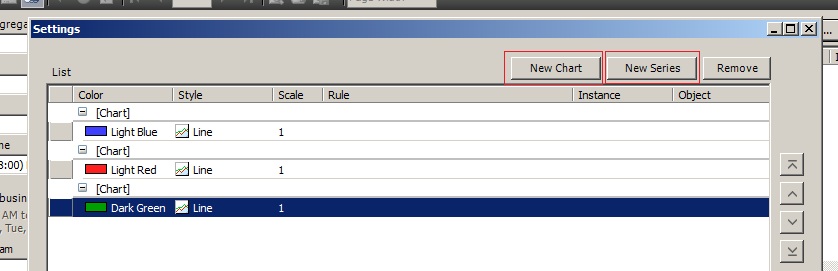
- Folllow the Steps
- Select first Series
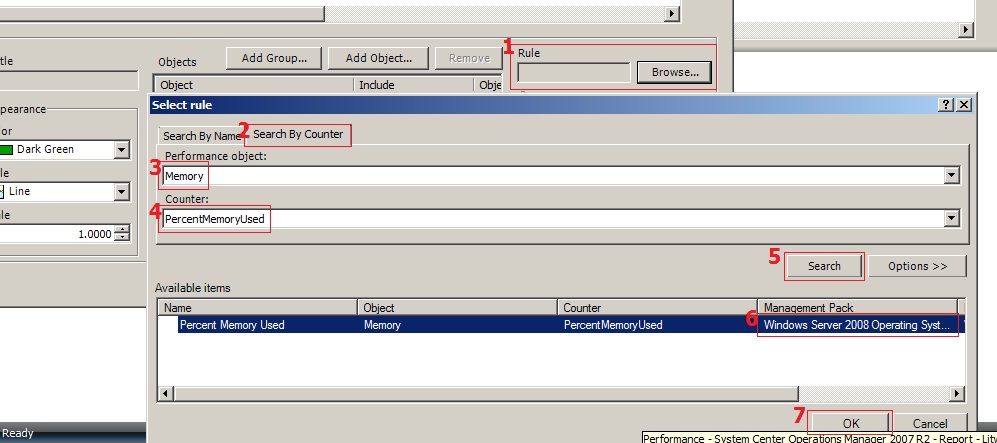
- Select the required "Windows Computers" from "Add Group"
- Repeat steps 9, 10 and 11 for each server you need to include in the Report
- Run the Report
- Finally Publish the Report to Authored Reports for future use (File | Publish | Rename the Report then Publish), you will find it in the Authored Reports
Enjoy your report..
Also you can use the following SQL Query to get the PercentMemoryUsed information:
--Start Here
USE OperationsManager
SELECT [Path], ObjectName, CounterName, InstanceName, SampleValue as [% Memory Used], TimeSampled
FROM PerformanceDataAllView pdv with (NOLOCK)
inner join PerformanceCounterView pcv on pdv.performancesourceinternalid = pcv.performancesourceinternalid
inner join BaseManagedEntity bme on pcv.ManagedEntityId = bme.BaseManagedEntityId
WHERE objectname = 'Memory'
AND countername = 'PercentMemoryUsed'
ORDER BY timesampled
-- End here
Comments
Anonymous
January 01, 2003
This could be used as a baseline for generating other performance reports, i.e. Processor Time / % Free Disk Space.. etc..Anonymous
November 04, 2013
Hi Very nice writeup. I tried the above but the result showed nothing on the report. It only date and time stamp. Anything I should be doing further.Anonymous
October 22, 2015
kindly use Name instead of [path] in the query, it will show you server name with date and time stamp.Anonymous
October 22, 2015
You could use below query for find out particular process processor time
USE OperationsManager
SELECT Name, ObjectName, CounterName, InstanceName, SampleValue as [% Processor Time], TimeSampled
FROM PerformanceDataAllView pdv with (NOLOCK)
inner join PerformanceCounterView pcv on pdv.performancesourceinternalid = pcv.performancesourceinternalid
inner join BaseManagedEntity bme on pcv.ManagedEntityId = bme.BaseManagedEntityId
AND InstanceName = '<>'
order by TimeSampled Desc
Note: If you are not getting output for particular process which means you are not collecting data for that process. So you have to create collection rule for that particular process before you are using above query,